Statistik Asas
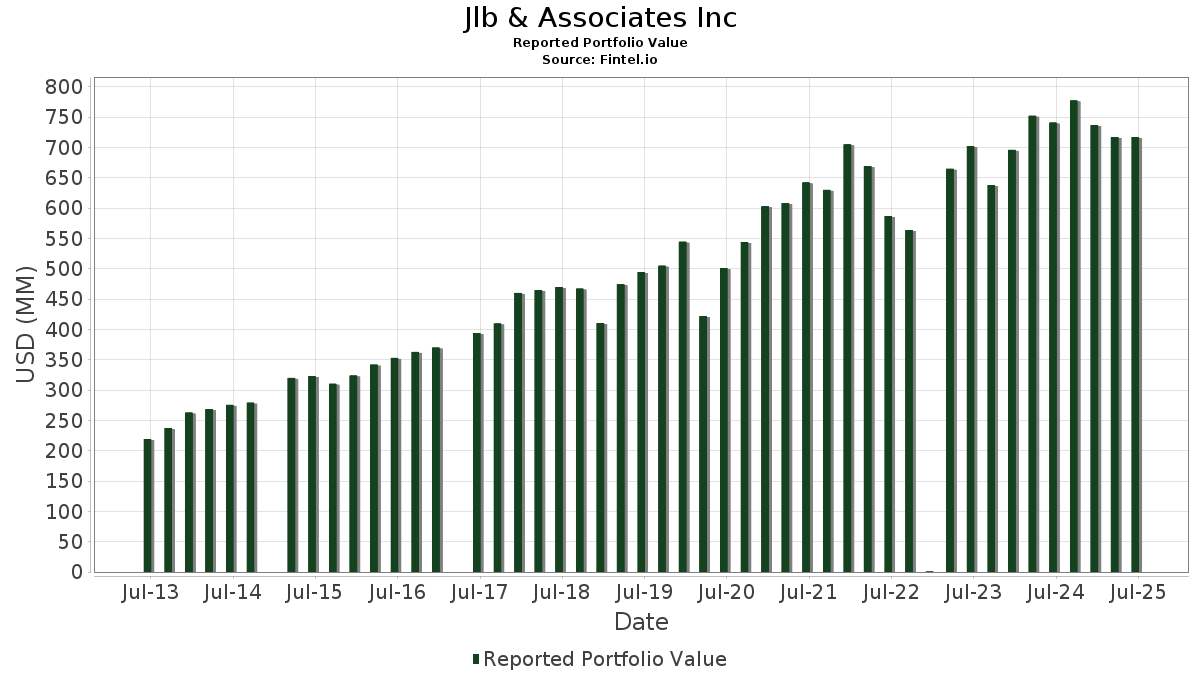
| Nilai Portfolio | $ 717,111,781 |
| Kedudukan Semasa | 75 |
Pegangan Terkini, Prestasi, AUM (dari 13F, 13D)
Jlb & Associates Inc telah mendedahkan 75 jumlah pegangan dalam pemfailan SEC terkini mereka. Nilai portfolio terkini dikira sebagai $ 717,111,781 USD. Aset Sebenar Di Bawah Pengurusan (AUM) ialah nilai ini ditambah dengan tunai (yang tidak didedahkan). Pegangan teratas Jlb & Associates Inc ialah Oracle Corporation (US:ORCL) , Amphenol Corporation (US:APH) , Mastercard Incorporated (US:MA) , Microsoft Corporation (US:MSFT) , and Apple Inc. (US:AAPL) . Kedudukan baharu Jlb & Associates Inc termasuk Genuine Parts Company (US:GPC) , .
Kenaikan Teratas Suku Tahun Ini
Kami menggunakan perubahan dalam peruntukan portfolio kerana ini adalah metrik yang paling bermakna. Perubahan boleh disebabkan oleh perdagangan atau perubahan dalam harga saham.
| Sekuriti | Saham (MM) |
Nilai (MM$) |
Portfolio % | ΔPortfolio % |
|---|---|---|---|---|
| 0.18 | 38.48 | 5.3663 | 1.7859 | |
| 0.33 | 32.58 | 4.5428 | 1.2287 | |
| 0.06 | 30.41 | 4.2406 | 0.8007 | |
| 0.05 | 23.88 | 3.3299 | 0.6077 | |
| 0.02 | 19.05 | 2.6563 | 0.6042 | |
| 0.27 | 24.11 | 3.3615 | 0.3670 | |
| 0.04 | 8.32 | 1.1608 | 0.2274 | |
| 0.00 | 3.52 | 0.4905 | 0.1915 | |
| 0.02 | 6.09 | 0.8488 | 0.1503 | |
| 0.01 | 2.38 | 0.3326 | 0.1262 |
Penurunan Teratas Suku Tahun Ini
Kami menggunakan perubahan dalam peruntukan portfolio kerana ini adalah metrik yang paling bermakna. Perubahan boleh disebabkan oleh perdagangan atau perubahan dalam harga saham.
| Sekuriti | Saham (MM) |
Nilai (MM$) |
Portfolio % | ΔPortfolio % |
|---|---|---|---|---|
| 0.04 | 11.58 | 1.6150 | -1.1058 | |
| 0.15 | 30.24 | 4.2164 | -0.8895 | |
| 0.40 | 19.44 | 2.7107 | -0.5837 | |
| 0.07 | 23.89 | 3.3316 | -0.4348 | |
| 0.08 | 21.93 | 3.0575 | -0.3621 | |
| 0.06 | 12.43 | 1.7338 | -0.3376 | |
| 0.07 | 18.53 | 2.5836 | -0.3355 | |
| 0.07 | 9.15 | 1.2759 | -0.2330 | |
| 0.04 | 7.86 | 1.0963 | -0.1837 | |
| 0.05 | 15.67 | 2.1854 | -0.1640 |
13F dan Pemfailan Dana
Borang ini telah difailkan pada 2025-07-17 untuk tempoh pelaporan 2025-06-30. Klik ikon pautan untuk melihat sejarah transaksi penuh.
Tingkatkan untuk membuka data premium dan eksport ke Excel ![]() .
.
| Sekuriti | Jenis | Purata Harga Saham | Saham (MM) |
ΔSaham (%) |
ΔSaham (%) |
Nilai ($MM) |
Portfolio (%) |
ΔPortfolio (%) |
|
|---|---|---|---|---|---|---|---|---|---|
| ORCL / Oracle Corporation | 0.18 | -4.15 | 38.48 | 49.89 | 5.3663 | 1.7859 | |||
| APH / Amphenol Corporation | 0.33 | -8.95 | 32.58 | 37.08 | 4.5428 | 1.2287 | |||
| MA / Mastercard Incorporated | 0.06 | -3.89 | 32.16 | -1.46 | 4.4843 | -0.0668 | |||
| MSFT / Microsoft Corporation | 0.06 | -6.96 | 30.41 | 23.28 | 4.2406 | 0.8007 | |||
| AAPL / Apple Inc. | 0.15 | -10.59 | 30.24 | -17.42 | 4.2164 | -0.8895 | |||
| TJX / The TJX Companies, Inc. | 0.23 | -0.96 | 28.18 | 0.41 | 3.9294 | 0.0161 | |||
| SEIC / SEI Investments Company | 0.27 | -3.02 | 24.11 | 12.26 | 3.3615 | 0.3670 | |||
| AON / Aon plc | 0.07 | -1.04 | 23.89 | -11.54 | 3.3316 | -0.4348 | |||
| CASY / Casey's General Stores, Inc. | 0.05 | 4.05 | 23.88 | 22.33 | 3.3299 | 0.6077 | |||
| PGR / The Progressive Corporation | 0.08 | -5.17 | 21.93 | -10.59 | 3.0575 | -0.3621 | |||
| ORLY / O'Reilly Automotive, Inc. | 0.23 | 1,410.82 | 20.88 | -4.95 | 2.9121 | -0.1517 | |||
| ROL / Rollins, Inc. | 0.35 | -2.26 | 19.68 | 2.07 | 2.7448 | 0.0554 | |||
| CPRT / Copart, Inc. | 0.40 | -5.10 | 19.44 | -17.72 | 2.7107 | -0.5837 | |||
| KLAC / KLA Corporation | 0.02 | -1.76 | 19.05 | 29.45 | 2.6563 | 0.6042 | |||
| AMGN / Amgen Inc. | 0.07 | -1.24 | 18.53 | -11.49 | 2.5836 | -0.3355 | |||
| GGG / Graco Inc. | 0.21 | -3.23 | 17.96 | -0.38 | 2.5047 | -0.0098 | |||
| ROST / Ross Stores, Inc. | 0.13 | -1.70 | 16.97 | -1.86 | 2.3658 | -0.0450 | |||
| ACN / Accenture plc | 0.05 | -2.88 | 15.67 | -6.98 | 2.1854 | -0.1640 | |||
| NVO / Novo Nordisk A/S - Depositary Receipt (Common Stock) | 0.22 | -0.47 | 15.06 | -1.07 | 2.1001 | -0.0230 | |||
| NOC / Northrop Grumman Corporation | 0.03 | 0.46 | 14.92 | -1.90 | 2.0803 | -0.0404 | |||
| PKG / Packaging Corporation of America | 0.08 | -2.49 | 14.86 | -7.21 | 2.0719 | -0.1610 | |||
| SHW / The Sherwin-Williams Company | 0.04 | 2.28 | 13.16 | 0.57 | 1.8349 | 0.0103 | |||
| EXPD / Expeditors International of Washington, Inc. | 0.11 | -1.41 | 12.97 | -6.33 | 1.8080 | -0.1223 | |||
| MMC / Marsh & McLennan Companies, Inc. | 0.06 | -6.57 | 12.43 | -16.29 | 1.7338 | -0.3376 | |||
| TTC / The Toro Company | 0.17 | -2.18 | 12.32 | -4.96 | 1.7178 | -0.0897 | |||
| UNH / UnitedHealth Group Incorporated | 0.04 | -0.34 | 11.58 | -40.64 | 1.6150 | -1.1058 | |||
| AME / AMETEK, Inc. | 0.06 | -6.03 | 11.06 | -1.22 | 1.5420 | -0.0190 | |||
| SYK / Stryker Corporation | 0.03 | -3.83 | 10.62 | 2.20 | 1.4816 | 0.0319 | |||
| HSY / The Hershey Company | 0.06 | -2.09 | 10.10 | -5.00 | 1.4091 | -0.0742 | |||
| PEP / PepsiCo, Inc. | 0.07 | -3.98 | 9.15 | -15.44 | 1.2759 | -0.2330 | |||
| LLY / Eli Lilly and Company | 0.01 | -5.46 | 8.42 | -10.77 | 1.1736 | -0.1418 | |||
| TSM / Taiwan Semiconductor Manufacturing Company Limited - Depositary Receipt (Common Stock) | 0.04 | -8.85 | 8.32 | 24.37 | 1.1608 | 0.2274 | |||
| CNI / Canadian National Railway Company | 0.08 | -2.63 | 8.18 | 3.94 | 1.1403 | 0.0432 | |||
| ABBV / AbbVie Inc. | 0.04 | -3.32 | 7.86 | -14.35 | 1.0963 | -0.1837 | |||
| AXP / American Express Company | 0.02 | 2.50 | 6.09 | 21.52 | 0.8488 | 0.1503 | |||
| V / Visa Inc. | 0.02 | 0.51 | 5.71 | 1.82 | 0.7961 | 0.0142 | |||
| HSIC / Henry Schein, Inc. | 0.08 | -2.85 | 5.54 | 3.63 | 0.7731 | 0.0270 | |||
| GOOGL / Alphabet Inc. | 0.03 | -0.07 | 5.17 | 13.46 | 0.7216 | 0.0856 | |||
| PRI / Primerica, Inc. | 0.02 | -3.68 | 5.05 | -7.37 | 0.7043 | -0.0560 | |||
| FDS / FactSet Research Systems Inc. | 0.01 | -4.32 | 4.81 | -5.87 | 0.6706 | -0.0418 | |||
| GPC / Genuine Parts Company | 0.04 | 4.79 | 0.0000 | ||||||
| ALLE / Allegion plc | 0.03 | 5.94 | 4.73 | 17.05 | 0.6598 | 0.0960 | |||
| PCAR / PACCAR Inc | 0.05 | -6.51 | 4.65 | -8.73 | 0.6485 | -0.0621 | |||
| CTSH / Cognizant Technology Solutions Corporation | 0.05 | -4.95 | 4.15 | -3.04 | 0.5790 | -0.0182 | |||
| LOW / Lowe's Companies, Inc. | 0.02 | 6.55 | 3.57 | 1.36 | 0.4983 | 0.0067 | |||
| META / Meta Platforms, Inc. | 0.00 | 28.08 | 3.52 | 64.04 | 0.4905 | 0.1915 | |||
| CBRE / CBRE Group, Inc. | 0.03 | -4.03 | 3.51 | 2.85 | 0.4888 | 0.0134 | |||
| A / Agilent Technologies, Inc. | 0.03 | 1.85 | 3.50 | 2.76 | 0.4880 | 0.0130 | |||
| SERVICE CORP INTL / (783890106) | 0.04 | 3.14 | 0.0000 | ||||||
| SLGN / Silgan Holdings Inc. | 0.06 | -1.89 | 3.11 | 3.98 | 0.4335 | 0.0166 | |||
| MOH / Molina Healthcare, Inc. | 0.01 | -2.43 | 3.09 | -11.77 | 0.4307 | -0.0574 | |||
| NKE / NIKE, Inc. | 0.04 | -29.55 | 3.05 | -21.17 | 0.4254 | -0.1142 | |||
| TROW / T. Rowe Price Group, Inc. | 0.03 | -26.22 | 2.84 | -22.50 | 0.3962 | -0.1151 | |||
| CSCO / Cisco Systems, Inc. | 0.04 | 1.05 | 2.44 | 13.63 | 0.3406 | 0.0408 | |||
| AVGO / Broadcom Inc. | 0.01 | -2.12 | 2.38 | 61.19 | 0.3326 | 0.1262 | |||
| TNET / TriNet Group, Inc. | 0.03 | -8.18 | 2.34 | -15.26 | 0.3269 | -0.0589 | |||
| KMB / Kimberly-Clark Corporation | 0.01 | 0.00 | 1.91 | -9.34 | 0.2666 | -0.0275 | |||
| MTD / Mettler-Toledo International Inc. | 0.00 | -6.20 | 1.78 | -6.67 | 0.2480 | -0.0178 | |||
| G / Genpact Limited | 0.04 | 1.41 | 1.64 | -11.43 | 0.2292 | -0.0296 | |||
| MKC / McCormick & Company, Incorporated | 0.02 | -17.67 | 1.31 | -24.15 | 0.1827 | -0.0582 | |||
| EXP / Eagle Materials Inc. | 0.01 | 42.79 | 1.23 | 29.96 | 0.1719 | 0.0397 | |||
| DEO / Diageo plc - Depositary Receipt (Common Stock) | 0.01 | -44.62 | 0.85 | -46.72 | 0.1192 | -0.1045 | |||
| STX / Seagate Technology Holdings plc | 0.01 | -1.46 | 0.85 | 67.66 | 0.1178 | 0.0474 | |||
| UPS / United Parcel Service, Inc. | 0.01 | -37.01 | 0.83 | -42.21 | 0.1154 | -0.0842 | |||
| CDNS / Cadence Design Systems, Inc. | 0.00 | -27.17 | 0.65 | -11.70 | 0.0905 | -0.0121 | |||
| UFPI / UFP Industries, Inc. | 0.01 | -11.80 | 0.58 | -18.19 | 0.0810 | -0.0179 | |||
| EVTC / EVERTEC, Inc. | 0.01 | -5.12 | 0.50 | -7.05 | 0.0700 | -0.0053 | |||
| TGT / Target Corporation | 0.00 | -53.86 | 0.48 | -56.45 | 0.0675 | -0.0873 | |||
| MMS / Maximus, Inc. | 0.01 | -7.48 | 0.46 | -4.93 | 0.0647 | -0.0032 | |||
| CP / Canadian Pacific Kansas City Limited | 0.01 | -52.03 | 0.46 | -45.90 | 0.0635 | -0.0538 | |||
| NVDA / NVIDIA Corporation | 0.00 | 0.00 | 0.30 | 45.89 | 0.0422 | 0.0133 | |||
| CHDN / Churchill Downs Incorporated | 0.00 | 3.80 | 0.29 | -5.56 | 0.0404 | -0.0024 | |||
| NEU / NewMarket Corporation | 0.00 | 0.29 | 0.0404 | 0.0404 | |||||
| GNTX / Gentex Corporation | 0.01 | -47.01 | 0.23 | -50.11 | 0.0327 | -0.0327 | |||
| BKE / The Buckle, Inc. | 0.01 | 0.23 | 0.0316 | 0.0316 | |||||
| PRS / Prudential Financial, Inc. - Corporate Bond/Note | 0.00 | -100.00 | 0.00 | 0.0000 | |||||
| RHI / Robert Half Inc. | 0.00 | -100.00 | 0.00 | 0.0000 |