Statistik Asas
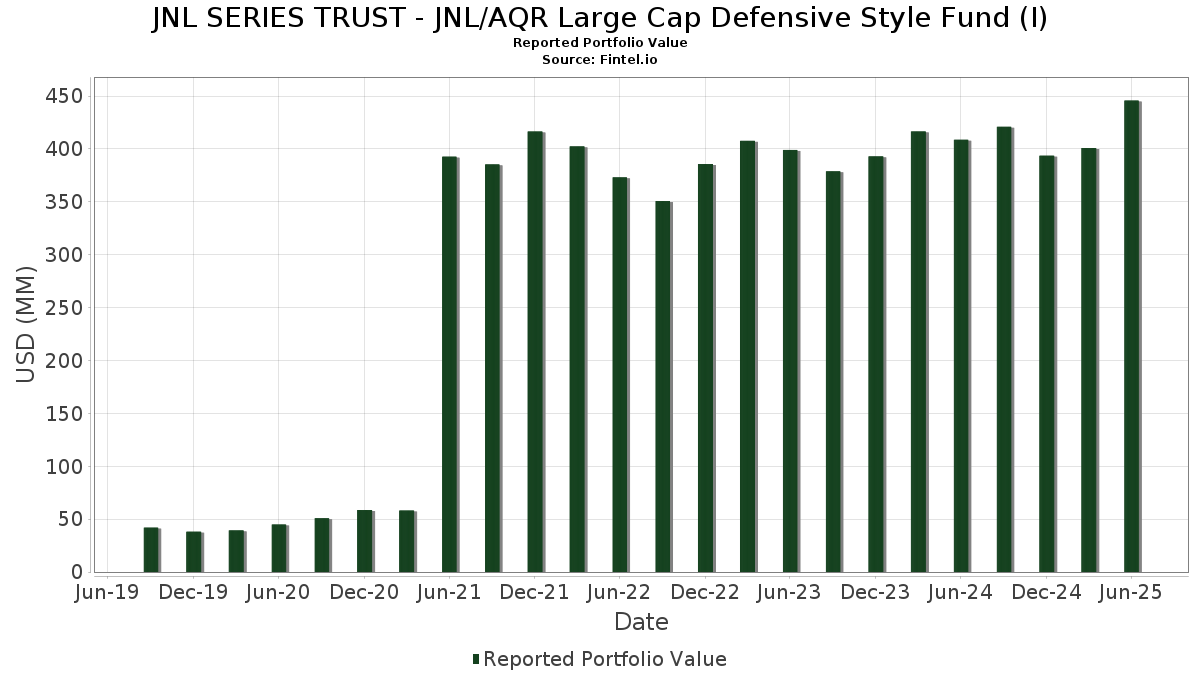
| Nilai Portfolio | $ 445,680,047 |
| Kedudukan Semasa | 166 |
Pegangan Terkini, Prestasi, AUM (dari 13F, 13D)
JNL SERIES TRUST - JNL/AQR Large Cap Defensive Style Fund (I) telah mendedahkan 166 jumlah pegangan dalam pemfailan SEC terkini mereka. Nilai portfolio terkini dikira sebagai $ 445,680,047 USD. Aset Sebenar Di Bawah Pengurusan (AUM) ialah nilai ini ditambah dengan tunai (yang tidak didedahkan). Pegangan teratas JNL SERIES TRUST - JNL/AQR Large Cap Defensive Style Fund (I) ialah JNL Government Money Market Fund (US:46628D437) , Arista Networks Inc (US:ANET) , Meta Platforms, Inc. (US:META) , Alphabet Inc. (US:GOOGL) , and Cboe Global Markets, Inc. (US:CBOE) . Kedudukan baharu JNL SERIES TRUST - JNL/AQR Large Cap Defensive Style Fund (I) termasuk Dell Technologies Inc. (US:DELL) , Trane Technologies plc (DE:2IS) , Civitas Resources, Inc. (US:CIVI) , Lam Research Corporation (US:LRCX) , and General Motors Company (US:GM) .
Kenaikan Teratas Suku Tahun Ini
Kami menggunakan perubahan dalam peruntukan portfolio kerana ini adalah metrik yang paling bermakna. Perubahan boleh disebabkan oleh perdagangan atau perubahan dalam harga saham.
| Sekuriti | Saham (MM) |
Nilai (MM$) |
Portfolio % | ΔPortfolio % |
|---|---|---|---|---|
| 27.10 | 27.10 | 6.0826 | 2.9591 | |
| 0.08 | 8.32 | 1.8669 | 1.3620 | |
| 0.04 | 4.95 | 1.1117 | 1.1117 | |
| 0.01 | 3.74 | 0.8396 | 0.8396 | |
| 0.02 | 2.97 | 0.6660 | 0.6454 | |
| 0.00 | 1.93 | 0.4343 | 0.4128 | |
| 0.04 | 6.62 | 1.4850 | 0.4082 | |
| 1.72 | 1.72 | 0.3868 | 0.3816 | |
| 0.06 | 1.66 | 0.3722 | 0.3722 | |
| 0.01 | 1.41 | 0.3161 | 0.3161 |
Penurunan Teratas Suku Tahun Ini
Kami menggunakan perubahan dalam peruntukan portfolio kerana ini adalah metrik yang paling bermakna. Perubahan boleh disebabkan oleh perdagangan atau perubahan dalam harga saham.
| Sekuriti | Saham (MM) |
Nilai (MM$) |
Portfolio % | ΔPortfolio % |
|---|---|---|---|---|
| 0.01 | 2.54 | 0.5694 | -0.8471 | |
| 0.00 | 1.57 | 0.3529 | -0.8339 | |
| 0.01 | 3.11 | 0.6992 | -0.6033 | |
| 0.01 | 1.40 | 0.3152 | -0.5240 | |
| 0.00 | 1.17 | 0.2618 | -0.4588 | |
| 0.22 | 6.25 | 1.4039 | -0.3879 | |
| 0.03 | 6.33 | 1.4215 | -0.3691 | |
| 0.06 | 5.68 | 1.2761 | -0.3650 | |
| 0.00 | 1.35 | 0.3034 | -0.3490 | |
| 0.02 | 5.37 | 1.2059 | -0.3121 |
13F dan Pemfailan Dana
Borang ini telah difailkan pada 2025-08-27 untuk tempoh pelaporan 2025-06-30. Klik ikon pautan untuk melihat sejarah transaksi penuh.
Tingkatkan untuk membuka data premium dan eksport ke Excel ![]() .
.
| Sekuriti | Jenis | Purata Harga Saham | Saham (MM) |
ΔSaham (%) |
ΔSaham (%) |
Nilai ($MM) |
Portfolio (%) |
ΔPortfolio (%) |
|
|---|---|---|---|---|---|---|---|---|---|
| 46628D437 / JNL Government Money Market Fund | 27.10 | 116.09 | 27.10 | 116.09 | 6.0826 | 2.9591 | |||
| ANET / Arista Networks Inc | 0.08 | 210.71 | 8.32 | 310.31 | 1.8669 | 1.3620 | |||
| META / Meta Platforms, Inc. | 0.01 | 0.00 | 6.69 | 28.08 | 1.5010 | 0.2004 | |||
| GOOGL / Alphabet Inc. | 0.04 | 34.28 | 6.62 | 53.02 | 1.4850 | 0.4082 | |||
| CBOE / Cboe Global Markets, Inc. | 0.03 | 0.00 | 6.48 | 3.07 | 1.4555 | -0.1117 | |||
| CSCO / Cisco Systems, Inc. | 0.09 | 0.00 | 6.44 | 12.42 | 1.4465 | 0.0188 | |||
| GE / General Electric Company | 0.02 | 0.00 | 6.38 | 28.60 | 1.4323 | 0.1964 | |||
| PM / Philip Morris International Inc. | 0.03 | -23.22 | 6.33 | -11.91 | 1.4215 | -0.3691 | |||
| T / AT&T Inc. | 0.22 | -15.04 | 6.25 | -13.05 | 1.4039 | -0.3879 | |||
| MCK / McKesson Corporation | 0.01 | -11.87 | 6.23 | -4.05 | 1.3980 | -0.2187 | |||
| CME / CME Group Inc. | 0.02 | -8.26 | 6.21 | -4.70 | 1.3930 | -0.2288 | |||
| V / Visa Inc. | 0.02 | -1.24 | 6.17 | 0.05 | 1.3856 | -0.1512 | |||
| SPF / Spotify Technology S.A. | 0.01 | -26.39 | 6.12 | 2.68 | 1.3748 | -0.1108 | |||
| MA / Mastercard Incorporated | 0.01 | 0.00 | 6.05 | 2.53 | 1.3579 | -0.1118 | |||
| RSG / Republic Services, Inc. | 0.02 | -9.13 | 5.98 | -7.46 | 1.3432 | -0.2674 | |||
| CB / Chubb Limited | 0.02 | 0.00 | 5.95 | -4.07 | 1.3347 | -0.2091 | |||
| COST / Costco Wholesale Corporation | 0.01 | -0.96 | 5.91 | 3.66 | 1.3277 | -0.0935 | |||
| ABT / Abbott Laboratories | 0.04 | 0.00 | 5.91 | 2.54 | 1.3256 | -0.1090 | |||
| ADP / Automatic Data Processing, Inc. | 0.02 | 0.00 | 5.90 | 0.94 | 1.3244 | -0.1316 | |||
| PGR / The Progressive Corporation | 0.02 | -1.14 | 5.88 | -6.79 | 1.3199 | -0.2513 | |||
| EA / Electronic Arts Inc. | 0.04 | 0.00 | 5.87 | 10.52 | 1.3186 | -0.0055 | |||
| WM / Waste Management, Inc. | 0.03 | -4.23 | 5.87 | -5.34 | 1.3165 | -0.2268 | |||
| VZ / Verizon Communications Inc. | 0.13 | 0.00 | 5.83 | -4.62 | 1.3081 | -0.2136 | |||
| WMT / Walmart Inc. | 0.06 | -4.96 | 5.70 | 5.87 | 1.2788 | -0.0617 | |||
| ORLY / O'Reilly Automotive, Inc. | 0.06 | 1,271.49 | 5.68 | -13.72 | 1.2761 | -0.3650 | |||
| KO / The Coca-Cola Company | 0.08 | -8.20 | 5.67 | -9.32 | 1.2737 | -0.2849 | |||
| JNJ / Johnson & Johnson | 0.04 | 0.00 | 5.62 | -7.90 | 1.2608 | -0.2582 | |||
| KR / The Kroger Co. | 0.08 | 0.00 | 5.61 | 5.98 | 1.2602 | -0.0594 | |||
| PG / The Procter & Gamble Company | 0.03 | 0.00 | 5.46 | -6.51 | 1.2255 | -0.2291 | |||
| MCD / McDonald's Corporation | 0.02 | -5.76 | 5.37 | -11.85 | 1.2059 | -0.3121 | |||
| AZO / AutoZone, Inc. | 0.00 | 0.00 | 5.35 | -2.64 | 1.2016 | -0.1679 | |||
| CL / Colgate-Palmolive Company | 0.06 | 0.00 | 5.25 | -2.99 | 1.1795 | -0.1697 | |||
| BKNG / Booking Holdings Inc. | 0.00 | 0.00 | 5.22 | 25.66 | 1.1721 | 0.1371 | |||
| MNST / Monster Beverage Corporation | 0.08 | 0.00 | 5.05 | 7.04 | 1.1330 | -0.0416 | |||
| DELL / Dell Technologies Inc. | 0.04 | 4.95 | 1.1117 | 1.1117 | |||||
| ROP / Roper Technologies, Inc. | 0.01 | 0.00 | 4.94 | -3.87 | 1.1095 | -0.1711 | |||
| LMT / Lockheed Martin Corporation | 0.01 | 0.00 | 4.87 | 3.68 | 1.0942 | -0.0769 | |||
| ZM / Zoom Communications Inc. | 0.06 | 0.36 | 4.43 | 6.11 | 0.9946 | -0.0458 | |||
| COR / Cencora, Inc. | 0.01 | 0.00 | 4.28 | 7.84 | 0.9599 | -0.0280 | |||
| EOG / EOG Resources, Inc. | 0.03 | 0.00 | 4.17 | -6.74 | 0.9355 | -0.1775 | |||
| TRV / The Travelers Companies, Inc. | 0.02 | 0.00 | 4.12 | 1.15 | 0.9244 | -0.0896 | |||
| PEP / PepsiCo, Inc. | 0.03 | 0.00 | 4.06 | -11.95 | 0.9117 | -0.2371 | |||
| IBM / International Business Machines Corporation | 0.01 | 0.00 | 4.00 | 18.55 | 0.8982 | 0.0574 | |||
| 2IS / Trane Technologies plc | 0.01 | 3.74 | 0.8396 | 0.8396 | |||||
| MSFT / Microsoft Corporation | 0.01 | 0.00 | 3.71 | 32.49 | 0.8332 | 0.1354 | |||
| MRK / Merck & Co., Inc. | 0.05 | 0.00 | 3.69 | -11.80 | 0.8275 | -0.2137 | |||
| LIN / Linde plc | 0.01 | 0.00 | 3.66 | 0.77 | 0.8225 | -0.0833 | |||
| NFLX / Netflix, Inc. | 0.00 | 0.00 | 3.59 | 43.61 | 0.8050 | 0.1829 | |||
| NVDA / NVIDIA Corporation | 0.02 | 0.00 | 3.51 | 45.74 | 0.7870 | 0.1879 | |||
| RSK / Arch Capital Group Ltd. | 0.04 | 0.00 | 3.50 | -5.33 | 0.7858 | -0.1353 | |||
| CACI / CACI International Inc | 0.01 | 0.00 | 3.39 | 29.93 | 0.7611 | 0.1110 | |||
| BSX / Boston Scientific Corporation | 0.03 | 0.00 | 3.36 | 6.50 | 0.7542 | -0.0318 | |||
| NOW / ServiceNow, Inc. | 0.00 | 0.00 | 3.18 | 29.12 | 0.7149 | 0.1006 | |||
| CSA / Accenture plc | 0.01 | 0.00 | 3.18 | -4.22 | 0.7138 | -0.1131 | |||
| UNH / UnitedHealth Group Incorporated | 0.01 | 0.00 | 3.11 | -40.45 | 0.6992 | -0.6033 | |||
| DDOG / Datadog, Inc. | 0.02 | 2,545.39 | 2.97 | 3,518.29 | 0.6660 | 0.6454 | |||
| CHD / Church & Dwight Co., Inc. | 0.03 | 0.00 | 2.91 | -12.70 | 0.6543 | -0.1774 | |||
| NOC / Northrop Grumman Corporation | 0.01 | 0.00 | 2.82 | -2.36 | 0.6323 | -0.0862 | |||
| UTHR / United Therapeutics Corporation | 0.01 | 0.00 | 2.78 | -6.81 | 0.6242 | -0.1189 | |||
| TJX / The TJX Companies, Inc. | 0.02 | 0.00 | 2.76 | 1.40 | 0.6198 | -0.0586 | |||
| CAH / Cardinal Health, Inc. | 0.02 | 0.00 | 2.70 | 21.95 | 0.6062 | 0.0546 | |||
| XOM / Exxon Mobil Corporation | 0.02 | 0.00 | 2.60 | -9.37 | 0.5840 | -0.1310 | |||
| AAPL / Apple Inc. | 0.01 | -51.71 | 2.54 | -55.40 | 0.5694 | -0.8471 | |||
| CPRT / Copart, Inc. | 0.05 | 0.00 | 2.53 | -13.31 | 0.5688 | -0.1591 | |||
| MSI / Motorola Solutions, Inc. | 0.01 | 0.00 | 2.53 | -3.98 | 0.5683 | -0.0883 | |||
| FCN / FTI Consulting, Inc. | 0.02 | 0.00 | 2.52 | -1.56 | 0.5654 | -0.0720 | |||
| CRWD / CrowdStrike Holdings, Inc. | 0.00 | 0.00 | 2.52 | 44.43 | 0.5649 | 0.1309 | |||
| CVX / Chevron Corporation | 0.02 | 0.00 | 2.50 | -14.42 | 0.5608 | -0.1662 | |||
| TMUS / T-Mobile US, Inc. | 0.01 | 0.00 | 2.47 | -10.70 | 0.5547 | -0.1343 | |||
| TYL / Tyler Technologies, Inc. | 0.00 | 0.00 | 2.45 | 2.00 | 0.5491 | -0.0484 | |||
| ERE / Everest Group, Ltd. | 0.01 | 0.00 | 2.35 | -6.46 | 0.5267 | -0.0981 | |||
| GD / General Dynamics Corporation | 0.01 | 0.00 | 2.31 | 6.99 | 0.5192 | -0.0192 | |||
| CTAS / Cintas Corporation | 0.01 | 0.00 | 2.26 | 8.44 | 0.5078 | -0.0118 | |||
| COP / ConocoPhillips | 0.03 | 0.00 | 2.25 | -14.54 | 0.5042 | -0.1506 | |||
| RTX / RTX Corporation | 0.02 | 0.00 | 2.20 | 10.24 | 0.4933 | -0.0033 | |||
| MDLZ / Mondelez International, Inc. | 0.03 | 0.00 | 2.13 | -0.61 | 0.4776 | -0.0556 | |||
| TPL / Texas Pacific Land Corporation | 0.00 | 0.00 | 2.11 | -20.28 | 0.4731 | -0.1853 | |||
| GEY / Garmin Ltd. | 0.01 | 0.00 | 2.05 | -3.90 | 0.4595 | -0.0709 | |||
| DECK / Deckers Outdoor Corporation | 0.02 | 44.17 | 2.02 | 32.96 | 0.4528 | 0.0747 | |||
| FTNT / Fortinet, Inc. | 0.02 | 0.00 | 2.00 | 9.85 | 0.4482 | -0.0046 | |||
| DTM / DT Midstream, Inc. | 0.02 | 0.00 | 1.96 | 13.90 | 0.4396 | 0.0114 | |||
| DUK / Duke Energy Corporation | 0.02 | 0.00 | 1.94 | -3.24 | 0.4363 | -0.0641 | |||
| DDS / Dillard's, Inc. | 0.00 | 1,821.58 | 1.93 | 2,148.84 | 0.4343 | 0.4128 | |||
| HSY / The Hershey Company | 0.01 | 0.00 | 1.84 | -2.96 | 0.4124 | -0.0592 | |||
| WTM / White Mountains Insurance Group, Ltd. | 0.00 | 0.00 | 1.79 | -6.78 | 0.4011 | -0.0762 | |||
| MO / Altria Group, Inc. | 0.03 | 0.00 | 1.78 | -2.31 | 0.3991 | -0.0543 | |||
| 46628D395 / JNL Government Money Market Fund - Class SL | 1.72 | 8,016.95 | 1.72 | 8,104.76 | 0.3868 | 0.3816 | |||
| ELV / Elevance Health, Inc. | 0.00 | 0.00 | 1.71 | -10.57 | 0.3836 | -0.0924 | |||
| VRSK / Verisk Analytics, Inc. | 0.01 | 0.00 | 1.68 | 4.67 | 0.3772 | -0.0227 | |||
| CIVI / Civitas Resources, Inc. | 0.06 | 1.66 | 0.3722 | 0.3722 | |||||
| LLY / Eli Lilly and Company | 0.00 | -65.04 | 1.57 | -67.00 | 0.3529 | -0.8339 | |||
| GIS / General Mills, Inc. | 0.03 | 0.00 | 1.54 | -13.36 | 0.3451 | -0.0968 | |||
| INTU / Intuit Inc. | 0.00 | 0.00 | 1.50 | 28.30 | 0.3359 | 0.0453 | |||
| WSM / Williams-Sonoma, Inc. | 0.01 | 0.00 | 1.49 | 3.32 | 0.3352 | -0.0248 | |||
| NBIX / Neurocrine Biosciences, Inc. | 0.01 | 0.00 | 1.48 | 13.71 | 0.3314 | 0.0078 | |||
| ALL / The Allstate Corporation | 0.01 | 0.00 | 1.46 | -2.79 | 0.3287 | -0.0465 | |||
| FI / Fiserv, Inc. | 0.01 | 0.00 | 1.45 | -21.92 | 0.3262 | -0.1374 | |||
| HRL / Hormel Foods Corporation | 0.05 | 0.00 | 1.42 | -2.27 | 0.3195 | -0.0431 | |||
| LRCX / Lam Research Corporation | 0.01 | 1.41 | 0.3161 | 0.3161 | |||||
| GM / General Motors Company | 0.03 | 1.41 | 0.3156 | 0.3156 | |||||
| DHR / Danaher Corporation | 0.01 | -56.75 | 1.40 | -58.33 | 0.3152 | -0.5240 | |||
| REGN / Regeneron Pharmaceuticals, Inc. | 0.00 | 0.00 | 1.40 | -17.24 | 0.3149 | -0.1072 | |||
| ITW / Illinois Tool Works Inc. | 0.01 | 0.00 | 1.36 | -0.37 | 0.3052 | -0.0345 | |||
| AVGO / Broadcom Inc. | 0.00 | 195.01 | 1.35 | -49.36 | 0.3034 | -0.3490 | |||
| ICE / Intercontinental Exchange, Inc. | 0.01 | 0.00 | 1.31 | 6.40 | 0.2947 | -0.0128 | |||
| VRTX / Vertex Pharmaceuticals Incorporated | 0.00 | 0.00 | 1.18 | -8.23 | 0.2655 | -0.0553 | |||
| HIG / The Hartford Insurance Group, Inc. | 0.01 | 0.00 | 1.17 | 2.54 | 0.2627 | -0.0216 | |||
| HUM / Humana Inc. | 0.00 | -44.93 | 1.17 | -61.17 | 0.2618 | -0.4588 | |||
| APP / AppLovin Corporation | 0.00 | 923.34 | 1.14 | 1,267.47 | 0.2549 | 0.2340 | |||
| CI / The Cigna Group | 0.00 | 0.00 | 1.11 | 0.45 | 0.2495 | -0.0260 | |||
| CASY / Casey's General Stores, Inc. | 0.00 | 0.00 | 1.10 | 17.67 | 0.2467 | 0.0138 | |||
| DLB / Dolby Laboratories, Inc. | 0.01 | 0.00 | 1.10 | -7.58 | 0.2464 | -0.0493 | |||
| MDT / Medtronic plc | 0.01 | 0.00 | 1.09 | -2.94 | 0.2447 | -0.0352 | |||
| LDOS / Leidos Holdings, Inc. | 0.01 | 0.00 | 1.04 | 16.99 | 0.2335 | 0.0119 | |||
| PLTR / Palantir Technologies Inc. | 0.01 | 0.98 | 0.2202 | 0.2202 | |||||
| MSM / MSC Industrial Direct Co., Inc. | 0.01 | 0.98 | 0.2198 | 0.2198 | |||||
| CAT / Caterpillar Inc. | 0.00 | 0.00 | 0.98 | 17.73 | 0.2192 | 0.0126 | |||
| VEEV / Veeva Systems Inc. | 0.00 | 0.00 | 0.97 | 24.30 | 0.2183 | 0.0235 | |||
| PB / Prosperity Bancshares, Inc. | 0.01 | 7.87 | 0.94 | 38.82 | 0.2121 | 0.0330 | |||
| TMO / Thermo Fisher Scientific Inc. | 0.00 | 0.00 | 0.92 | -18.53 | 0.2063 | -0.0747 | |||
| WRB / W. R. Berkley Corporation | 0.01 | 0.00 | 0.90 | 3.32 | 0.2026 | -0.0151 | |||
| CMG / Chipotle Mexican Grill, Inc. | 0.02 | -58.86 | 0.87 | -54.02 | 0.1953 | -0.2757 | |||
| MEDP / Medpace Holdings, Inc. | 0.00 | 0.00 | 0.85 | 3.02 | 0.1919 | -0.0148 | |||
| FUTURE - CASH SETTLED / DE (N/A) | 0.85 | 0.1915 | 0.1915 | ||||||
| CHE / Chemed Corporation | 0.00 | 0.00 | 0.82 | -20.79 | 0.1838 | -0.0740 | |||
| AMZN / Amazon.com, Inc. | 0.00 | 0.78 | 0.1748 | 0.1748 | |||||
| CRM / Salesforce, Inc. | 0.00 | 20.27 | 0.77 | 54.44 | 0.1721 | 0.0486 | |||
| DV / DoubleVerify Holdings, Inc. | 0.05 | 0.76 | 0.1715 | 0.1715 | |||||
| PSN / Parsons Corporation | 0.01 | 0.75 | 0.1674 | 0.1674 | |||||
| DE / Deere & Company | 0.00 | 0.00 | 0.71 | 8.23 | 0.1596 | -0.0039 | |||
| BDX / Becton, Dickinson and Company | 0.00 | 0.00 | 0.69 | -24.81 | 0.1559 | -0.0742 | |||
| PKG / Packaging Corporation of America | 0.00 | 0.00 | 0.69 | -4.82 | 0.1552 | -0.0258 | |||
| FOXA / Fox Corporation | 0.01 | 0.00 | 0.68 | -1.01 | 0.1537 | -0.0186 | |||
| CTRA / Coterra Energy Inc. | 0.03 | 0.00 | 0.68 | -12.14 | 0.1527 | -0.0402 | |||
| PPC / Pilgrim's Pride Corporation | 0.01 | 0.00 | 0.67 | -17.49 | 0.1504 | -0.0519 | |||
| KHC / The Kraft Heinz Company | 0.02 | 0.00 | 0.61 | -15.16 | 0.1371 | -0.0422 | |||
| SYK / Stryker Corporation | 0.00 | 0.00 | 0.61 | 6.29 | 0.1367 | -0.0060 | |||
| EW / Edwards Lifesciences Corporation | 0.01 | 0.00 | 0.60 | 7.79 | 0.1337 | -0.0038 | |||
| UI / Ubiquiti Inc. | 0.00 | 0.00 | 0.58 | 32.80 | 0.1310 | 0.0215 | |||
| C / Citigroup Inc. | 0.01 | -4.89 | 0.58 | 75.91 | 0.1296 | 0.0474 | |||
| DASH / DoorDash, Inc. | 0.00 | 0.00 | 0.55 | 34.81 | 0.1227 | 0.0217 | |||
| TDY / Teledyne Technologies Incorporated | 0.00 | 0.00 | 0.49 | 2.93 | 0.1105 | -0.0086 | |||
| LBTYA / Liberty Global Ltd. | 0.05 | 0.49 | 0.1100 | 0.1100 | |||||
| AAON / AAON, Inc. | 0.01 | 0.49 | 0.1099 | 0.1099 | |||||
| L / Loews Corporation | 0.01 | 0.00 | 0.49 | -0.21 | 0.1091 | -0.0123 | |||
| ROL / Rollins, Inc. | 0.01 | 0.00 | 0.47 | 4.44 | 0.1056 | -0.0066 | |||
| NYT / The New York Times Company | 0.01 | 0.00 | 0.46 | 12.90 | 0.1022 | 0.0017 | |||
| ZS / Zscaler, Inc. | 0.00 | 0.45 | 0.1012 | 0.1012 | |||||
| SEB / Seaboard Corporation | 0.00 | 46.08 | 0.43 | 54.91 | 0.0957 | 0.0272 | |||
| LSCC / Lattice Semiconductor Corporation | 0.01 | 0.42 | 0.0943 | 0.0943 | |||||
| MMC / Marsh & McLennan Companies, Inc. | 0.00 | 0.00 | 0.41 | -10.33 | 0.0917 | -0.0219 | |||
| JPM / JPMorgan Chase & Co. | 0.00 | 0.00 | 0.39 | 18.13 | 0.0879 | 0.0054 | |||
| ADBE / Adobe Inc. | 0.00 | 0.00 | 0.39 | 0.79 | 0.0866 | -0.0087 | |||
| NTNX / Nutanix, Inc. | 0.00 | 0.00 | 0.37 | 9.44 | 0.0834 | -0.0011 | |||
| PANW / Palo Alto Networks, Inc. | 0.00 | 0.00 | 0.35 | 19.93 | 0.0785 | 0.0059 | |||
| VKTX / Viking Therapeutics, Inc. | 0.01 | 0.00 | 0.34 | 9.74 | 0.0760 | -0.0009 | |||
| CINF / Cincinnati Financial Corporation | 0.00 | 0.00 | 0.31 | 0.65 | 0.0693 | -0.0070 | |||
| HOLX / Hologic, Inc. | 0.00 | 0.00 | 0.19 | 5.06 | 0.0422 | -0.0022 | |||
| KMB / Kimberly-Clark Corporation | 0.00 | 0.00 | 0.18 | -9.50 | 0.0407 | -0.0091 | |||
| WAB / Westinghouse Air Brake Technologies Corporation | 0.00 | 0.00 | 0.16 | 15.33 | 0.0355 | 0.0014 | |||
| COKE / Coca-Cola Consolidated, Inc. | 0.00 | 900.00 | 0.16 | -17.46 | 0.0351 | -0.0120 | |||
| CMI / Cummins Inc. | 0.00 | 31.51 | 0.13 | 37.11 | 0.0301 | 0.0058 | |||
| ABNB / Airbnb, Inc. | 0.00 | 0.13 | 0.0293 | 0.0293 | |||||
| KBR / KBR, Inc. | 0.00 | 0.12 | 0.0278 | 0.0278 | |||||
| M / Macy's, Inc. | 0.01 | 0.12 | 0.0276 | 0.0276 | |||||
| CNC / Centene Corporation | 0.00 | 3.36 | 0.10 | -8.18 | 0.0229 | -0.0046 |