Statistik Asas
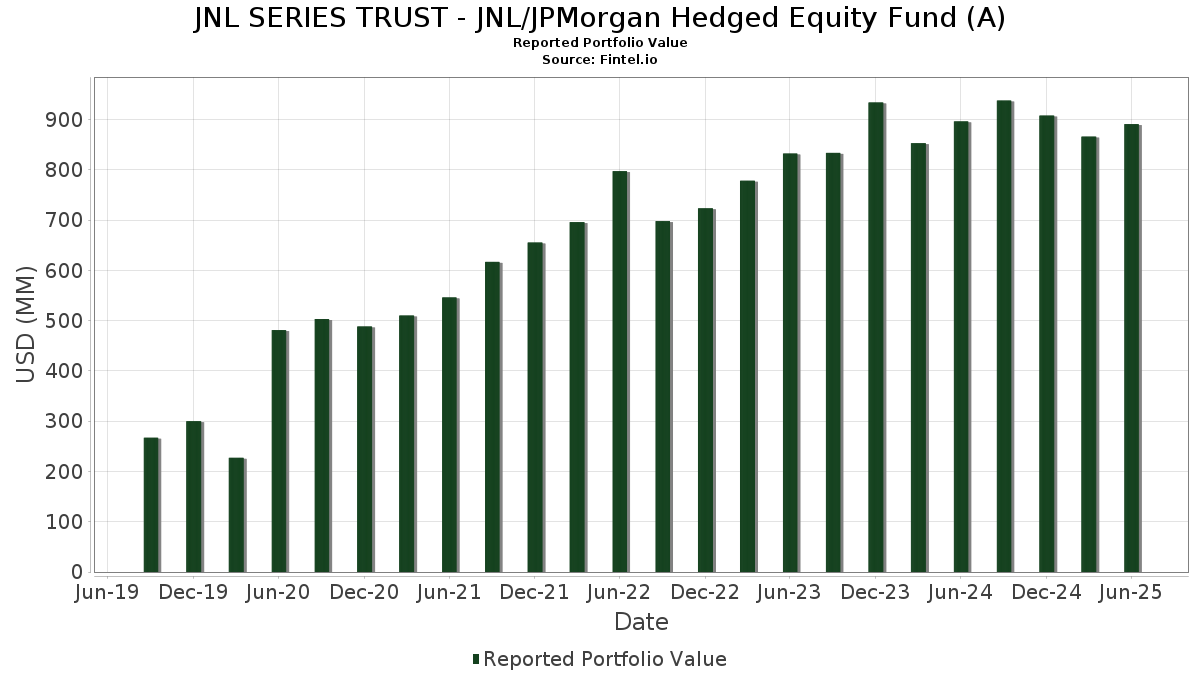
| Nilai Portfolio | $ 890,776,101 |
| Kedudukan Semasa | 152 |
Pegangan Terkini, Prestasi, AUM (dari 13F, 13D)
JNL SERIES TRUST - JNL/JPMorgan Hedged Equity Fund (A) telah mendedahkan 152 jumlah pegangan dalam pemfailan SEC terkini mereka. Nilai portfolio terkini dikira sebagai $ 890,776,101 USD. Aset Sebenar Di Bawah Pengurusan (AUM) ialah nilai ini ditambah dengan tunai (yang tidak didedahkan). Pegangan teratas JNL SERIES TRUST - JNL/JPMorgan Hedged Equity Fund (A) ialah Microsoft Corporation (US:MSFT) , NVIDIA Corporation (US:NVDA) , Apple Inc. (US:AAPL) , JNL Government Money Market Fund (US:46628D437) , and Amazon.com, Inc. (US:AMZN) . Kedudukan baharu JNL SERIES TRUST - JNL/JPMorgan Hedged Equity Fund (A) termasuk Apollo Global Management, Inc. (US:APO) , GE Vernova Inc. (US:GEV) , Vulcan Materials Company (US:VMC) , CrowdStrike Holdings, Inc. (US:CRWD) , and .
Kenaikan Teratas Suku Tahun Ini
Kami menggunakan perubahan dalam peruntukan portfolio kerana ini adalah metrik yang paling bermakna. Perubahan boleh disebabkan oleh perdagangan atau perubahan dalam harga saham.
| Sekuriti | Saham (MM) |
Nilai (MM$) |
Portfolio % | ΔPortfolio % |
|---|---|---|---|---|
| 40.65 | 40.65 | 4.5547 | 2.7742 | |
| 0.44 | 69.92 | 7.8352 | 1.8933 | |
| 0.14 | 71.75 | 8.0399 | 1.4104 | |
| 0.08 | 21.84 | 2.4468 | 0.9195 | |
| 0.08 | 8.06 | 0.9029 | 0.6306 | |
| 0.04 | 32.59 | 3.6515 | 0.5673 | |
| 0.05 | 9.96 | 1.1163 | 0.4577 | |
| 0.07 | 7.03 | 0.7873 | 0.3939 | |
| 0.02 | 4.20 | 0.4705 | 0.3865 | |
| 0.08 | 7.52 | 0.8432 | 0.3584 |
Penurunan Teratas Suku Tahun Ini
Kami menggunakan perubahan dalam peruntukan portfolio kerana ini adalah metrik yang paling bermakna. Perubahan boleh disebabkan oleh perdagangan atau perubahan dalam harga saham.
| Sekuriti | Saham (MM) |
Nilai (MM$) |
Portfolio % | ΔPortfolio % |
|---|---|---|---|---|
| -44.57 | -4.9947 | -4.9947 | ||
| 0.25 | 51.24 | 5.7414 | -0.9903 | |
| 0.02 | 7.33 | 0.8212 | -0.6719 | |
| 0.00 | 1.43 | 0.1597 | -0.3596 | |
| 0.05 | 4.70 | 0.5266 | -0.3196 | |
| 0.00 | 1.88 | 0.2109 | -0.3082 | |
| 0.11 | 12.37 | 1.3866 | -0.3059 | |
| 0.03 | 13.41 | 1.5030 | -0.2815 | |
| 0.10 | 1.45 | 0.1621 | -0.2677 | |
| 0.02 | 1.40 | 0.1572 | -0.2590 |
13F dan Pemfailan Dana
Borang ini telah difailkan pada 2025-08-27 untuk tempoh pelaporan 2025-06-30. Klik ikon pautan untuk melihat sejarah transaksi penuh.
Tingkatkan untuk membuka data premium dan eksport ke Excel ![]() .
.
| Sekuriti | Jenis | Purata Harga Saham | Saham (MM) |
ΔSaham (%) |
ΔSaham (%) |
Nilai ($MM) |
Portfolio (%) |
ΔPortfolio (%) |
|
|---|---|---|---|---|---|---|---|---|---|
| MSFT / Microsoft Corporation | 0.14 | -5.80 | 71.75 | 24.82 | 8.0399 | 1.4104 | |||
| NVDA / NVIDIA Corporation | 0.44 | -6.90 | 69.92 | 35.72 | 7.8352 | 1.8933 | |||
| AAPL / Apple Inc. | 0.25 | -4.96 | 51.24 | -12.21 | 5.7414 | -0.9903 | |||
| 46628D437 / JNL Government Money Market Fund | 40.65 | 163.30 | 40.65 | 163.30 | 4.5547 | 2.7742 | |||
| AMZN / Amazon.com, Inc. | 0.18 | -4.96 | 39.41 | 9.60 | 4.4157 | 0.2687 | |||
| META / Meta Platforms, Inc. | 0.04 | -4.84 | 32.59 | 21.86 | 3.6515 | 0.5673 | |||
| AVGO / Broadcom Inc. | 0.08 | 0.16 | 21.84 | 64.90 | 2.4468 | 0.9195 | |||
| GOOGL / Alphabet Inc. | 0.10 | -6.34 | 17.70 | 6.74 | 1.9833 | 0.0708 | |||
| MA / Mastercard Incorporated | 0.03 | -7.25 | 15.21 | -4.91 | 1.7046 | -0.1405 | |||
| TSLA / Tesla, Inc. | 0.05 | -4.96 | 14.31 | 16.50 | 1.6037 | 0.1868 | |||
| V / Visa Inc. | 0.04 | -9.58 | 14.09 | -8.39 | 1.5787 | -0.1952 | |||
| BRK.B / Berkshire Hathaway Inc. | 0.03 | -4.96 | 13.41 | -13.31 | 1.5030 | -0.2815 | |||
| XOM / Exxon Mobil Corporation | 0.11 | -6.97 | 12.37 | -15.68 | 1.3866 | -0.3059 | |||
| BAC / Bank of America Corporation | 0.24 | 4.17 | 11.30 | 18.13 | 1.2663 | 0.1629 | |||
| ABBV / AbbVie Inc. | 0.05 | 2.18 | 10.04 | -9.48 | 1.1246 | -0.1541 | |||
| ORCL / Oracle Corporation | 0.05 | 11.56 | 9.96 | 74.45 | 1.1163 | 0.4577 | |||
| WFC / Wells Fargo & Company | 0.12 | 1.75 | 9.79 | 13.55 | 1.0967 | 0.1027 | |||
| GOOG / Alphabet Inc. | 0.05 | -9.72 | 9.62 | 2.50 | 1.0777 | -0.0044 | |||
| LLY / Eli Lilly and Company | 0.01 | -5.83 | 9.10 | -11.12 | 1.0192 | -0.1610 | |||
| HWM / Howmet Aerospace Inc. | 0.05 | -8.11 | 8.42 | 31.83 | 0.9440 | 0.2070 | |||
| WMT / Walmart Inc. | 0.08 | 206.44 | 8.06 | 241.40 | 0.9029 | 0.6306 | |||
| JNJ / Johnson & Johnson | 0.05 | 4.91 | 7.94 | -3.38 | 0.8898 | -0.0580 | |||
| LOW / Lowe's Companies, Inc. | 0.04 | -0.60 | 7.88 | -5.45 | 0.8832 | -0.0782 | |||
| MCD / McDonald's Corporation | 0.03 | -6.36 | 7.85 | -12.41 | 0.8793 | -0.1540 | |||
| SCHW / The Charles Schwab Corporation | 0.08 | 53.60 | 7.52 | 79.06 | 0.8432 | 0.3584 | |||
| SO / The Southern Company | 0.08 | -4.20 | 7.52 | -4.32 | 0.8429 | -0.0639 | |||
| PEP / PepsiCo, Inc. | 0.06 | 1.43 | 7.47 | -10.68 | 0.8375 | -0.1275 | |||
| CRM / Salesforce, Inc. | 0.03 | -4.96 | 7.45 | -3.42 | 0.8350 | -0.0549 | |||
| UNH / UnitedHealth Group Incorporated | 0.02 | -4.96 | 7.33 | -43.39 | 0.8212 | -0.6719 | |||
| LIN / Linde plc | 0.02 | -4.96 | 7.30 | -4.24 | 0.8184 | -0.0612 | |||
| 2IS / Trane Technologies plc | 0.02 | -26.80 | 7.17 | -4.97 | 0.8034 | -0.0668 | |||
| NOW / ServiceNow, Inc. | 0.01 | -3.73 | 7.09 | 24.33 | 0.7949 | 0.1368 | |||
| LRCX / Lam Research Corporation | 0.07 | 53.83 | 7.03 | 105.95 | 0.7873 | 0.3939 | |||
| TXN / Texas Instruments Incorporated | 0.03 | -6.25 | 6.99 | 8.31 | 0.7829 | 0.0389 | |||
| ADI / Analog Devices, Inc. | 0.03 | -6.42 | 6.92 | 10.44 | 0.7754 | 0.0528 | |||
| PGR / The Progressive Corporation | 0.03 | -3.85 | 6.84 | -9.35 | 0.7660 | -0.1037 | |||
| NEE / NextEra Energy, Inc. | 0.10 | -5.96 | 6.67 | -7.91 | 0.7474 | -0.0880 | |||
| SYK / Stryker Corporation | 0.02 | -6.20 | 6.62 | -0.30 | 0.7423 | -0.0241 | |||
| TMO / Thermo Fisher Scientific Inc. | 0.02 | -3.81 | 6.28 | -21.62 | 0.7035 | -0.2204 | |||
| MDLZ / Mondelez International, Inc. | 0.09 | -5.87 | 5.78 | -6.46 | 0.6480 | -0.0649 | |||
| NFLX / Netflix, Inc. | 0.00 | 48.11 | 5.73 | 112.70 | 0.6417 | 0.3311 | |||
| DIS / The Walt Disney Company | 0.05 | 14.33 | 5.64 | 43.64 | 0.6319 | 0.1791 | |||
| VNX / NXP Semiconductors N.V. | 0.03 | -10.86 | 5.61 | 2.48 | 0.6286 | -0.0028 | |||
| BSX / Boston Scientific Corporation | 0.05 | -1.76 | 5.61 | 4.59 | 0.6282 | 0.0100 | |||
| EOG / EOG Resources, Inc. | 0.05 | 47.18 | 5.57 | 37.28 | 0.6243 | 0.1562 | |||
| STX / Seagate Technology Holdings plc | 0.04 | -4.96 | 5.53 | 61.48 | 0.6197 | 0.2247 | |||
| DE / Deere & Company | 0.01 | -5.01 | 5.48 | 2.89 | 0.6136 | -0.0001 | |||
| RTX / RTX Corporation | 0.04 | 22.54 | 5.43 | 35.10 | 0.6086 | 0.1449 | |||
| TDG / TransDigm Group Incorporated | 0.00 | -8.44 | 5.23 | 0.65 | 0.5863 | -0.0132 | |||
| AJG / Arthur J. Gallagher & Co. | 0.02 | 0.97 | 5.21 | -6.38 | 0.5841 | -0.0581 | |||
| CARR / Carrier Global Corporation | 0.07 | 25.84 | 5.20 | 45.26 | 0.5827 | 0.1698 | |||
| HLT / Hilton Worldwide Holdings Inc. | 0.02 | 13.58 | 5.02 | 32.94 | 0.5626 | 0.1270 | |||
| MDT / Medtronic plc | 0.06 | 4.27 | 4.83 | 1.13 | 0.5418 | -0.0095 | |||
| CMCSA / Comcast Corporation | 0.13 | -4.96 | 4.81 | -8.08 | 0.5393 | -0.0645 | |||
| KO / The Coca-Cola Company | 0.07 | -19.57 | 4.76 | -20.54 | 0.5331 | -0.1575 | |||
| CMG / Chipotle Mexican Grill, Inc. | 0.08 | -1.90 | 4.73 | 9.69 | 0.5301 | 0.0327 | |||
| COP / ConocoPhillips | 0.05 | -25.04 | 4.70 | -35.95 | 0.5266 | -0.3196 | |||
| KDP / Keurig Dr Pepper Inc. | 0.14 | 48.66 | 4.68 | 43.62 | 0.5243 | 0.1486 | |||
| BMY / Bristol-Myers Squibb Company | 0.10 | -4.80 | 4.64 | -27.74 | 0.5200 | -0.2207 | |||
| CME / CME Group Inc. | 0.02 | -6.08 | 4.49 | -2.41 | 0.5027 | -0.0275 | |||
| FIS / Fidelity National Information Services, Inc. | 0.05 | 5.99 | 4.47 | 15.53 | 0.5011 | 0.0547 | |||
| YUM / Yum! Brands, Inc. | 0.03 | -5.00 | 4.44 | -10.55 | 0.4971 | -0.0748 | |||
| C / Citigroup Inc. | 0.05 | 8.09 | 4.20 | 29.57 | 0.4710 | 0.0969 | |||
| VST / Vistra Corp. | 0.02 | 249.48 | 4.20 | 476.65 | 0.4705 | 0.3865 | |||
| OTIS / Otis Worldwide Corporation | 0.04 | -6.12 | 4.19 | -9.93 | 0.4698 | -0.0670 | |||
| ROST / Ross Stores, Inc. | 0.03 | -4.21 | 4.16 | -4.37 | 0.4662 | -0.0356 | |||
| PM / Philip Morris International Inc. | 0.02 | 1.80 | 4.15 | 16.81 | 0.4650 | 0.0552 | |||
| CI / The Cigna Group | 0.01 | 23.32 | 4.15 | 23.89 | 0.4649 | 0.0787 | |||
| CTSH / Cognizant Technology Solutions Corporation | 0.05 | -4.96 | 4.11 | -3.07 | 0.4605 | -0.0284 | |||
| T / AT&T Inc. | 0.14 | -4.94 | 4.10 | -2.73 | 0.4594 | -0.0267 | |||
| AMP / Ameriprise Financial, Inc. | 0.01 | 10.59 | 4.05 | 21.93 | 0.4542 | 0.0708 | |||
| MU / Micron Technology, Inc. | 0.03 | -13.13 | 4.02 | 23.23 | 0.4507 | 0.0742 | |||
| CPAY / Corpay, Inc. | 0.01 | 1.54 | 4.01 | -3.40 | 0.4495 | -0.0294 | |||
| VTR / Ventas, Inc. | 0.06 | -3.73 | 3.93 | -11.58 | 0.4406 | -0.0723 | |||
| MMM / 3M Company | 0.03 | 17.76 | 3.89 | 22.07 | 0.4357 | 0.0683 | |||
| 3EC / Eaton Corporation plc | 0.01 | -4.96 | 3.84 | 24.80 | 0.4304 | 0.0755 | |||
| 4VK / Aon plc | 0.01 | 2.21 | 3.83 | -8.63 | 0.4295 | -0.0543 | |||
| UBER / Uber Technologies, Inc. | 0.04 | -41.68 | 3.61 | -25.33 | 0.4044 | -0.1530 | |||
| FITB / Fifth Third Bancorp | 0.09 | -4.40 | 3.58 | 0.31 | 0.4016 | -0.0105 | |||
| VRTX / Vertex Pharmaceuticals Incorporated | 0.01 | -10.20 | 3.53 | -17.56 | 0.3951 | -0.0981 | |||
| INTU / Intuit Inc. | 0.00 | -9.47 | 3.48 | 16.14 | 0.3896 | 0.0443 | |||
| AXP / American Express Company | 0.01 | -23.56 | 3.30 | -9.38 | 0.3702 | -0.0502 | |||
| LDOS / Leidos Holdings, Inc. | 0.02 | -4.95 | 3.28 | 11.13 | 0.3670 | 0.0271 | |||
| BKNG / Booking Holdings Inc. | 0.00 | -20.75 | 3.18 | -0.41 | 0.3568 | -0.0120 | |||
| PLTR / Palantir Technologies Inc. | 0.02 | 9.51 | 3.16 | 76.92 | 0.3540 | 0.1480 | |||
| CAT / Caterpillar Inc. | 0.01 | -18.14 | 3.11 | -3.66 | 0.3484 | -0.0237 | |||
| UPS / United Parcel Service, Inc. | 0.03 | -16.62 | 3.07 | -23.48 | 0.3440 | -0.1187 | |||
| EQIX / Equinix, Inc. | 0.00 | 250.75 | 2.99 | 242.32 | 0.3345 | 0.2339 | |||
| CHTR / Charter Communications, Inc. | 0.01 | -4.94 | 2.98 | 5.45 | 0.3340 | 0.0080 | |||
| REGN / Regeneron Pharmaceuticals, Inc. | 0.01 | -4.96 | 2.91 | -21.35 | 0.3259 | -0.1005 | |||
| USB / U.S. Bancorp | 0.06 | 4.98 | 2.83 | 12.50 | 0.3167 | 0.0270 | |||
| SBAC / SBA Communications Corporation | 0.01 | -4.96 | 2.82 | 1.44 | 0.3165 | -0.0046 | |||
| COF / Capital One Financial Corporation | 0.01 | 93.49 | 2.82 | 129.61 | 0.3155 | 0.1741 | |||
| EW / Edwards Lifesciences Corporation | 0.04 | 13.41 | 2.81 | 22.39 | 0.3149 | 0.0500 | |||
| CCL / Carnival Corporation & plc | 0.10 | 76.03 | 2.80 | 153.62 | 0.3138 | 0.1864 | |||
| WELL / Welltower Inc. | 0.02 | -1.90 | 2.71 | -1.56 | 0.3039 | -0.0139 | |||
| PLD / Prologis, Inc. | 0.02 | -17.46 | 2.47 | -22.39 | 0.2770 | -0.0903 | |||
| EXPE / Expedia Group, Inc. | 0.01 | -5.30 | 2.46 | -4.95 | 0.2753 | -0.0229 | |||
| BURL / Burlington Stores, Inc. | 0.01 | 18.31 | 2.41 | 15.50 | 0.2698 | 0.0293 | |||
| CDNS / Cadence Design Systems, Inc. | 0.01 | 90.65 | 2.40 | 131.12 | 0.2689 | 0.1491 | |||
| APO / Apollo Global Management, Inc. | 0.02 | 2.38 | 0.2669 | 0.2669 | |||||
| FDX / FedEx Corporation | 0.01 | 16.71 | 2.25 | 8.85 | 0.2521 | 0.0137 | |||
| PCAR / PACCAR Inc | 0.02 | 14.03 | 2.20 | 11.32 | 0.2469 | 0.0186 | |||
| PPG / PPG Industries, Inc. | 0.02 | -4.96 | 2.17 | -1.14 | 0.2437 | -0.0100 | |||
| ANET / Arista Networks Inc | 0.02 | -4.96 | 2.10 | 25.52 | 0.2354 | 0.0423 | |||
| BKR / Baker Hughes Company | 0.05 | -4.40 | 2.06 | -16.59 | 0.2304 | -0.0540 | |||
| FANG / Diamondback Energy, Inc. | 0.01 | -4.96 | 1.99 | -18.32 | 0.2228 | -0.0580 | |||
| DASH / DoorDash, Inc. | 0.01 | 6.33 | 1.94 | 43.48 | 0.2171 | 0.0613 | |||
| TXT / Textron Inc. | 0.02 | -4.96 | 1.91 | 5.59 | 0.2138 | 0.0055 | |||
| STT / State Street Corporation | 0.02 | -57.31 | 1.90 | -38.66 | 0.2131 | -0.1328 | |||
| MAS / Masco Corporation | 0.03 | -4.96 | 1.89 | -12.03 | 0.2123 | -0.0361 | |||
| COST / Costco Wholesale Corporation | 0.00 | -60.05 | 1.88 | -58.20 | 0.2109 | -0.3082 | |||
| MO / Altria Group, Inc. | 0.03 | -4.95 | 1.69 | -7.14 | 0.1896 | -0.0206 | |||
| MCK / McKesson Corporation | 0.00 | -4.96 | 1.66 | 3.50 | 0.1856 | 0.0010 | |||
| TFC / Truist Financial Corporation | 0.04 | -54.02 | 1.58 | -51.98 | 0.1767 | -0.2019 | |||
| IR / Ingersoll Rand Inc. | 0.02 | -4.96 | 1.57 | -1.20 | 0.1760 | -0.0074 | |||
| HUM / Humana Inc. | 0.01 | 21.55 | 1.56 | 12.29 | 0.1751 | 0.0146 | |||
| FCX / Freeport-McMoRan Inc. | 0.04 | 10.94 | 1.53 | 28.98 | 0.1716 | 0.0294 | |||
| DAL / Delta Air Lines, Inc. | 0.03 | -4.96 | 1.48 | 7.23 | 0.1662 | 0.0066 | |||
| MRK / Merck & Co., Inc. | 0.02 | 46.02 | 1.47 | 28.86 | 0.1646 | 0.0330 | |||
| MLM / Martin Marietta Materials, Inc. | 0.00 | -4.96 | 1.46 | 9.11 | 0.1638 | 0.0093 | |||
| PCG / PG&E Corporation | 0.10 | -52.16 | 1.45 | -61.19 | 0.1621 | -0.2677 | |||
| TOST / Toast, Inc. | 0.03 | 1.39 | 1.43 | 35.38 | 0.1604 | 0.0384 | |||
| AZO / AutoZone, Inc. | 0.00 | -67.49 | 1.43 | -68.35 | 0.1597 | -0.3596 | |||
| KVUE / Kenvue Inc. | 0.07 | -13.92 | 1.41 | -24.89 | 0.1580 | -0.0584 | |||
| NKE / NIKE, Inc. | 0.02 | -45.67 | 1.40 | -59.65 | 0.1572 | -0.2590 | |||
| SHW / The Sherwin-Williams Company | 0.00 | 50.67 | 1.38 | 48.18 | 0.1548 | 0.0473 | |||
| LYB / LyondellBasell Industries N.V. | 0.02 | -4.96 | 1.35 | -21.91 | 0.1515 | -0.0481 | |||
| ELS / Equity LifeStyle Properties, Inc. | 0.02 | 15.93 | 1.34 | 7.22 | 0.1498 | 0.0060 | |||
| GEV / GE Vernova Inc. | 0.00 | 1.33 | 0.1490 | 0.1490 | |||||
| VMC / Vulcan Materials Company | 0.01 | 1.32 | 0.1482 | 0.1482 | |||||
| RJF / Raymond James Financial, Inc. | 0.01 | -56.00 | 1.27 | -32.80 | 0.1424 | -0.0840 | |||
| URI / United Rentals, Inc. | 0.00 | -4.97 | 1.24 | 14.21 | 0.1388 | 0.0137 | |||
| EMR / Emerson Electric Co. | 0.01 | 1.23 | 0.1382 | 0.1382 | |||||
| MSI / Motorola Solutions, Inc. | 0.00 | -6.71 | 1.20 | -10.40 | 0.1343 | -0.0200 | |||
| CHD / Church & Dwight Co., Inc. | 0.01 | -46.51 | 1.19 | -53.30 | 0.1332 | -0.1603 | |||
| HCA / HCA Healthcare, Inc. | 0.00 | -4.96 | 1.06 | 5.35 | 0.1193 | 0.0028 | |||
| LEN / Lennar Corporation | 0.01 | -4.95 | 0.94 | -8.50 | 0.1051 | -0.0130 | |||
| NUE / Nucor Corporation | 0.01 | -4.97 | 0.81 | 2.27 | 0.0910 | -0.0006 | |||
| APTV / Aptiv PLC | 0.01 | -4.96 | 0.75 | 8.97 | 0.0845 | 0.0047 | |||
| WMG / Warner Music Group Corp. | 0.03 | -6.13 | 0.73 | -18.46 | 0.0817 | -0.0214 | |||
| NBIX / Neurocrine Biosciences, Inc. | 0.01 | -4.96 | 0.66 | 7.99 | 0.0742 | 0.0035 | |||
| ETR / Entergy Corporation | 0.01 | -4.96 | 0.61 | -7.60 | 0.0681 | -0.0078 | |||
| NRG / NRG Energy, Inc. | 0.00 | -4.97 | 0.59 | 60.00 | 0.0664 | 0.0236 | |||
| FUTURE - CASH SETTLED / DE (N/A) | 0.50 | 0.0558 | 0.0558 | ||||||
| BAX / Baxter International Inc. | 0.02 | -4.95 | 0.46 | -15.85 | 0.0518 | -0.0116 | |||
| CRWD / CrowdStrike Holdings, Inc. | 0.00 | 0.46 | 0.0515 | 0.0515 | |||||
| WDC / Western Digital Corporation | 0.01 | -4.95 | 0.39 | 50.57 | 0.0441 | 0.0139 | |||
| WEX / WEX Inc. | 0.00 | -7.16 | 0.35 | -13.22 | 0.0391 | -0.0072 | |||
| ZBH / Zimmer Biomet Holdings, Inc. | 0.00 | 0.31 | 0.0349 | 0.0349 | |||||
| ARE / Alexandria Real Estate Equities, Inc. | 0.00 | -4.97 | 0.31 | -25.48 | 0.0348 | -0.0132 | |||
| C1BO34 / Cboe Global Markets, Inc. - Depositary Receipt (Common Stock) | 0.00 | -0.0000 | -0.0000 | ||||||
| C1BO34 / Cboe Global Markets, Inc. - Depositary Receipt (Common Stock) | 0.00 | 0.0000 | 0.0000 | ||||||
| MRVL / Marvell Technology, Inc. | 0.00 | -100.00 | 0.00 | -100.00 | -0.0437 | ||||
| C1BO34 / Cboe Global Markets, Inc. - Depositary Receipt (Common Stock) | -44.57 | -4.9947 | -4.9947 |