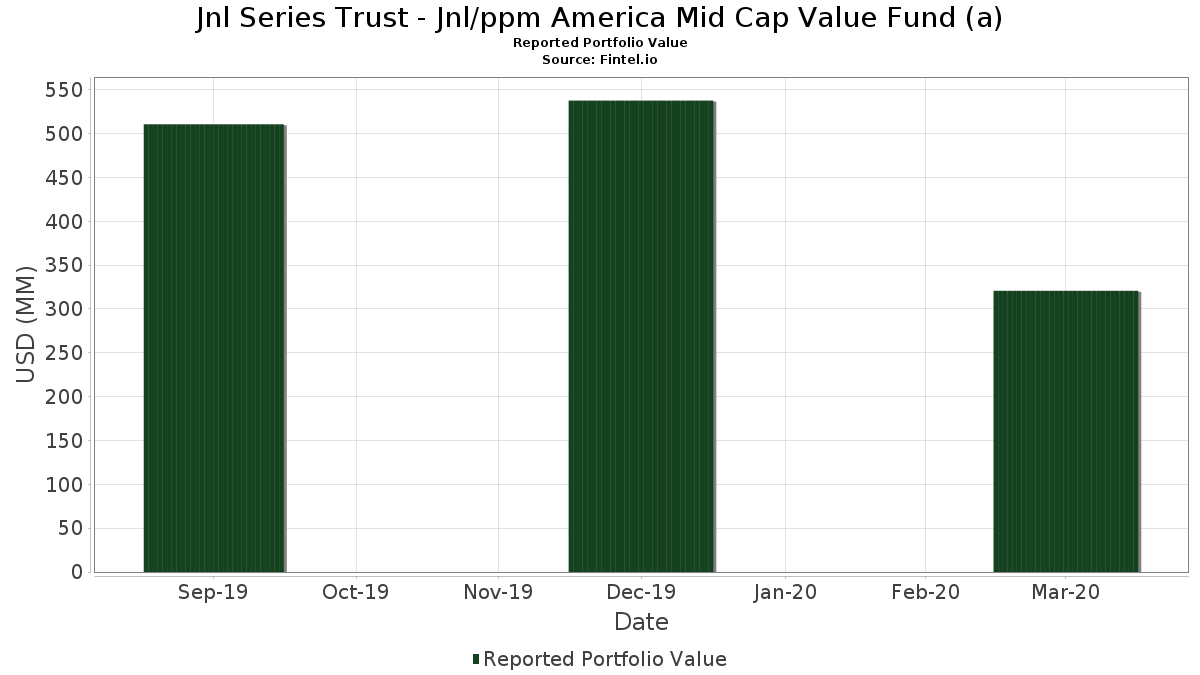
Statistik Asas
| Nilai Portfolio | $ 320,693,920 |
| Kedudukan Semasa | 57 |
Pegangan Terkini, Prestasi, AUM (dari 13F, 13D)
Jnl Series Trust - Jnl/ppm America Mid Cap Value Fund (a) telah mendedahkan 57 jumlah pegangan dalam pemfailan SEC terkini mereka. Nilai portfolio terkini dikira sebagai $ 320,693,920 USD. Aset Sebenar Di Bawah Pengurusan (AUM) ialah nilai ini ditambah dengan tunai (yang tidak didedahkan). Pegangan teratas Jnl Series Trust - Jnl/ppm America Mid Cap Value Fund (a) ialah The Allstate Corporation (US:ALL) , Ingredion Incorporated (US:INGR) , PNM Resources, Inc. (US:PNM) , McKesson Corporation (US:MCK) , and The AES Corporation (US:AES) . Kedudukan baharu Jnl Series Trust - Jnl/ppm America Mid Cap Value Fund (a) termasuk Exelon Corporation (US:EXC) , Sempra (US:SRE) , Cognizant Technology Solutions Corporation (US:CTSH) , JNL Securities Lending Collateral Fund (US:46628D411) , and .
Kenaikan Teratas Suku Tahun Ini
Kami menggunakan perubahan dalam peruntukan portfolio kerana ini adalah metrik yang paling bermakna. Perubahan boleh disebabkan oleh perdagangan atau perubahan dalam harga saham.
| Sekuriti | Saham (MM) |
Nilai (MM$) |
Portfolio % | ΔPortfolio % |
|---|---|---|---|---|
| 0.18 | 6.53 | 2.0432 | 2.0432 | |
| 0.04 | 3.95 | 1.2367 | 1.2367 | |
| 0.08 | 3.72 | 1.1625 | 1.1625 | |
| 0.26 | 7.83 | 2.4489 | 0.8843 | |
| 0.04 | 7.71 | 2.4102 | 0.5835 | |
| 3.74 | 3.74 | 1.1682 | 0.5693 | |
| 0.23 | 8.93 | 2.7925 | 0.5181 | |
| 0.34 | 5.71 | 1.7841 | 0.5165 | |
| 0.07 | 8.79 | 2.7493 | 0.4841 | |
| 0.06 | 8.35 | 2.6123 | 0.4835 |
Penurunan Teratas Suku Tahun Ini
Kami menggunakan perubahan dalam peruntukan portfolio kerana ini adalah metrik yang paling bermakna. Perubahan boleh disebabkan oleh perdagangan atau perubahan dalam harga saham.
| Sekuriti | Saham (MM) |
Nilai (MM$) |
Portfolio % | ΔPortfolio % |
|---|---|---|---|---|
| 0.41 | 2.90 | 0.9081 | -1.4990 | |
| 0.10 | 3.22 | 1.0060 | -1.4679 | |
| 0.30 | 4.17 | 1.3045 | -1.0333 | |
| 0.30 | 4.37 | 1.3653 | -1.0172 | |
| 0.00 | 0.00 | -0.9950 | ||
| 0.59 | 4.88 | 1.5273 | -0.9718 | |
| 0.00 | 0.00 | -0.9429 | ||
| 0.11 | 2.70 | 0.8434 | -0.6933 | |
| 0.35 | 6.11 | 1.9120 | -0.6413 | |
| 0.29 | 6.56 | 2.0507 | -0.4829 |
13F dan Pemfailan Dana
Borang ini telah difailkan pada 2020-05-28 untuk tempoh pelaporan 2020-03-31. Klik ikon pautan untuk melihat sejarah transaksi penuh.
Tingkatkan untuk membuka data premium dan eksport ke Excel ![]() .
.
| Sekuriti | Jenis | Purata Harga Saham | Saham (MM) |
ΔSaham (%) |
ΔSaham (%) |
Nilai ($MM) |
Portfolio (%) |
ΔPortfolio (%) |
|
|---|---|---|---|---|---|---|---|---|---|
| ALL / The Allstate Corporation | 0.10 | -14.17 | 9.45 | -29.98 | 2.9546 | 0.4433 | |||
| INGR / Ingredion Incorporated | 0.12 | -20.00 | 9.06 | -35.02 | 2.8332 | 0.2384 | |||
| PNM / PNM Resources, Inc. | 0.23 | -2.49 | 8.93 | -26.93 | 2.7925 | 0.5181 | |||
| MCK / McKesson Corporation | 0.07 | -26.14 | 8.79 | -27.78 | 2.7493 | 0.4841 | |||
| AES / The AES Corporation | 0.64 | -10.61 | 8.70 | -38.91 | 2.7218 | 0.0702 | |||
| HELE / Helen of Troy Limited | 0.06 | -15.94 | 8.35 | -23.21 | 2.6123 | 0.4835 | |||
| JHG / Janus Henderson Group plc | 0.54 | -10.42 | 8.20 | -38.90 | 2.5630 | -0.0617 | |||
| CPB / The Campbell's Company | 0.17 | -21.84 | 8.08 | -27.00 | 2.5261 | 0.4668 | |||
| AFG / American Financial Group, Inc. | 0.12 | -5.74 | 8.06 | -39.75 | 2.5202 | 0.0307 | |||
| KR / The Kroger Co. | 0.26 | -10.34 | 7.83 | -6.85 | 2.4489 | 0.8843 | |||
| RS / Reliance, Inc. | 0.09 | -11.02 | 7.71 | -34.93 | 2.4104 | 0.2061 | |||
| CI / The Cigna Group | 0.04 | -9.38 | 7.71 | -21.48 | 2.4102 | 0.5835 | |||
| VST / Vistra Corp. | 0.48 | -0.52 | 7.62 | -30.95 | 2.3831 | 0.3295 | |||
| HIG / The Hartford Insurance Group, Inc. | 0.21 | -1.40 | 7.47 | -42.82 | 2.3362 | -0.0953 | |||
| TXT / Textron Inc. | 0.26 | -2.73 | 7.03 | -41.83 | 2.1984 | -0.0509 | |||
| DOC / Healthpeak Properties, Inc. | 0.49 | -2.06 | 6.90 | -27.91 | 2.1578 | 0.3764 | |||
| RGA / Reinsurance Group of America, Incorporated | 0.08 | -0.55 | 6.86 | -48.68 | 2.1457 | -0.3427 | |||
| REG / Regency Centers Corporation | 0.17 | -7.89 | 6.73 | -43.90 | 2.1031 | -0.1278 | |||
| SMTC / Semtech Corporation | 0.18 | -7.33 | 6.64 | -34.31 | 2.0756 | 0.1953 | |||
| KMT / Kennametal Inc. | 0.36 | -0.52 | 6.61 | -49.79 | 2.0685 | -0.3831 | |||
| 872307903 / TCF Financial Corporation | 0.29 | -0.52 | 6.56 | -51.84 | 2.0507 | -0.4829 | |||
| EXC / Exelon Corporation | 0.18 | 6.53 | 2.0432 | 2.0432 | |||||
| LDOS / Leidos Holdings, Inc. | 0.07 | -18.39 | 6.51 | -23.59 | 2.0349 | 0.4499 | |||
| MGLN / Magellan Health Inc | 0.13 | -0.52 | 6.46 | -38.83 | 2.0205 | 0.0545 | |||
| NWL / Newell Brands Inc. | 0.47 | -0.52 | 6.27 | -31.26 | 1.9612 | 0.2632 | |||
| MTZ / MasTec, Inc. | 0.19 | 21.27 | 6.12 | -38.14 | 1.9140 | 0.0728 | |||
| SNV / Synovus Financial Corp. | 0.35 | -0.51 | 6.11 | -55.44 | 1.9120 | -0.6413 | |||
| HUN / Huntsman Corporation | 0.41 | 27.93 | 5.91 | -23.59 | 1.8478 | 0.4086 | |||
| DAL / Delta Air Lines, Inc. | 0.20 | 9.46 | 5.78 | -46.60 | 1.8066 | -0.2068 | |||
| NUAN / Nuance Communications Inc | 0.34 | -10.99 | 5.71 | -16.24 | 1.7841 | 0.5165 | |||
| BDC / Belden Inc. | 0.15 | -0.53 | 5.44 | -34.76 | 1.7014 | 0.1497 | |||
| STLD / Steel Dynamics, Inc. | 0.24 | -0.52 | 5.38 | -34.13 | 1.6828 | 0.1625 | |||
| BERY / Berry Global Group, Inc. | 0.15 | -9.88 | 5.23 | -36.03 | 1.6339 | 0.1138 | |||
| HOMB / Home Bancshares, Inc. (Conway, AR) | 0.43 | -0.52 | 5.13 | -39.34 | 1.6038 | 0.0305 | |||
| HBAN / Huntington Bancshares Incorporated | 0.59 | -33.19 | 4.88 | -63.63 | 1.5273 | -0.9718 | |||
| CACI / CACI International Inc | 0.02 | -21.43 | 4.65 | -33.63 | 1.4526 | 0.1500 | |||
| BBY / Best Buy Co., Inc. | 0.08 | -12.22 | 4.50 | -43.01 | 1.4081 | -0.0624 | |||
| PAG / Penske Automotive Group, Inc. | 0.16 | -2.18 | 4.40 | -45.46 | 1.3747 | -0.1254 | |||
| TEX / Terex Corporation | 0.30 | -29.27 | 4.37 | -65.90 | 1.3653 | -1.0172 | |||
| AVT / Avnet, Inc. | 0.17 | -0.29 | 4.25 | -41.03 | 1.3304 | -0.0123 | |||
| / ViacomCBS Inc | 0.30 | -0.52 | 4.17 | -66.80 | 1.3045 | -1.0333 | |||
| TER / Teradyne, Inc. | 0.07 | -11.76 | 4.06 | -29.92 | 1.2705 | 0.1918 | |||
| SRE / Sempra | 0.04 | 3.95 | 1.2367 | 1.2367 | |||||
| FL / Foot Locker, Inc. | 0.17 | -0.52 | 3.79 | -43.74 | 1.1846 | -0.0685 | |||
| RHI / Robert Half Inc. | 0.10 | 14.94 | 3.77 | -31.29 | 1.1805 | 0.1580 | |||
| 46628D437 / JNL Government Money Market Fund | 3.74 | 16.08 | 3.74 | 16.07 | 1.1682 | 0.5693 | |||
| CTSH / Cognizant Technology Solutions Corporation | 0.08 | 3.72 | 1.1625 | 1.1625 | |||||
| WDC / Western Digital Corporation | 0.09 | -4.30 | 3.70 | -37.24 | 1.1583 | 0.0598 | |||
| TDC / Teradata Corporation | 0.16 | 0.00 | 3.25 | -23.47 | 1.0156 | 0.2259 | |||
| RCL / Royal Caribbean Cruises Ltd. | 0.10 | -14.31 | 3.22 | -74.55 | 1.0060 | -1.4679 | |||
| PBF / PBF Energy Inc. | 0.41 | -0.52 | 2.90 | -77.55 | 0.9081 | -1.4990 | |||
| SPR / Spirit AeroSystems Holdings, Inc. | 0.11 | -0.53 | 2.70 | -67.35 | 0.8434 | -0.6933 | |||
| STL / Sterling Bancorp. | 0.25 | 0.00 | 2.62 | -50.44 | 0.8202 | -0.1645 | |||
| MD / Pediatrix Medical Group, Inc. | 0.22 | -0.52 | 2.55 | -58.33 | 0.7966 | -0.3412 | |||
| NOV / NOV Inc. | 0.25 | -0.52 | 2.44 | -60.97 | 0.7617 | -0.3995 | |||
| MDP / Meredith Holdings Corp | 0.15 | 0.00 | 1.78 | -62.38 | 0.5575 | -0.3241 | |||
| 46628D411 / JNL Securities Lending Collateral Fund | 1.42 | 1.42 | 0.4433 | 0.4433 | |||||
| NUE / Nucor Corporation | 0.00 | -100.00 | 0.00 | -100.00 | -0.9950 | ||||
| APA / APA Corporation | 0.00 | -100.00 | 0.00 | -100.00 | -0.9429 |