Statistik Asas
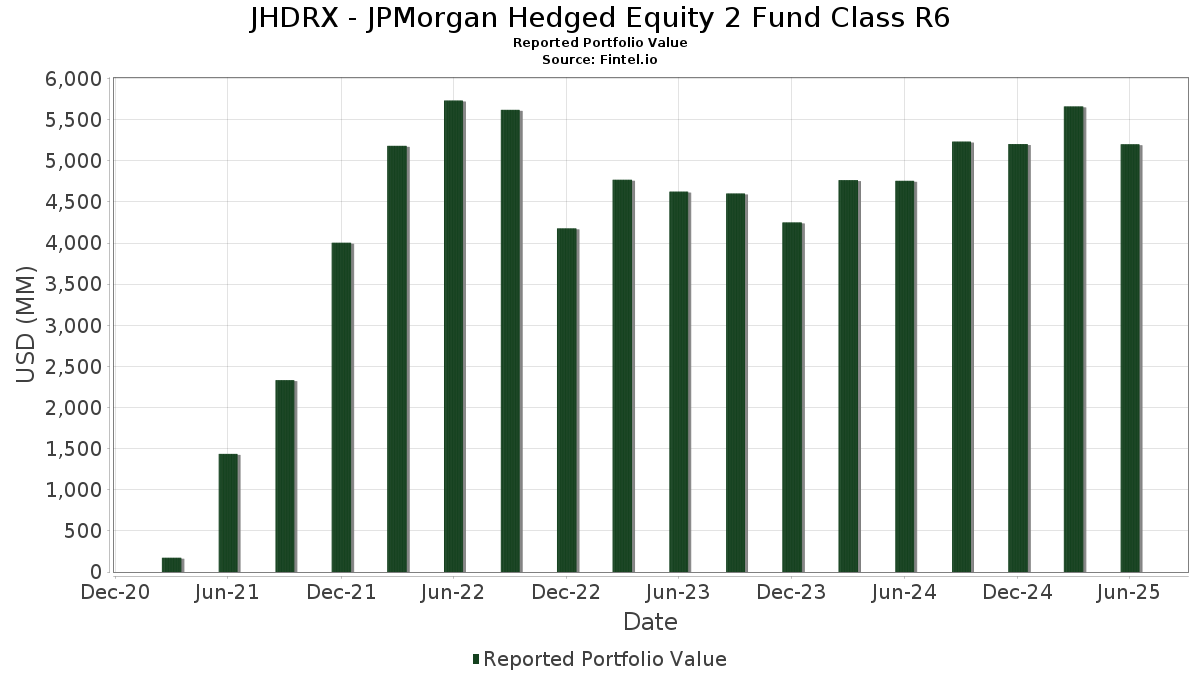
| Nilai Portfolio | $ 5,201,356,688 |
| Kedudukan Semasa | 154 |
Pegangan Terkini, Prestasi, AUM (dari 13F, 13D)
JHDRX - JPMorgan Hedged Equity 2 Fund Class R6 telah mendedahkan 154 jumlah pegangan dalam pemfailan SEC terkini mereka. Nilai portfolio terkini dikira sebagai $ 5,201,356,688 USD. Aset Sebenar Di Bawah Pengurusan (AUM) ialah nilai ini ditambah dengan tunai (yang tidak didedahkan). Pegangan teratas JHDRX - JPMorgan Hedged Equity 2 Fund Class R6 ialah Microsoft Corporation (US:MSFT) , NVIDIA Corporation (US:NVDA) , Apple Inc. (US:AAPL) , Amazon.com, Inc. (US:AMZN) , and Meta Platforms, Inc. (US:META) . Kedudukan baharu JHDRX - JPMorgan Hedged Equity 2 Fund Class R6 termasuk Apollo Global Management, Inc. (US:APO) , GE Vernova Inc. (US:GEV) , Vulcan Materials Company (US:VMC) , Emerson Electric Co. (US:EMR) , and CrowdStrike Holdings, Inc. (US:CRWD) .
Kenaikan Teratas Suku Tahun Ini
Kami menggunakan perubahan dalam peruntukan portfolio kerana ini adalah metrik yang paling bermakna. Perubahan boleh disebabkan oleh perdagangan atau perubahan dalam harga saham.
| Sekuriti | Saham (MM) |
Nilai (MM$) |
Portfolio % | ΔPortfolio % |
|---|---|---|---|---|
| 2.70 | 426.30 | 8.1923 | 2.4063 | |
| 0.88 | 437.85 | 8.4143 | 1.9587 | |
| 0.48 | 133.25 | 2.5607 | 1.0734 | |
| 0.27 | 198.86 | 3.8215 | 0.8183 | |
| 0.50 | 49.15 | 0.9446 | 0.6796 | |
| 1.10 | 240.47 | 4.6213 | 0.5831 | |
| 0.28 | 60.79 | 1.1683 | 0.5269 | |
| 0.44 | 42.87 | 0.8239 | 0.4408 | |
| 0.13 | 25.62 | 0.4924 | 0.4106 | |
| 0.50 | 45.92 | 0.8824 | 0.4104 |
Penurunan Teratas Suku Tahun Ini
Kami menggunakan perubahan dalam peruntukan portfolio kerana ini adalah metrik yang paling bermakna. Perubahan boleh disebabkan oleh perdagangan atau perubahan dalam harga saham.
| Sekuriti | Saham (MM) |
Nilai (MM$) |
Portfolio % | ΔPortfolio % |
|---|---|---|---|---|
| -323.98 | -6.2262 | -6.2262 | ||
| 0.14 | 44.72 | 0.8594 | -0.5944 | |
| 1.52 | 312.67 | 6.0088 | -0.5463 | |
| 64.89 | 64.89 | 1.2470 | -0.5428 | |
| 0.00 | 8.71 | 0.1673 | -0.3374 | |
| 0.01 | 11.50 | 0.2209 | -0.2845 | |
| 0.32 | 28.68 | 0.5512 | -0.2728 | |
| 0.12 | 8.56 | 0.1645 | -0.2330 | |
| 0.63 | 8.82 | 0.1696 | -0.2016 | |
| 0.70 | 75.51 | 1.4512 | -0.1970 |
13F dan Pemfailan Dana
Borang ini telah difailkan pada 2025-08-26 untuk tempoh pelaporan 2025-06-30. Klik ikon pautan untuk melihat sejarah transaksi penuh.
Tingkatkan untuk membuka data premium dan eksport ke Excel ![]() .
.
| Sekuriti | Jenis | Purata Harga Saham | Saham (MM) |
ΔSaham (%) |
ΔSaham (%) |
Nilai ($MM) |
Portfolio (%) |
ΔPortfolio (%) |
|
|---|---|---|---|---|---|---|---|---|---|
| MSFT / Microsoft Corporation | 0.88 | -9.70 | 437.85 | 19.65 | 8.4143 | 1.9587 | |||
| NVDA / NVIDIA Corporation | 2.70 | -10.84 | 426.30 | 29.97 | 8.1923 | 2.4063 | |||
| AAPL / Apple Inc. | 1.52 | -8.90 | 312.67 | -15.86 | 6.0088 | -0.5463 | |||
| AMZN / Amazon.com, Inc. | 1.10 | -8.90 | 240.47 | 5.05 | 4.6213 | 0.5831 | |||
| META / Meta Platforms, Inc. | 0.27 | -8.79 | 198.86 | 16.81 | 3.8215 | 0.8183 | |||
| AVGO / Broadcom Inc. | 0.48 | -4.01 | 133.25 | 58.04 | 2.5607 | 1.0734 | |||
| GOOGL / Alphabet Inc. | 0.61 | -10.22 | 108.01 | 2.31 | 2.0756 | 0.2133 | |||
| MA / Mastercard Incorporated | 0.17 | -10.80 | 92.83 | -8.55 | 1.7839 | -0.0068 | |||
| TSLA / Tesla, Inc. | 0.27 | -8.90 | 87.34 | 11.66 | 1.6784 | 0.2987 | |||
| V / Visa Inc. | 0.24 | -13.33 | 85.97 | -12.20 | 1.6522 | -0.0751 | |||
| BRK.B / Berkshire Hathaway Inc. | 0.17 | -8.90 | 81.85 | -16.91 | 1.5730 | -0.1647 | |||
| XOM / Exxon Mobil Corporation | 0.70 | -10.83 | 75.51 | -19.18 | 1.4512 | -0.1970 | |||
| BAC / Bank of America Corporation | 1.46 | -0.15 | 68.96 | 13.22 | 1.3253 | 0.2508 | |||
| MGMXX / JPMorgan Trust II - JPMorgan U.S. Government Money Market Fund IM | 64.89 | -36.04 | 64.89 | -36.05 | 1.2470 | -0.5428 | |||
| ABBV / AbbVie Inc. | 0.33 | -2.06 | 61.24 | -13.23 | 1.1769 | -0.0681 | |||
| ORCL / Oracle Corporation | 0.28 | 6.93 | 60.79 | 67.22 | 1.1683 | 0.5269 | |||
| WFC / Wells Fargo & Company | 0.75 | -2.47 | 59.72 | 8.85 | 1.1477 | 0.1798 | |||
| GOOG / Alphabet Inc. | 0.33 | -13.48 | 58.69 | -1.76 | 1.1279 | 0.0740 | |||
| LLY / Eli Lilly and Company | 0.07 | -9.73 | 55.51 | -14.80 | 1.0667 | -0.0826 | |||
| HWM / Howmet Aerospace Inc. | 0.28 | -11.92 | 51.41 | 26.37 | 0.9880 | 0.2703 | |||
| WMT / Walmart Inc. | 0.50 | 193.80 | 49.15 | 227.24 | 0.9446 | 0.6796 | |||
| LOW / Lowe's Companies, Inc. | 0.22 | -3.61 | 48.67 | -8.30 | 0.9354 | -0.0010 | |||
| JNJ / Johnson & Johnson | 0.32 | 0.55 | 48.46 | -7.38 | 0.9312 | 0.0083 | |||
| MCD / McDonald's Corporation | 0.16 | -10.26 | 47.88 | -16.06 | 0.9202 | -0.0861 | |||
| SCHW / The Charles Schwab Corporation | 0.50 | 47.22 | 45.92 | 71.60 | 0.8824 | 0.4104 | |||
| SO / The Southern Company | 0.50 | -8.14 | 45.91 | -8.26 | 0.8822 | -0.0005 | |||
| PEP / PepsiCo, Inc. | 0.35 | -2.77 | 45.61 | -14.38 | 0.8765 | -0.0632 | |||
| CRM / Salesforce, Inc. | 0.17 | -8.90 | 45.47 | -7.43 | 0.8738 | 0.0073 | |||
| UNH / UnitedHealth Group Incorporated | 0.14 | -8.90 | 44.72 | -45.74 | 0.8594 | -0.5944 | |||
| LIN / Linde plc | 0.09 | -8.90 | 44.57 | -8.21 | 0.8565 | -0.0000 | |||
| TT / Trane Technologies plc | 0.10 | -29.84 | 43.75 | -8.92 | 0.8408 | -0.0065 | |||
| NOW / ServiceNow, Inc. | 0.04 | -7.71 | 43.29 | 19.17 | 0.8319 | 0.1911 | |||
| LRCX / Lam Research Corporation | 0.44 | 47.44 | 42.87 | 97.41 | 0.8239 | 0.4408 | |||
| TXN / Texas Instruments Incorporated | 0.21 | -10.14 | 42.64 | 3.83 | 0.8194 | 0.0950 | |||
| ADI / Analog Devices, Inc. | 0.18 | -10.30 | 42.23 | 5.87 | 0.8115 | 0.1079 | |||
| PGR / The Progressive Corporation | 0.16 | -7.84 | 41.72 | -13.10 | 0.8017 | -0.0452 | |||
| NEE / NextEra Energy, Inc. | 0.59 | -9.86 | 40.70 | -11.73 | 0.7822 | -0.0312 | |||
| SYK / Stryker Corporation | 0.10 | -10.09 | 40.43 | -4.44 | 0.7769 | 0.0306 | |||
| TMO / Thermo Fisher Scientific Inc. | 0.09 | -7.80 | 38.31 | -24.88 | 0.7363 | -0.1634 | |||
| MDLZ / Mondelez International, Inc. | 0.52 | -9.78 | 35.29 | -10.33 | 0.6782 | -0.0161 | |||
| NFLX / Netflix, Inc. | 0.03 | 42.10 | 34.94 | 104.06 | 0.6715 | 0.3694 | |||
| DIS / The Walt Disney Company | 0.28 | 9.57 | 34.41 | 37.67 | 0.6613 | 0.2204 | |||
| NXPI / NXP Semiconductors N.V. | 0.16 | -14.56 | 34.23 | -1.78 | 0.6578 | 0.0431 | |||
| BSX / Boston Scientific Corporation | 0.32 | -5.84 | 34.21 | 0.25 | 0.6575 | 0.0555 | |||
| EOG / EOG Resources, Inc. | 0.28 | 41.06 | 34.00 | 31.57 | 0.6534 | 0.1975 | |||
| STX / Seagate Technology Holdings plc | 0.23 | -8.90 | 33.75 | 54.78 | 0.6485 | 0.2639 | |||
| DE / Deere & Company | 0.07 | -8.91 | 33.42 | -1.32 | 0.6422 | 0.0448 | |||
| RTX / RTX Corporation | 0.23 | 17.59 | 33.15 | 29.63 | 0.6370 | 0.1859 | |||
| TDG / TransDigm Group Incorporated | 0.02 | -12.23 | 31.93 | -3.52 | 0.6136 | 0.0298 | |||
| AJG / Arthur J. Gallagher & Co. | 0.10 | -3.24 | 31.81 | -10.28 | 0.6113 | -0.0141 | |||
| CARR / Carrier Global Corporation | 0.43 | 20.61 | 31.73 | 39.24 | 0.6098 | 0.2078 | |||
| HLT / Hilton Worldwide Holdings Inc. | 0.12 | 8.87 | 30.64 | 27.43 | 0.5887 | 0.1646 | |||
| MDT / Medtronic plc | 0.34 | -0.03 | 29.50 | -3.03 | 0.5670 | 0.0303 | |||
| CMCSA / Comcast Corporation | 0.82 | -8.90 | 29.37 | -11.89 | 0.5644 | -0.0236 | |||
| KO / The Coca-Cola Company | 0.41 | -22.91 | 29.03 | -23.84 | 0.5579 | -0.1146 | |||
| CMG / Chipotle Mexican Grill, Inc. | 0.51 | -5.37 | 28.87 | 5.82 | 0.5548 | 0.0735 | |||
| COP / ConocoPhillips | 0.32 | -28.15 | 28.68 | -38.60 | 0.5512 | -0.2728 | |||
| KDP / Keurig Dr Pepper Inc. | 0.86 | 43.44 | 28.55 | 38.58 | 0.5487 | 0.1852 | |||
| BMY / Bristol-Myers Squibb Company | 0.61 | -8.75 | 28.32 | -30.74 | 0.5442 | -0.1771 | |||
| CME / CME Group Inc. | 0.10 | -9.94 | 27.38 | -6.43 | 0.5261 | 0.0100 | |||
| FIS / Fidelity National Information Services, Inc. | 0.33 | 1.02 | 27.13 | 10.12 | 0.5215 | 0.0868 | |||
| YUM / Yum! Brands, Inc. | 0.18 | -8.90 | 27.07 | -14.21 | 0.5202 | -0.0364 | |||
| C / Citigroup Inc. | 0.30 | 3.60 | 25.65 | 24.23 | 0.4929 | 0.1287 | |||
| VST / Vistra Corp. | 0.13 | 234.97 | 25.62 | 452.87 | 0.4924 | 0.4106 | |||
| OTIS / Otis Worldwide Corporation | 0.26 | -10.01 | 25.59 | -13.66 | 0.4917 | -0.0311 | |||
| ROST / Ross Stores, Inc. | 0.20 | -8.20 | 25.39 | -8.35 | 0.4880 | -0.0008 | |||
| PM / Philip Morris International Inc. | 0.14 | -2.43 | 25.32 | 11.96 | 0.4866 | 0.0876 | |||
| CI / The Cigna Group | 0.08 | 18.21 | 25.32 | 18.77 | 0.4866 | 0.1105 | |||
| CTSH / Cognizant Technology Solutions Corporation | 0.32 | -8.90 | 25.08 | -7.08 | 0.4820 | 0.0059 | |||
| T / AT&T Inc. | 0.86 | -8.90 | 25.02 | -6.77 | 0.4808 | 0.0074 | |||
| AMP / Ameriprise Financial, Inc. | 0.05 | 6.00 | 24.73 | 16.86 | 0.4753 | 0.1020 | |||
| MU / Micron Technology, Inc. | 0.20 | -16.73 | 24.54 | 18.11 | 0.4717 | 0.1051 | |||
| CPAY / Corpay, Inc. | 0.07 | -2.68 | 24.48 | -7.40 | 0.4704 | 0.0041 | |||
| VTR / Ventas, Inc. | 0.38 | -7.68 | 24.00 | -15.22 | 0.4611 | -0.0381 | |||
| MMM / 3M Company | 0.16 | 12.87 | 23.73 | 17.01 | 0.4560 | 0.0983 | |||
| ETN / Eaton Corporation plc | 0.07 | -8.89 | 23.44 | 19.66 | 0.4504 | 0.1049 | |||
| AON / Aon plc | 0.07 | -2.04 | 23.39 | -12.43 | 0.4495 | -0.0217 | |||
| UBER / Uber Technologies, Inc. | 0.24 | -44.10 | 22.03 | -28.41 | 0.4233 | -0.1195 | |||
| VRTX / Vertex Pharmaceuticals Incorporated | 0.05 | -13.91 | 21.52 | -20.95 | 0.4136 | -0.0666 | |||
| FITB / Fifth Third Bancorp | 0.52 | 0.52 | 21.23 | 5.47 | 0.4080 | 0.0529 | |||
| INTU / Intuit Inc. | 0.03 | -13.24 | 21.22 | 11.29 | 0.4077 | 0.0714 | |||
| AXP / American Express Company | 0.06 | -26.73 | 20.16 | -13.13 | 0.3875 | -0.0220 | |||
| LDOS / Leidos Holdings, Inc. | 0.13 | -8.90 | 19.99 | 6.51 | 0.3841 | 0.0531 | |||
| BKNG / Booking Holdings Inc. | 0.00 | -24.18 | 19.42 | -4.72 | 0.3733 | 0.0136 | |||
| PLTR / Palantir Technologies Inc. | 0.14 | 4.98 | 19.28 | 69.56 | 0.3705 | 0.1699 | |||
| CAT / Caterpillar Inc. | 0.05 | -21.53 | 18.97 | -7.63 | 0.3646 | 0.0023 | |||
| UPS / United Parcel Service, Inc. | 0.19 | -20.08 | 18.74 | -26.66 | 0.3601 | -0.0906 | |||
| EQIX / Equinix, Inc. | 0.02 | 236.31 | 18.22 | 228.13 | 0.3502 | 0.2522 | |||
| CHTR / Charter Communications, Inc. | 0.04 | -8.90 | 18.19 | 1.06 | 0.3495 | 0.0320 | |||
| REGN / Regeneron Pharmaceuticals, Inc. | 0.03 | -8.90 | 17.75 | -24.59 | 0.3410 | -0.0741 | |||
| USB / U.S. Bancorp | 0.38 | 0.62 | 17.24 | 7.84 | 0.3314 | 0.0493 | |||
| SBAC / SBA Communications Corporation | 0.07 | -8.90 | 17.24 | -2.76 | 0.3313 | 0.0185 | |||
| COF / Capital One Financial Corporation | 0.08 | 85.48 | 17.18 | 120.09 | 0.3301 | 0.1924 | |||
| EW / Edwards Lifesciences Corporation | 0.22 | 8.71 | 17.15 | 17.30 | 0.3295 | 0.0717 | |||
| CCL / Carnival Corporation & plc | 0.61 | 69.88 | 17.09 | 144.62 | 0.3284 | 0.2052 | |||
| WELL / Welltower Inc. | 0.11 | -5.97 | 16.55 | -5.65 | 0.3181 | 0.0086 | |||
| PLD / Prologis, Inc. | 0.14 | -20.88 | 15.08 | -25.61 | 0.2898 | -0.0678 | |||
| EXPE / Expedia Group, Inc. | 0.09 | -9.23 | 14.99 | -8.92 | 0.2882 | -0.0023 | |||
| BURL / Burlington Stores, Inc. | 0.06 | 13.40 | 14.69 | 10.70 | 0.2823 | 0.0482 | |||
| CDNS / Cadence Design Systems, Inc. | 0.05 | 82.66 | 14.64 | 121.33 | 0.2813 | 0.1646 | |||
| APO / Apollo Global Management, Inc. | 0.10 | 14.53 | 0.2793 | 0.2793 | |||||
| FDX / FedEx Corporation | 0.06 | 11.86 | 13.73 | 4.31 | 0.2639 | 0.0317 | |||
| PCAR / PACCAR Inc | 0.14 | 9.34 | 13.44 | 6.74 | 0.2584 | 0.0362 | |||
| PPG / PPG Industries, Inc. | 0.12 | -8.90 | 13.27 | -5.23 | 0.2550 | 0.0080 | |||
| ANET / Arista Networks Inc | 0.13 | -8.90 | 12.82 | 20.30 | 0.2464 | 0.0584 | |||
| BKR / Baker Hughes Company | 0.33 | -8.90 | 12.47 | -20.53 | 0.2397 | -0.0372 | |||
| FANG / Diamondback Energy, Inc. | 0.09 | -8.90 | 12.14 | -21.71 | 0.2332 | -0.0402 | |||
| DASH / DoorDash, Inc. | 0.05 | 1.94 | 11.82 | 37.50 | 0.2272 | 0.0755 | |||
| TXT / Textron Inc. | 0.14 | -8.90 | 11.64 | 1.23 | 0.2237 | 0.0209 | |||
| STT / State Street Corporation | 0.11 | -52.05 | 11.60 | -31.09 | 0.2230 | -0.1307 | |||
| MAS / Masco Corporation | 0.18 | -8.90 | 11.56 | -15.69 | 0.2222 | -0.0197 | |||
| COST / Costco Wholesale Corporation | 0.01 | -61.66 | 11.50 | -59.87 | 0.2209 | -0.2845 | |||
| MO / Altria Group, Inc. | 0.18 | -8.90 | 10.33 | -11.00 | 0.1985 | -0.0063 | |||
| MCK / McKesson Corporation | 0.01 | -8.90 | 10.11 | -0.81 | 0.1942 | 0.0145 | |||
| TFC / Truist Financial Corporation | 0.22 | -55.92 | 9.62 | -53.95 | 0.1850 | -0.1837 | |||
| IR / Ingersoll Rand Inc. | 0.12 | -8.90 | 9.58 | -5.32 | 0.1842 | 0.0056 | |||
| HUM / Humana Inc. | 0.04 | 16.49 | 9.53 | 7.64 | 0.1832 | 0.0270 | |||
| FCX / Freeport-McMoRan Inc. | 0.22 | 28.23 | 9.35 | 49.06 | 0.1796 | 0.0438 | |||
| DAL / Delta Air Lines, Inc. | 0.18 | -8.90 | 9.05 | 2.76 | 0.1740 | 0.0186 | |||
| MRK / Merck & Co., Inc. | 0.11 | 39.95 | 8.97 | 23.43 | 0.1723 | 0.0442 | |||
| MLM / Martin Marietta Materials, Inc. | 0.02 | -8.90 | 8.92 | 4.60 | 0.1714 | 0.0210 | |||
| PCG / PG&E Corporation | 0.63 | -48.31 | 8.82 | -58.06 | 0.1696 | -0.2016 | |||
| TOST / Toast, Inc. | 0.20 | -2.74 | 8.73 | 29.86 | 0.1678 | 0.0492 | |||
| AZO / AutoZone, Inc. | 0.00 | -68.75 | 8.71 | -69.57 | 0.1673 | -0.3374 | |||
| KVUE / Kenvue Inc. | 0.41 | -17.50 | 8.60 | -27.99 | 0.1653 | -0.0454 | |||
| NKE / NIKE, Inc. | 0.12 | -37.22 | 8.56 | -53.36 | 0.1645 | -0.2330 | |||
| SHW / The Sherwin-Williams Company | 0.02 | 44.46 | 8.43 | 42.05 | 0.1620 | 0.0573 | |||
| LYB / LyondellBasell Industries N.V. | 0.14 | -8.90 | 8.25 | -25.13 | 0.1585 | -0.0358 | |||
| ELS / Equity LifeStyle Properties, Inc. | 0.13 | 15.16 | 8.16 | 6.47 | 0.1568 | 0.0216 | |||
| GEV / GE Vernova Inc. | 0.02 | 8.11 | 0.1559 | 0.1559 | |||||
| VMC / Vulcan Materials Company | 0.03 | 8.07 | 0.1551 | 0.1551 | |||||
| RJF / Raymond James Financial, Inc. | 0.05 | -49.15 | 7.75 | -22.34 | 0.1490 | -0.0673 | |||
| URI / United Rentals, Inc. | 0.01 | -8.88 | 7.56 | 9.55 | 0.1453 | 0.0235 | |||
| EMR / Emerson Electric Co. | 0.06 | 7.53 | 0.1446 | 0.1446 | |||||
| MSI / Motorola Solutions, Inc. | 0.02 | -10.59 | 7.31 | -14.14 | 0.1405 | -0.0097 | |||
| CHD / Church & Dwight Co., Inc. | 0.08 | -48.73 | 7.25 | -55.24 | 0.1394 | -0.1465 | |||
| HCA / HCA Healthcare, Inc. | 0.02 | -8.89 | 6.49 | 1.01 | 0.1248 | 0.0114 | |||
| LEN / Lennar Corporation | 0.05 | -8.90 | 5.72 | -12.21 | 0.1100 | -0.0050 | |||
| NUE / Nucor Corporation | 0.04 | -8.90 | 4.96 | -1.94 | 0.0953 | 0.0061 | |||
| Aptiv plc / EC (JE00BTDN8H13) | 0.07 | -8.90 | 4.60 | 4.45 | 0.0884 | 0.0107 | |||
| WMG / Warner Music Group Corp. | 0.16 | -10.03 | 4.45 | -21.82 | 0.0855 | -0.0149 | |||
| S&P 500 Index / DE (N/A) | 4.16 | 0.0799 | 0.0799 | ||||||
| NBIX / Neurocrine Biosciences, Inc. | 0.03 | -8.90 | 4.04 | 3.53 | 0.0777 | 0.0088 | |||
| ETR / Entergy Corporation | 0.04 | -8.43 | 3.71 | -10.96 | 0.0713 | -0.0022 | |||
| NRG / NRG Energy, Inc. | 0.02 | -8.90 | 3.61 | 53.27 | 0.0695 | 0.0279 | |||
| BAX / Baxter International Inc. | 0.09 | -8.90 | 2.82 | -19.41 | 0.0542 | -0.0075 | |||
| CRWD / CrowdStrike Holdings, Inc. | 0.01 | 2.80 | 0.0538 | 0.0538 | |||||
| WDC / Western Digital Corporation | 0.04 | -8.90 | 2.40 | 44.26 | 0.0462 | 0.0168 | |||
| WEX / WEX Inc. | 0.01 | -10.03 | 2.13 | -15.83 | 0.0409 | -0.0037 | |||
| ZBH / Zimmer Biomet Holdings, Inc. | 0.02 | 1.90 | 0.0365 | 0.0365 | |||||
| ARE / Alexandria Real Estate Equities, Inc. | 0.03 | -8.90 | 1.90 | -28.50 | 0.0365 | -0.0103 | |||
| S&P 500 E-Mini Index / DE (N/A) | 1.29 | 0.0247 | 0.0247 | ||||||
| MRVL / Marvell Technology, Inc. | 0.00 | -100.00 | 0.00 | -100.00 | -0.0425 | ||||
| SNDK / Sandisk Corporation | 0.00 | -100.00 | 0.00 | -100.00 | -0.0115 | ||||
| S&P 500 Index / DE (N/A) | -1.17 | -0.0224 | -0.0224 | ||||||
| S&P 500 Index / DE (N/A) | -323.98 | -6.2262 | -6.2262 |