Statistik Asas
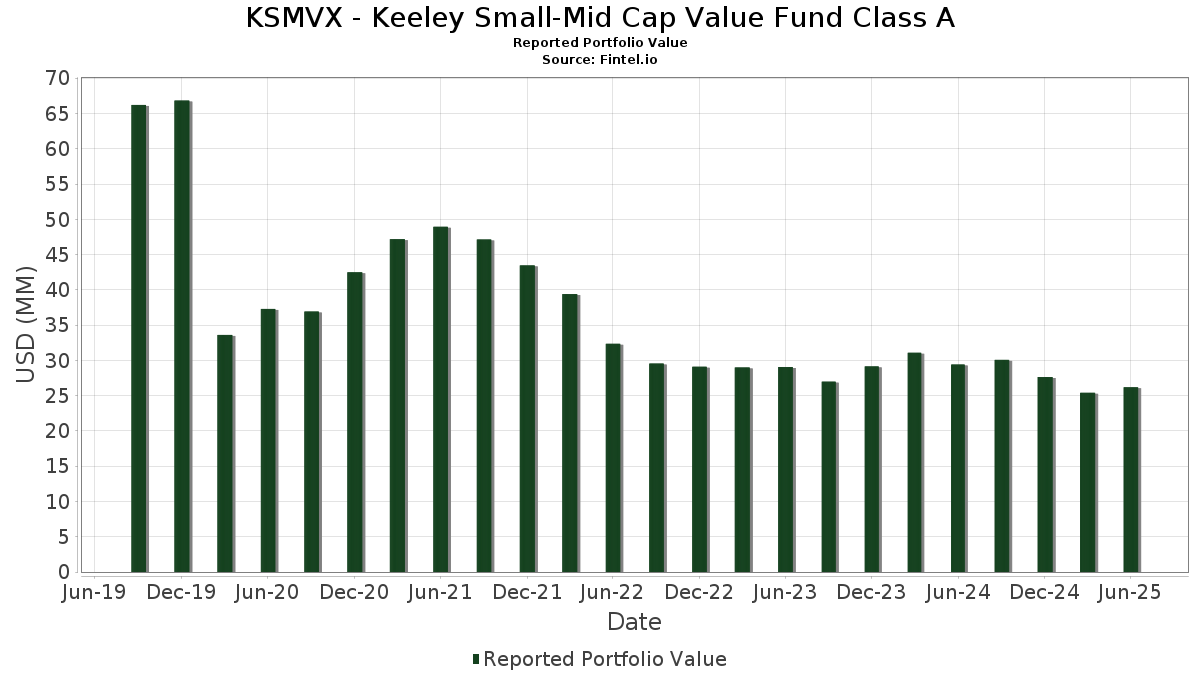
| Nilai Portfolio | $ 26,190,116 |
| Kedudukan Semasa | 82 |
Pegangan Terkini, Prestasi, AUM (dari 13F, 13D)
KSMVX - Keeley Small-Mid Cap Value Fund Class A telah mendedahkan 82 jumlah pegangan dalam pemfailan SEC terkini mereka. Nilai portfolio terkini dikira sebagai $ 26,190,116 USD. Aset Sebenar Di Bawah Pengurusan (AUM) ialah nilai ini ditambah dengan tunai (yang tidak didedahkan). Pegangan teratas KSMVX - Keeley Small-Mid Cap Value Fund Class A ialah NRG Energy, Inc. (US:NRG) , Everus Construction Group, Inc. (US:ECG) , TechnipFMC plc (CH:FTI) , Equitable Holdings, Inc. (US:EQH) , and Amentum Holdings, Inc. (US:AMTM) . Kedudukan baharu KSMVX - Keeley Small-Mid Cap Value Fund Class A termasuk OR Royalties Inc. (US:OR) , Alight, Inc. (US:ALIT) , Amrize AG (US:AMRZ) , .
Kenaikan Teratas Suku Tahun Ini
Kami menggunakan perubahan dalam peruntukan portfolio kerana ini adalah metrik yang paling bermakna. Perubahan boleh disebabkan oleh perdagangan atau perubahan dalam harga saham.
| Sekuriti | Saham (MM) |
Nilai (MM$) |
Portfolio % | ΔPortfolio % |
|---|---|---|---|---|
| 0.02 | 0.47 | 1.7858 | 1.7858 | |
| 0.01 | 0.81 | 3.1202 | 1.0610 | |
| 0.01 | 0.68 | 2.6085 | 1.0425 | |
| 0.23 | 0.8960 | 0.8960 | ||
| 0.00 | 0.40 | 1.5193 | 0.5696 | |
| 0.02 | 0.14 | 0.5287 | 0.5287 | |
| 0.00 | 0.13 | 0.4858 | 0.4858 | |
| 0.01 | 0.49 | 1.8661 | 0.4102 | |
| 0.02 | 0.50 | 1.9338 | 0.4009 | |
| 0.01 | 0.35 | 1.3326 | 0.3568 |
Penurunan Teratas Suku Tahun Ini
Kami menggunakan perubahan dalam peruntukan portfolio kerana ini adalah metrik yang paling bermakna. Perubahan boleh disebabkan oleh perdagangan atau perubahan dalam harga saham.
| Sekuriti | Saham (MM) |
Nilai (MM$) |
Portfolio % | ΔPortfolio % |
|---|---|---|---|---|
| 0.00 | 0.25 | 0.9471 | -0.6649 | |
| 0.00 | 0.11 | 0.4130 | -0.4528 | |
| 0.02 | 0.39 | 1.4745 | -0.4213 | |
| 0.01 | 0.33 | 1.2821 | -0.4174 | |
| 0.01 | 0.35 | 1.3291 | -0.4008 | |
| 0.00 | 0.07 | 0.2517 | -0.3269 | |
| 0.02 | 0.19 | 0.7351 | -0.2595 | |
| 0.01 | 0.08 | 0.3251 | -0.2525 | |
| 0.01 | 0.45 | 1.7317 | -0.2360 | |
| 0.01 | 0.23 | 0.8650 | -0.2188 |
13F dan Pemfailan Dana
Borang ini telah difailkan pada 2025-08-29 untuk tempoh pelaporan 2025-06-30. Klik ikon pautan untuk melihat sejarah transaksi penuh.
Tingkatkan untuk membuka data premium dan eksport ke Excel ![]() .
.
| Sekuriti | Jenis | Purata Harga Saham | Saham (MM) |
ΔSaham (%) |
ΔSaham (%) |
Nilai ($MM) |
Portfolio (%) |
ΔPortfolio (%) |
|
|---|---|---|---|---|---|---|---|---|---|
| NRG / NRG Energy, Inc. | 0.01 | -7.37 | 0.81 | 55.94 | 3.1202 | 1.0610 | |||
| ECG / Everus Construction Group, Inc. | 0.01 | 0.00 | 0.68 | 71.54 | 2.6085 | 1.0425 | |||
| FTI / TechnipFMC plc | 0.02 | 0.00 | 0.56 | 8.70 | 2.1550 | 0.1159 | |||
| EQH / Equitable Holdings, Inc. | 0.01 | 0.00 | 0.52 | 7.71 | 1.9825 | 0.0896 | |||
| AMTM / Amentum Holdings, Inc. | 0.02 | 0.00 | 0.50 | 29.56 | 1.9338 | 0.4009 | |||
| GXO / GXO Logistics, Inc. | 0.01 | 0.00 | 0.50 | 24.63 | 1.9203 | 0.3357 | |||
| KALU / Kaiser Aluminum Corporation | 0.01 | 0.00 | 0.49 | 31.98 | 1.8661 | 0.4102 | |||
| ENSG / The Ensign Group, Inc. | 0.00 | 0.00 | 0.49 | 19.16 | 1.8608 | 0.2557 | |||
| GTLS / Chart Industries, Inc. | 0.00 | 0.00 | 0.48 | 13.91 | 1.8216 | 0.1793 | |||
| OR / OR Royalties Inc. | 0.02 | 0.47 | 1.7858 | 1.7858 | |||||
| SOLV / Solventum Corporation | 0.01 | 0.00 | 0.46 | -0.22 | 1.7670 | -0.0548 | |||
| SWX / Southwest Gas Holdings, Inc. | 0.01 | 0.00 | 0.46 | 3.60 | 1.7620 | 0.0132 | |||
| KNF / Knife River Corporation | 0.01 | 0.00 | 0.45 | -9.42 | 1.7317 | -0.2360 | |||
| CTRE / CareTrust REIT, Inc. | 0.01 | 0.00 | 0.45 | 6.95 | 1.7111 | 0.0677 | |||
| EVRG / Evergy, Inc. | 0.01 | 0.00 | 0.42 | 0.00 | 1.6065 | -0.0460 | |||
| AL / Air Lease Corporation | 0.01 | 0.00 | 0.42 | 21.28 | 1.5941 | 0.2402 | |||
| SSB / SouthState Corporation | 0.00 | 0.00 | 0.41 | -0.96 | 1.5880 | -0.0590 | |||
| VIRT / Virtu Financial, Inc. | 0.01 | 0.00 | 0.41 | 17.71 | 1.5782 | 0.1970 | |||
| LAMR / Lamar Advertising Company | 0.00 | 0.00 | 0.41 | 6.82 | 1.5588 | 0.0560 | |||
| BPOP / Popular, Inc. | 0.00 | 0.00 | 0.41 | 19.06 | 1.5582 | 0.2153 | |||
| SPB / Spectrum Brands Holdings, Inc. | 0.01 | 22.14 | 0.40 | -9.46 | 1.5409 | -0.2105 | |||
| KTB / Kontoor Brands, Inc. | 0.01 | 0.00 | 0.40 | 3.08 | 1.5400 | 0.0006 | |||
| PRGO / Perrigo Company plc | 0.01 | 0.00 | 0.40 | -4.77 | 1.5295 | -0.1210 | |||
| WEX / WEX Inc. | 0.00 | 75.85 | 0.40 | 64.32 | 1.5193 | 0.5696 | |||
| WTFC / Wintrust Financial Corporation | 0.00 | 0.00 | 0.39 | 10.23 | 1.4884 | 0.1001 | |||
| SNV / Synovus Financial Corp. | 0.01 | 0.00 | 0.39 | 10.92 | 1.4792 | 0.1054 | |||
| KLG / WK Kellogg Co | 0.02 | 0.00 | 0.39 | -19.96 | 1.4745 | -0.4213 | |||
| EXE / Expand Energy Corporation | 0.00 | 0.00 | 0.38 | 5.26 | 1.4559 | 0.0307 | |||
| HAS / Hasbro, Inc. | 0.01 | 0.00 | 0.38 | 19.94 | 1.4545 | 0.2086 | |||
| PNTG / The Pennant Group, Inc. | 0.01 | 0.00 | 0.37 | 18.85 | 1.4253 | 0.1904 | |||
| OUT / OUTFRONT Media Inc. | 0.02 | 0.00 | 0.36 | 1.12 | 1.3896 | -0.0236 | |||
| AQN / Algonquin Power & Utilities Corp. | 0.06 | 0.00 | 0.36 | 11.38 | 1.3877 | 0.1076 | |||
| MDU / MDU Resources Group, Inc. | 0.02 | 0.00 | 0.36 | -1.38 | 1.3689 | -0.0590 | |||
| VNT / Vontier Corporation | 0.01 | 0.00 | 0.35 | 12.54 | 1.3407 | 0.1134 | |||
| NVT / nVent Electric plc | 0.00 | 0.00 | 0.35 | 39.60 | 1.3394 | 0.3538 | |||
| CXT / Crane NXT, Co. | 0.01 | 33.91 | 0.35 | 40.49 | 1.3326 | 0.3568 | |||
| TAP / Molson Coors Beverage Company | 0.01 | 0.00 | 0.35 | -20.96 | 1.3291 | -0.4008 | |||
| MRP / Millrose Properties, Inc. | 0.01 | 0.00 | 0.34 | 7.52 | 1.3157 | 0.0577 | |||
| SNX / TD SYNNEX Corporation | 0.00 | 0.00 | 0.34 | 30.65 | 1.3064 | 0.2772 | |||
| TPH / Tri Pointe Homes, Inc. | 0.01 | -22.50 | 0.33 | -22.51 | 1.2821 | -0.4174 | |||
| ACT / Enact Holdings, Inc. | 0.01 | 0.00 | 0.33 | 6.84 | 1.2575 | 0.0479 | |||
| COLB / Columbia Banking System, Inc. | 0.01 | 0.00 | 0.33 | -6.29 | 1.2573 | -0.1219 | |||
| GLPI / Gaming and Leisure Properties, Inc. | 0.01 | 0.00 | 0.32 | -8.47 | 1.2436 | -0.1508 | |||
| AMBP / Ardagh Metal Packaging SA | 0.07 | -16.67 | 0.31 | 18.18 | 1.1973 | 0.1548 | |||
| CR / Crane Company | 0.00 | 0.00 | 0.31 | 23.69 | 1.1824 | 0.2016 | |||
| CON / Concentra Group Holdings Parent, Inc. | 0.01 | 0.00 | 0.30 | -5.38 | 1.1475 | -0.0973 | |||
| BC / Brunswick Corporation | 0.01 | 29.81 | 0.29 | 33.64 | 1.1108 | 0.2530 | |||
| ITT / ITT Inc. | 0.00 | 0.00 | 0.28 | 21.30 | 1.0708 | 0.1640 | |||
| INSW / International Seaways, Inc. | 0.01 | 0.00 | 0.28 | 9.88 | 1.0679 | 0.0685 | |||
| WH / Wyndham Hotels & Resorts, Inc. | 0.00 | 0.00 | 0.28 | -10.36 | 1.0639 | -0.1554 | |||
| CHRD / Chord Energy Corporation | 0.00 | 0.00 | 0.27 | -14.11 | 1.0522 | -0.2071 | |||
| BATRK / Atlanta Braves Holdings, Inc. | 0.01 | 0.00 | 0.27 | 17.03 | 1.0275 | 0.1236 | |||
| NATL / NCR Atleos Corporation | 0.01 | 0.00 | 0.26 | 7.98 | 0.9871 | 0.0486 | |||
| ESAB / ESAB Corporation | 0.00 | 0.00 | 0.25 | 3.67 | 0.9745 | 0.0061 | |||
| FBIN / Fortune Brands Innovations, Inc. | 0.00 | 43.44 | 0.25 | 20.98 | 0.9524 | 0.1450 | |||
| NXST / Nexstar Media Group, Inc. | 0.00 | 0.00 | 0.25 | -3.52 | 0.9484 | -0.0622 | |||
| HHH / Howard Hughes Holdings Inc. | 0.00 | -33.70 | 0.25 | -39.61 | 0.9471 | -0.6649 | |||
| SOC / Sable Offshore Corp. | 0.01 | 0.00 | 0.24 | -13.09 | 0.9155 | -0.1711 | |||
| United States Treasury Bill / DBT (US912797MG92) | 0.23 | 0.8960 | 0.8960 | ||||||
| LW / Lamb Weston Holdings, Inc. | 0.00 | 0.00 | 0.23 | -2.56 | 0.8752 | -0.0499 | |||
| SILA / Sila Realty Trust, Inc. | 0.01 | 0.00 | 0.23 | -11.28 | 0.8747 | -0.1403 | |||
| ENOV / Enovis Corporation | 0.01 | 0.00 | 0.23 | -18.18 | 0.8650 | -0.2188 | |||
| VOYA / Voya Financial, Inc. | 0.00 | 0.00 | 0.22 | 4.85 | 0.8301 | 0.0155 | |||
| PVH / PVH Corp. | 0.00 | 0.00 | 0.21 | 6.22 | 0.7878 | 0.0245 | |||
| VICI / VICI Properties Inc. | 0.01 | 0.00 | 0.21 | 0.00 | 0.7864 | -0.0228 | |||
| VVV / Valvoline Inc. | 0.01 | 0.00 | 0.21 | 9.04 | 0.7852 | 0.0430 | |||
| BBWI / Bath & Body Works, Inc. | 0.01 | 0.00 | 0.20 | -0.99 | 0.7701 | -0.0313 | |||
| EMBC / Embecta Corp. | 0.02 | 0.00 | 0.19 | -24.21 | 0.7351 | -0.2595 | |||
| VYX / NCR Voyix Corporation | 0.02 | 0.00 | 0.19 | 20.51 | 0.7230 | 0.1050 | |||
| LH / Labcorp Holdings Inc. | 0.00 | 0.00 | 0.18 | 12.88 | 0.7067 | 0.0624 | |||
| GRAL / GRAIL, Inc. | 0.00 | 0.00 | 0.17 | 101.16 | 0.6654 | 0.3255 | |||
| ZIMV / ZimVie Inc. | 0.02 | 0.00 | 0.15 | -13.71 | 0.5811 | -0.1091 | |||
| STRW / Strawberry Fields REIT, Inc. | 0.01 | 0.95 | 0.15 | -10.71 | 0.5771 | -0.0872 | |||
| K / Kellanova | 0.00 | 0.00 | 0.14 | -4.08 | 0.5430 | -0.0362 | |||
| ALIT / Alight, Inc. | 0.02 | 0.14 | 0.5287 | 0.5287 | |||||
| VSCO / Victoria's Secret & Co. | 0.01 | 0.00 | 0.14 | 0.00 | 0.5223 | -0.0165 | |||
| AMRZ / Amrize AG | 0.00 | 0.13 | 0.4858 | 0.4858 | |||||
| ZD / Ziff Davis, Inc. | 0.00 | -39.10 | 0.11 | -51.14 | 0.4130 | -0.4528 | |||
| OGN / Organon & Co. | 0.01 | 0.00 | 0.09 | -35.29 | 0.3401 | -0.1979 | |||
| VSTS / Vestis Corporation | 0.01 | 0.00 | 0.08 | -42.47 | 0.3251 | -0.2525 | |||
| ASH / Ashland Inc. | 0.00 | -47.26 | 0.07 | -55.48 | 0.2517 | -0.3269 | |||
| SEG / Seaport Entertainment Group Inc. | 0.00 | 476.70 | 0.06 | 400.00 | 0.2121 | 0.1686 | |||
| ELIWQ / Electriq Power Holdings, Inc. - Equity Warrant | 0.01 | 0.00 | 0.00 | 0.0000 | 0.0000 |