Statistik Asas
| Profil Orang Dalam | KKR Credit Advisors (US) LLC |
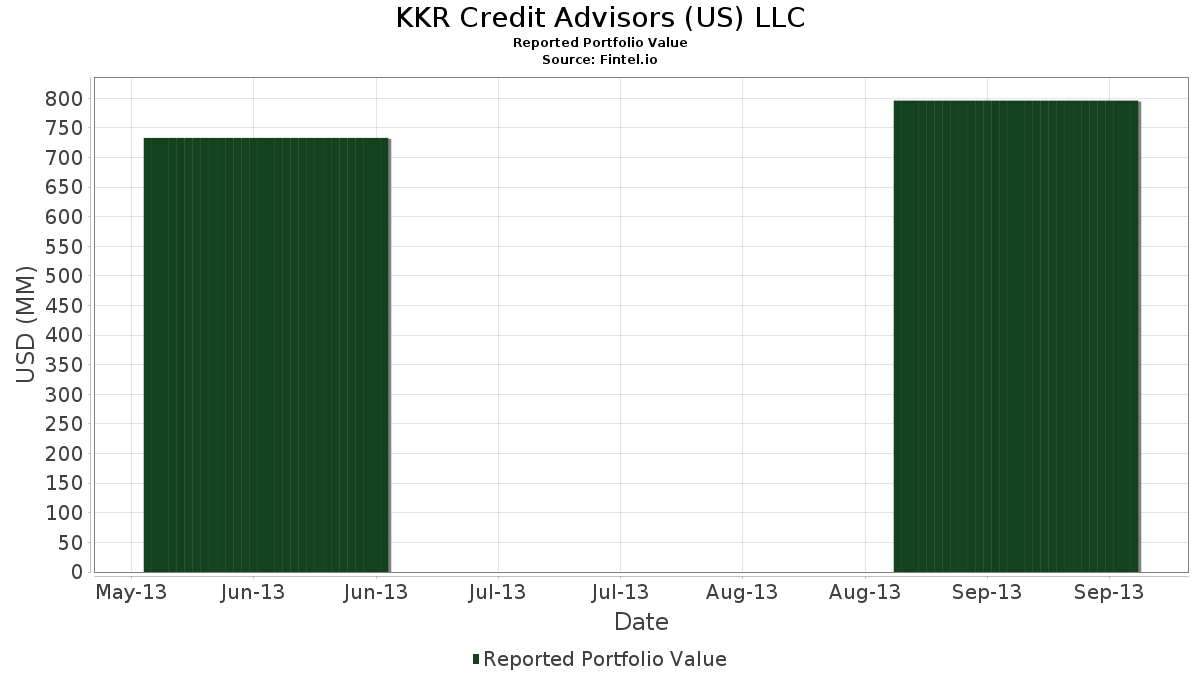
| Nilai Portfolio | $ 796,306,000 |
| Kedudukan Semasa | 63 |
Pegangan Terkini, Prestasi, AUM (dari 13F, 13D)
KKR Credit Advisors (US) LLC telah mendedahkan 63 jumlah pegangan dalam pemfailan SEC terkini mereka. Nilai portfolio terkini dikira sebagai $ 796,306,000 USD. Aset Sebenar Di Bawah Pengurusan (AUM) ialah nilai ini ditambah dengan tunai (yang tidak didedahkan). Pegangan teratas KKR Credit Advisors (US) LLC ialah Masonite International Corporation (US:DOOR) , Amedisys, Inc. (US:AMED) , Verint Systems Inc. (US:VRNT) , Wyndham Destinations, Inc. (US:) , and Comcast Corporation (US:CMCSA) . Kedudukan baharu KKR Credit Advisors (US) LLC termasuk Masonite International Corporation (US:DOOR) , Wyndham Destinations, Inc. (US:) , Lamar Advertising Company (US:LAMR) , Cameron International Corporation (US:CAM) , and Stillwater Mining Company (US:SWC) .
Kenaikan Teratas Suku Tahun Ini
Kami menggunakan perubahan dalam peruntukan portfolio kerana ini adalah metrik yang paling bermakna. Perubahan boleh disebabkan oleh perdagangan atau perubahan dalam harga saham.
| Sekuriti | Saham (MM) |
Nilai (MM$) |
Portfolio % | ΔPortfolio % |
|---|---|---|---|---|
| 1.24 | 60.54 | 7.6021 | 7.6021 | |
| 2.92 | 50.21 | 6.3056 | 5.1007 | |
| 0.78 | 28.97 | 3.6378 | 3.6378 | |
| 0.47 | 28.66 | 3.5986 | 3.5986 | |
| 0.52 | 22.37 | 2.8096 | 2.8096 | |
| 0.45 | 21.16 | 2.6578 | 2.6578 | |
| 0.12 | 19.45 | 2.4420 | 2.4420 | |
| 0.33 | 19.09 | 2.3969 | 2.3969 | |
| 0.02 | 18.66 | 2.3429 | 2.3429 | |
| 1.67 | 18.38 | 2.3077 | 2.3077 |
Penurunan Teratas Suku Tahun Ini
Kami menggunakan perubahan dalam peruntukan portfolio kerana ini adalah metrik yang paling bermakna. Perubahan boleh disebabkan oleh perdagangan atau perubahan dalam harga saham.
| Sekuriti | Saham (MM) |
Nilai (MM$) |
Portfolio % | ΔPortfolio % |
|---|---|---|---|---|
| 0.00 | 0.00 | -2.4618 | ||
| 0.00 | 0.00 | -2.1002 | ||
| 0.00 | 0.00 | -2.0120 | ||
| 0.00 | 0.00 | -1.9392 | ||
| 0.00 | 0.00 | -1.3642 | ||
| 0.00 | 0.00 | -0.9732 | ||
| 0.11 | 9.44 | 1.1851 | -0.7655 | |
| 0.00 | 0.00 | -0.3220 | ||
| 0.00 | 0.00 | -0.0803 | ||
| 0.33 | 15.33 | 1.9254 | -0.0374 |
13F dan Pemfailan Dana
Borang ini telah difailkan pada 2013-11-14 untuk tempoh pelaporan 2013-09-30. Klik ikon pautan untuk melihat sejarah transaksi penuh.
Tingkatkan untuk membuka data premium dan eksport ke Excel ![]() .
.
| Sekuriti | Jenis | Purata Harga Saham | Saham (MM) |
ΔSaham (%) |
ΔSaham (%) |
Nilai ($MM) |
Portfolio (%) |
ΔPortfolio (%) |
|
|---|---|---|---|---|---|---|---|---|---|
| DOOR / Masonite International Corporation | 1.24 | 60.54 | 7.6021 | 7.6021 | |||||
| AMED / Amedisys, Inc. | 2.92 | 283.52 | 50.21 | 468.33 | 6.3056 | 5.1007 | |||
| VRNT / Verint Systems Inc. | 0.78 | -52.51 | 28.97 | -50.39 | 3.6378 | 3.6378 | |||
| / Wyndham Destinations, Inc. | 0.47 | 28.66 | 3.5986 | 3.5986 | |||||
| CMCSA / Comcast Corporation | 0.54 | 55.88 | 24.45 | 68.45 | 3.0707 | 1.0910 | |||
| CIT / CIT Group Inc | 0.49 | 8.92 | 23.95 | 13.91 | 3.0071 | 0.1403 | |||
| RLGY / Realogy Holdings Corp | 0.52 | 31.06 | 22.37 | 17.37 | 2.8096 | 2.8096 | |||
| LAMR / Lamar Advertising Company | Call | 0.45 | 21.16 | 2.6578 | 2.6578 | ||||
| GM / General Motors Company | 0.59 | 0.00 | 21.16 | 7.98 | 2.6566 | -0.0151 | |||
| COMVERSE INC / (20585P105) | 0.62 | 19.70 | 0.0000 | ||||||
| PPG / PPG Industries, Inc. | 0.12 | -13.39 | 19.45 | -1.18 | 2.4420 | 2.4420 | |||
| PTEN / Patterson-UTI Energy, Inc. | 0.90 | 227.86 | 19.22 | 262.18 | 2.4138 | 1.6900 | |||
| ENB / Enbridge Inc. | 0.46 | 16.57 | 19.20 | 15.66 | 2.4111 | 0.1471 | |||
| CAM / Cameron International Corporation | 0.33 | 19.09 | 2.3969 | 2.3969 | |||||
| GOOGL / Alphabet Inc. | 0.02 | -0.47 | 18.66 | -0.97 | 2.3429 | 2.3429 | |||
| SWC / Stillwater Mining Company | 1.67 | 18.38 | 2.3077 | 2.3077 | |||||
| UNP / Union Pacific Corporation | 0.12 | 92.68 | 17.99 | 94.00 | 2.2589 | 0.9944 | |||
| APD / Air Products and Chemicals, Inc. | 0.15 | 15.68 | 1.9686 | 1.9686 | |||||
| NWSA / News Corporation | 0.97 | 229.39 | 15.66 | 246.90 | 1.9665 | 1.3508 | |||
| LAMR / Lamar Advertising Company | 0.33 | -1.72 | 15.33 | 6.53 | 1.9254 | -0.0374 | |||
| ITT / ITT Inc. | 0.41 | 14.56 | 1.8284 | 1.8284 | |||||
| FDX / FedEx Corporation | 0.13 | 14.44 | 1.8127 | 1.8127 | |||||
| EBAY / eBay Inc. | 0.26 | -54.62 | 14.26 | -51.04 | 1.7903 | 1.7903 | |||
| PCP / Precision Castparts Corporation | 0.06 | -1.90 | 14.09 | -1.37 | 1.7693 | 1.7693 | |||
| HAL / Halliburton Company | 0.29 | 165.08 | 13.96 | 205.96 | 1.7536 | 1.1312 | |||
| BEAM / Beam Therapeutics Inc. | 0.20 | -9.24 | 12.99 | -7.03 | 1.6319 | 1.6319 | |||
| EXP / Eagle Materials Inc. | 0.17 | -35.41 | 12.48 | -29.29 | 1.5671 | 1.5671 | |||
| HES / Hess Corporation | 0.15 | -30.27 | 11.92 | -18.89 | 1.4967 | 1.4967 | |||
| MDLZ / Mondelez International, Inc. | 0.37 | 11.69 | 1.4679 | 1.4679 | |||||
| XLV / The Select Sector SPDR Trust - The Health Care Select Sector SPDR Fund | 0.23 | -16.44 | 11.65 | -11.20 | 1.4631 | 1.4631 | |||
| MS / Morgan Stanley | 0.40 | 10.72 | 1.3463 | 1.3463 | |||||
| EMC / Global X Funds - Global X Emerging Markets Great Consumer ETF | 0.42 | 25.75 | 10.68 | 36.08 | 1.3417 | 0.2710 | |||
| CX / CEMEX, S.A.B. de C.V. - Depositary Receipt (Common Stock) | 0.94 | 10.51 | 1.3197 | 1.3197 | |||||
| AAP / Advance Auto Parts, Inc. | 0.12 | 9.91 | 1.2449 | 1.2449 | |||||
| EOG / EOG Resources, Inc. | 0.06 | -35.59 | 9.84 | -17.20 | 1.2351 | 1.2351 | |||
| ETN / Eaton Corporation plc | 0.14 | 9.78 | 1.2275 | 1.2275 | |||||
| HD / The Home Depot, Inc. | 0.13 | -27.09 | 9.51 | -28.62 | 1.1945 | 1.1945 | |||
| WBC / Wabco Holdings, Inc. | 0.11 | -41.51 | 9.44 | -34.02 | 1.1851 | -0.7655 | |||
| OMC / Omnicom Group Inc. | 0.15 | 9.27 | 1.1640 | 1.1640 | |||||
| VSI / Vitamin Shoppe, Inc. | 0.21 | 308.31 | 9.11 | 298.34 | 1.1440 | 0.8321 | |||
| GM.WS.A / General Motors Company | 0.31 | 0.00 | 8.25 | 10.08 | 1.0365 | 1.0365 | |||
| BEAV / B/E Aerospace, Inc. | 0.10 | -55.90 | 7.28 | -48.39 | 0.9141 | 0.9141 | |||
| JAH / Jarden Corporation | 0.15 | 7.26 | 0.9117 | 0.9117 | |||||
| RLGY / Realogy Holdings Corp | Call | 0.16 | 6.88 | 0.8644 | 0.8644 | ||||
| TWC / Spectrum Management Holding Company LLC | 0.06 | -59.34 | 6.88 | -59.66 | 0.8634 | 0.8634 | |||
| PRU / Prudential Financial, Inc. | 0.08 | 6.54 | 0.8217 | 0.8217 | |||||
| MET / MetLife, Inc. | 0.14 | 6.54 | 0.8213 | 0.8213 | |||||
| GM.WS.B / General Motors Company - Warrants 07/10/2019 | 0.31 | 0.00 | 5.81 | 13.76 | 0.7297 | 0.7297 | |||
| HP / Helmerich & Payne, Inc. | 0.05 | 3.72 | 0.4675 | 0.4675 | |||||
| BHI / Baker Hughes Inc. | 0.07 | -26.83 | 3.68 | -22.10 | 0.4625 | 0.4625 | |||
| PM / Philip Morris International Inc. | 0.04 | 3.55 | 0.4458 | 0.4458 | |||||
| / Wyndham Destinations, Inc. | 0.18 | 3.54 | 0.4444 | 0.4444 | |||||
| US20605P1012 / Concho Resources, Inc. | 0.03 | 3.11 | 0.3908 | 0.3908 | |||||
| GTIV / Gentiva Health Services Inc | 0.19 | 2.24 | 0.2812 | 0.2812 | |||||
| JO / Barclays Bank PLC - ZC SP ETN REDEEM 23/01/2048 USD 50 - Ser B_BJO | 0.08 | 2.07 | 0.2603 | 0.2603 | |||||
| ATHL / | 0.04 | 1.42 | 0.1782 | 0.1782 | |||||
| EWZ / iShares, Inc. - iShares MSCI Brazil ETF | 0.03 | 1.32 | 0.1660 | 0.1660 | |||||
| LPI / Laredo Petroleum Inc. | 0.04 | 1.21 | 0.1525 | 0.1525 | |||||
| XEC / Cimarex Energy Co. | 0.01 | 1.20 | 0.1501 | 0.1501 | |||||
| EWW / iShares, Inc. - iShares MSCI Mexico ETF | 0.02 | 1.17 | 0.1468 | 0.1468 | |||||
| GLDD / Great Lakes Dredge & Dock Corporation | 0.12 | 0.00 | 0.85 | -5.12 | 0.1071 | 0.1071 | |||
| ESSX / Essex Rental Corp. | 0.20 | 0.70 | 0.0874 | 0.0874 | |||||
| AGO / Assured Guaranty Ltd. | 0.03 | 0.47 | 0.0593 | 0.0593 | |||||
| TPR / Tapestry, Inc. | Put | 0.00 | -100.00 | 0.00 | -100.00 | -0.9732 | |||
| IP / International Paper Company | 0.00 | -100.00 | 0.00 | -100.00 | 0.0000 | 0.0000 | |||
| SPB / Spectrum Brands Holdings, Inc. | 0.00 | -100.00 | 0.00 | -100.00 | 0.0000 | 0.0000 | |||
| QCOM / QUALCOMM Incorporated | 0.00 | -100.00 | 0.00 | -100.00 | 0.0000 | 0.0000 | |||
| CVC / Cablevision Systems Corp. | 0.00 | -100.00 | 0.00 | -100.00 | -0.0803 | ||||
| XHB / SPDR Series Trust - SPDR S&P Homebuilders ETF | Call | 0.00 | -100.00 | 0.00 | -100.00 | 0.0000 | 0.0000 | ||
| EVTC / EVERTEC, Inc. | 0.00 | -100.00 | 0.00 | -100.00 | 0.0000 | ||||
| XLF / The Select Sector SPDR Trust - The Financial Select Sector SPDR Fund | 0.00 | -100.00 | 0.00 | -100.00 | -2.4618 | ||||
| MA / Mastercard Incorporated | 0.00 | -100.00 | 0.00 | -100.00 | 0.0000 | 0.0000 | |||
| SWN / Southwestern Energy Company | 0.00 | -100.00 | 0.00 | -100.00 | 0.0000 | ||||
| EQIX / Equinix, Inc. | 0.00 | -100.00 | 0.00 | -100.00 | 0.0000 | 0.0000 | |||
| COST / Costco Wholesale Corporation | 0.00 | -100.00 | 0.00 | -100.00 | -1.9392 | ||||
| TSCO / Tractor Supply Company | 0.00 | -100.00 | 0.00 | -100.00 | -1.3642 | ||||
| TDG / TransDigm Group Incorporated | 0.00 | -100.00 | 0.00 | -100.00 | 0.0000 | ||||
| 00B65Z9D7 / Noble Corporation plc | 0.00 | -100.00 | 0.00 | -100.00 | 0.0000 | ||||
| CSCO / Cisco Systems, Inc. | Call | 0.00 | -100.00 | 0.00 | -100.00 | 0.0000 | |||
| V / Visa Inc. | 0.00 | -100.00 | 0.00 | -100.00 | 0.0000 | 0.0000 | |||
| WMB / The Williams Companies, Inc. | 0.00 | -100.00 | 0.00 | -100.00 | 0.0000 | ||||
| WMB / The Williams Companies, Inc. | Call | 0.00 | -100.00 | 0.00 | -100.00 | 0.0000 | |||
| CSCO / Cisco Systems, Inc. | 0.00 | -100.00 | 0.00 | -100.00 | 0.0000 | ||||
| PLCMP0000017 / Comp SA | 0.00 | -100.00 | 0.00 | -100.00 | -0.3220 | ||||
| AMT / American Tower Corporation | 0.00 | -100.00 | 0.00 | -100.00 | 0.0000 | ||||
| PLCMP0000017 / Comp SA | Call | 0.00 | -100.00 | 0.00 | -100.00 | -2.0120 | |||
| SHW / The Sherwin-Williams Company | Call | 0.00 | -100.00 | 0.00 | -100.00 | 0.0000 | 0.0000 | ||
| LOW / Lowe's Companies, Inc. | Call | 0.00 | -100.00 | 0.00 | -100.00 | 0.0000 | 0.0000 | ||
| LOW / Lowe's Companies, Inc. | 0.00 | -100.00 | 0.00 | -100.00 | 0.0000 | 0.0000 | |||
| AAPL / Apple Inc. | 0.00 | -100.00 | 0.00 | -100.00 | 0.0000 | 0.0000 | |||
| EEM / iShares, Inc. - iShares MSCI Emerging Markets ETF | Call | 0.00 | -100.00 | 0.00 | -100.00 | -2.1002 | |||
| AEO / American Eagle Outfitters, Inc. | 0.00 | -100.00 | 0.00 | -100.00 | 0.0000 | 0.0000 |