Statistik Asas
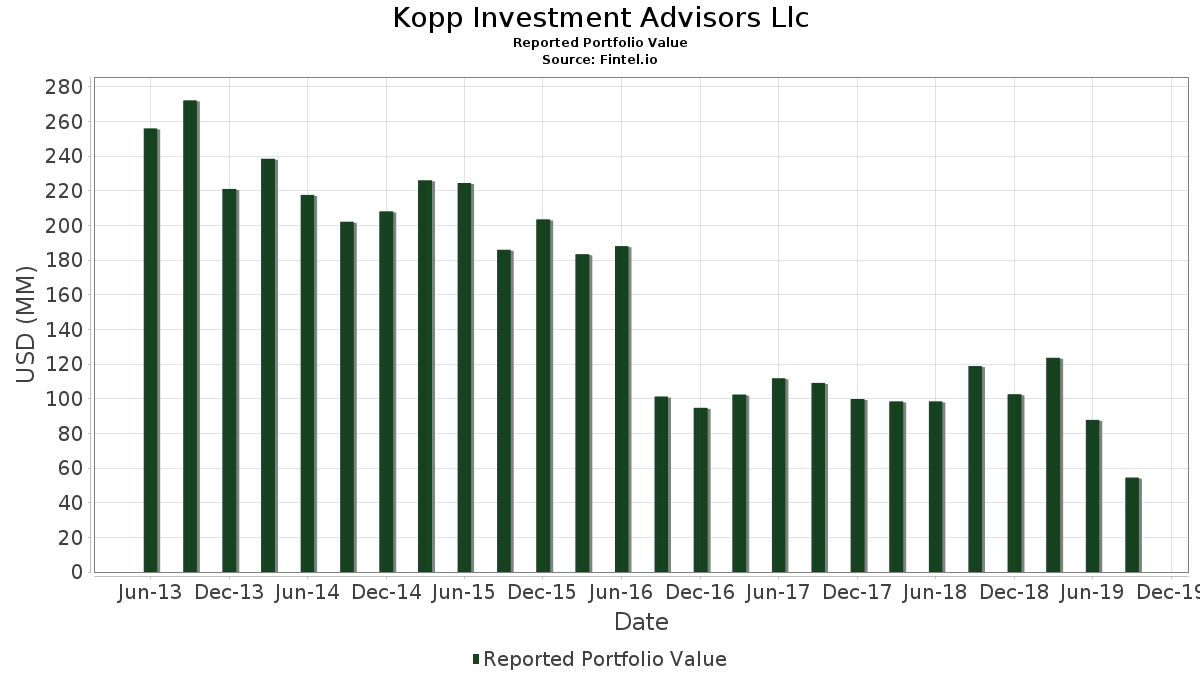
| Nilai Portfolio | $ 54,418,000 |
| Kedudukan Semasa | 45 |
Pegangan Terkini, Prestasi, AUM (dari 13F, 13D)
Kopp Investment Advisors Llc telah mendedahkan 45 jumlah pegangan dalam pemfailan SEC terkini mereka. Nilai portfolio terkini dikira sebagai $ 54,418,000 USD. Aset Sebenar Di Bawah Pengurusan (AUM) ialah nilai ini ditambah dengan tunai (yang tidak didedahkan). Pegangan teratas Kopp Investment Advisors Llc ialah NeoGenomics, Inc. (US:NEO) , Insulet Corporation (US:PODD) , Twilio Inc. (US:TWLO) , Cypress Semiconductor Corp. (US:CY) , and Vericel Corporation (US:VCEL) .
Kenaikan Teratas Suku Tahun Ini
Kami menggunakan perubahan dalam peruntukan portfolio kerana ini adalah metrik yang paling bermakna. Perubahan boleh disebabkan oleh perdagangan atau perubahan dalam harga saham.
| Sekuriti | Saham (MM) |
Nilai (MM$) |
Portfolio % | ΔPortfolio % |
|---|---|---|---|---|
| 0.02 | 3.95 | 7.2531 | 2.8155 | |
| 0.00 | 1.01 | 1.8487 | 0.8358 | |
| 0.10 | 2.85 | 5.2280 | 0.7836 | |
| 0.00 | 1.23 | 2.2640 | 0.7783 | |
| 0.16 | 3.72 | 6.8396 | 0.5427 | |
| 0.01 | 0.67 | 1.2330 | 0.5005 | |
| 0.00 | 0.65 | 1.1889 | 0.4598 | |
| 0.00 | 0.57 | 1.0548 | 0.4054 | |
| 0.01 | 0.59 | 1.0916 | 0.3943 | |
| 0.01 | 0.56 | 1.0383 | 0.3911 |
Penurunan Teratas Suku Tahun Ini
Kami menggunakan perubahan dalam peruntukan portfolio kerana ini adalah metrik yang paling bermakna. Perubahan boleh disebabkan oleh perdagangan atau perubahan dalam harga saham.
| Sekuriti | Saham (MM) |
Nilai (MM$) |
Portfolio % | ΔPortfolio % |
|---|---|---|---|---|
| 0.00 | 0.00 | -2.6933 | ||
| 0.07 | 1.15 | 2.1059 | -1.3405 | |
| 0.42 | 1.18 | 2.1758 | -1.3219 | |
| 0.20 | 3.00 | 5.5202 | -1.3043 | |
| 0.07 | 2.46 | 4.5187 | -1.2189 | |
| 0.02 | 2.30 | 4.2265 | -1.2182 | |
| 0.21 | 3.97 | 7.3009 | -0.8839 | |
| 0.03 | 3.77 | 6.9242 | -0.6944 | |
| 0.03 | 2.21 | 4.0667 | -0.6797 | |
| 0.09 | 2.19 | 4.0244 | -0.5545 |
13F dan Pemfailan Dana
Borang ini telah difailkan pada 2019-11-14 untuk tempoh pelaporan 2019-09-30. Klik ikon pautan untuk melihat sejarah transaksi penuh.
Tingkatkan untuk membuka data premium dan eksport ke Excel ![]() .
.
| Sekuriti | Jenis | Purata Harga Saham | Saham (MM) |
ΔSaham (%) |
ΔSaham (%) |
Nilai ($MM) |
Portfolio (%) |
ΔPortfolio (%) |
|
|---|---|---|---|---|---|---|---|---|---|
| NEO / NeoGenomics, Inc. | 0.21 | -36.54 | 3.97 | -44.70 | 7.3009 | -0.8839 | |||
| PODD / Insulet Corporation | 0.02 | -26.65 | 3.95 | 1.34 | 7.2531 | 2.8155 | |||
| TWLO / Twilio Inc. | 0.03 | -30.14 | 3.77 | -43.65 | 6.9242 | -0.6944 | |||
| CY / Cypress Semiconductor Corp. | 0.16 | -35.83 | 3.72 | -32.66 | 6.8396 | 0.5427 | |||
| VCEL / Vericel Corporation | 0.20 | -37.41 | 3.00 | -49.85 | 5.5202 | -1.3043 | |||
| HZNP / Horizon Therapeutics Plc | 0.10 | -35.57 | 2.85 | -27.07 | 5.2280 | 0.7836 | |||
| UPLD / Upland Software, Inc. | 0.07 | -36.23 | 2.46 | -51.17 | 4.5187 | -1.2189 | |||
| FIVN / Five9, Inc. | 0.04 | -37.12 | 2.39 | -34.12 | 4.3846 | 0.2580 | |||
| CYBR / CyberArk Software Ltd. | 0.02 | -38.36 | 2.30 | -51.87 | 4.2265 | -1.2182 | |||
| OMCL / Omnicell, Inc. | 0.03 | -36.78 | 2.21 | -46.88 | 4.0667 | -0.6797 | |||
| ATRC / AtriCure, Inc. | 0.09 | -34.81 | 2.19 | -45.51 | 4.0244 | -0.5545 | |||
| MXL / MaxLinear, Inc. | 0.09 | -38.49 | 2.00 | -41.27 | 3.6734 | -0.2048 | |||
| SUPN / Supernus Pharmaceuticals, Inc. | 0.05 | -36.09 | 1.36 | -46.93 | 2.4973 | -0.4205 | |||
| SPY / SPDR S&P 500 ETF | 0.00 | -6.74 | 1.23 | -5.52 | 2.2640 | 0.7783 | |||
| US74975N1054 / RTI Surgical, Inc. | 0.42 | -42.47 | 1.18 | -61.43 | 2.1758 | -1.3219 | |||
| CVLT / Commvault Systems, Inc. | 0.03 | -38.45 | 1.16 | -44.53 | 2.1335 | -0.2511 | |||
| XENT / Intersect ENT Inc | 0.07 | -49.30 | 1.15 | -62.12 | 2.1059 | -1.3405 | |||
| LGND / Ligand Pharmaceuticals Incorporated | 0.01 | -25.84 | 1.05 | -35.32 | 1.9350 | 0.0802 | |||
| AAPL / Apple Inc. | 0.00 | 0.00 | 1.01 | 13.16 | 1.8487 | 0.8358 | |||
| PG / The Procter & Gamble Company | 0.01 | -8.05 | 0.67 | 4.35 | 1.2330 | 0.5005 | |||
| QQQ / Invesco QQQ Trust, Series 1 | 0.00 | 0.00 | 0.65 | 1.09 | 1.1889 | 0.4598 | |||
| AFL / Aflac Incorporated | 0.01 | -7.06 | 0.62 | -11.27 | 1.1430 | 0.3443 | |||
| MAR / Marriott International, Inc. | 0.00 | -7.35 | 0.61 | -17.84 | 1.1173 | 0.2742 | |||
| JPM / JPMorgan Chase & Co. | 0.01 | -7.81 | 0.59 | -2.94 | 1.0916 | 0.3943 | |||
| VTI / Vanguard Index Funds - Vanguard Total Stock Market ETF | 0.00 | 0.00 | 0.57 | 0.70 | 1.0548 | 0.4054 | |||
| LUV / Southwest Airlines Co. | 0.01 | -6.44 | 0.56 | -0.53 | 1.0383 | 0.3911 | |||
| AXP / American Express Company | 0.00 | -6.58 | 0.54 | -10.40 | 0.9978 | 0.3074 | |||
| VFC / V.F. Corporation | 0.01 | -7.42 | 0.54 | -5.61 | 0.9886 | 0.3392 | |||
| ECL / Ecolab Inc. | 0.00 | -8.25 | 0.52 | -7.94 | 0.9592 | 0.3132 | |||
| CMI / Cummins Inc. | 0.00 | -7.25 | 0.49 | -12.08 | 0.9096 | 0.2682 | |||
| MMM / 3M Company | 0.00 | -5.76 | 0.49 | -10.64 | 0.8949 | 0.2740 | |||
| VZ / Verizon Communications Inc. | 0.01 | -6.88 | 0.48 | -1.64 | 0.8802 | 0.3254 | |||
| EXC / Exelon Corporation | 0.01 | -8.55 | 0.45 | -7.80 | 0.8251 | 0.2702 | |||
| JNJ / Johnson & Johnson | 0.00 | -7.67 | 0.45 | -14.20 | 0.8214 | 0.2278 | |||
| TROW / T. Rowe Price Group, Inc. | 0.00 | -8.00 | 0.43 | -4.22 | 0.7920 | 0.2793 | |||
| TJX / The TJX Companies, Inc. | 0.01 | -8.80 | 0.38 | -3.81 | 0.6965 | 0.2476 | |||
| VLO / Valero Energy Corporation | 0.00 | -7.79 | 0.37 | -8.23 | 0.6762 | 0.2194 | |||
| VCSH / Vanguard Scottsdale Funds - Vanguard Short-Term Corporate Bond ETF | 0.00 | 0.00 | 0.35 | 0.58 | 0.6413 | 0.2460 | |||
| CVX / Chevron Corporation | 0.00 | -7.18 | 0.32 | -11.48 | 0.5807 | 0.1740 | |||
| VIG / Vanguard Specialized Funds - Vanguard Dividend Appreciation ETF | 0.00 | 0.00 | 0.29 | 3.99 | 0.5274 | 0.2129 | |||
| IWO / iShares Trust - iShares Russell 2000 Growth ETF | 0.00 | 0.00 | 0.23 | -4.13 | 0.4263 | 0.1506 | |||
| MSFT / Microsoft Corporation | 0.00 | -11.40 | 0.23 | -8.00 | 0.4227 | 0.1378 | |||
| INTC / Intel Corporation | 0.00 | -6.22 | 0.22 | 0.93 | 0.4006 | 0.1545 | |||
| SBUX / Starbucks Corporation | 0.00 | -6.91 | 0.21 | -1.84 | 0.3914 | 0.1442 | |||
| DIS / The Walt Disney Company | 0.00 | -7.83 | 0.21 | -14.11 | 0.3804 | 0.1058 | |||
| TECH / Bio-Techne Corporation | 0.00 | -100.00 | 0.00 | -100.00 | -0.4751 | ||||
| FNSR / Finisar Corporation | 0.00 | -100.00 | 0.00 | -100.00 | -2.6933 |