Statistik Asas
| Nilai Portfolio | $ 528,893 |
| Kedudukan Semasa | 83 |
Pegangan Terkini, Prestasi, AUM (dari 13F, 13D)
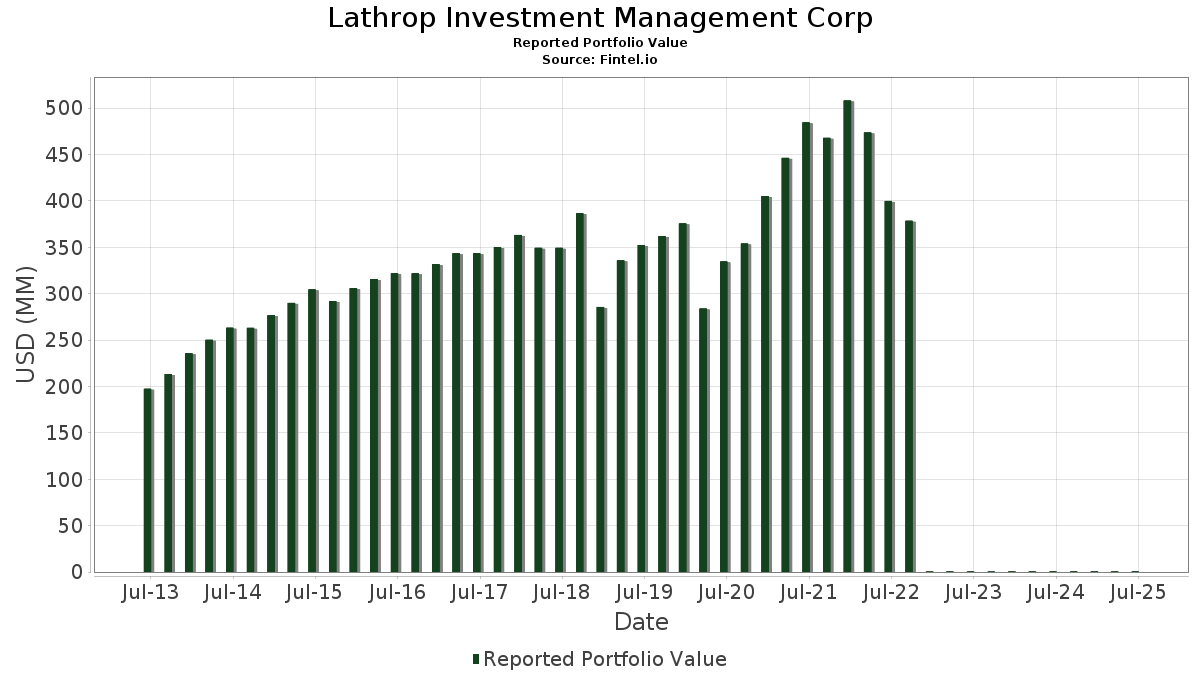
Lathrop Investment Management Corp telah mendedahkan 83 jumlah pegangan dalam pemfailan SEC terkini mereka. Nilai portfolio terkini dikira sebagai $ 528,893 USD. Aset Sebenar Di Bawah Pengurusan (AUM) ialah nilai ini ditambah dengan tunai (yang tidak didedahkan). Pegangan teratas Lathrop Investment Management Corp ialah Walmart Inc. (US:WMT) , Microsoft Corporation (US:MSFT) , Kinder Morgan, Inc. (US:KMI) , Labcorp Holdings Inc. (US:LH) , and Stryker Corporation (US:SYK) . Kedudukan baharu Lathrop Investment Management Corp termasuk Marsh & McLennan Companies, Inc. (US:MMC) , EMCOR Group, Inc. (US:EME) , GE Vernova Inc. (US:GEV) , .
Kenaikan Teratas Suku Tahun Ini
Kami menggunakan perubahan dalam peruntukan portfolio kerana ini adalah metrik yang paling bermakna. Perubahan boleh disebabkan oleh perdagangan atau perubahan dalam harga saham.
| Sekuriti | Saham (MM) |
Nilai (MM$) |
Portfolio % | ΔPortfolio % |
|---|---|---|---|---|
| 0.04 | 0.01 | 2.1048 | 1.8043 | |
| 0.04 | 0.01 | 1.4661 | 1.4661 | |
| 0.05 | 0.03 | 4.9917 | 0.8892 | |
| 0.06 | 0.01 | 2.5173 | 0.8004 | |
| 0.15 | 0.02 | 2.9505 | 0.4589 | |
| 0.13 | 0.02 | 2.9770 | 0.4272 | |
| 0.04 | 0.01 | 2.2729 | 0.2923 | |
| 0.03 | 0.02 | 3.3487 | 0.2566 | |
| 0.07 | 0.02 | 3.0987 | 0.2504 | |
| 0.02 | 0.00 | 0.6222 | 0.2050 |
Penurunan Teratas Suku Tahun Ini
Kami menggunakan perubahan dalam peruntukan portfolio kerana ini adalah metrik yang paling bermakna. Perubahan boleh disebabkan oleh perdagangan atau perubahan dalam harga saham.
| Sekuriti | Saham (MM) |
Nilai (MM$) |
Portfolio % | ΔPortfolio % |
|---|---|---|---|---|
| 0.03 | 0.00 | 0.8469 | -1.2645 | |
| 0.07 | 0.01 | 2.7172 | -1.1561 | |
| 0.03 | 0.01 | 2.2617 | -0.5698 | |
| 0.05 | 0.01 | 2.4296 | -0.4697 | |
| 0.19 | 0.01 | 1.1880 | -0.4162 | |
| 0.02 | 0.00 | 0.3080 | -0.4042 | |
| 0.05 | 0.00 | 0.8762 | -0.3559 | |
| 0.11 | 0.01 | 2.1796 | -0.2528 | |
| 0.18 | 0.02 | 2.9488 | -0.2368 | |
| 0.01 | 0.00 | 0.8357 | -0.2347 |
13F dan Pemfailan Dana
Borang ini telah difailkan pada 2025-08-04 untuk tempoh pelaporan 2025-06-30. Klik ikon pautan untuk melihat sejarah transaksi penuh.
Tingkatkan untuk membuka data premium dan eksport ke Excel ![]() .
.
| Sekuriti | Jenis | Purata Harga Saham | Saham (MM) |
ΔSaham (%) |
ΔSaham (%) |
Nilai ($MM) |
Portfolio (%) |
ΔPortfolio (%) |
|
|---|---|---|---|---|---|---|---|---|---|
| WMT / Walmart Inc. | 0.27 | -3.22 | 0.03 | 8.33 | 5.0763 | 0.1327 | |||
| MSFT / Microsoft Corporation | 0.05 | -3.60 | 0.03 | 30.00 | 4.9917 | 0.8892 | |||
| KMI / Kinder Morgan, Inc. | 0.64 | -2.41 | 0.02 | 0.00 | 3.5417 | -0.1555 | |||
| LH / Labcorp Holdings Inc. | 0.07 | -1.59 | 0.02 | 12.50 | 3.4525 | 0.1871 | |||
| SYK / Stryker Corporation | 0.05 | -3.03 | 0.02 | 0.00 | 3.3899 | -0.0632 | |||
| RTX / RTX Corporation | 0.12 | -1.43 | 0.02 | 6.25 | 3.3663 | 0.1138 | |||
| MLM / Martin Marietta Materials, Inc. | 0.03 | -0.98 | 0.02 | 13.33 | 3.3487 | 0.2566 | |||
| SCHW / The Charles Schwab Corporation | 0.19 | -5.66 | 0.02 | 13.33 | 3.2615 | 0.1478 | |||
| J / Jacobs Solutions Inc. | 0.13 | 0.45 | 0.02 | 6.67 | 3.2052 | 0.1246 | |||
| ADI / Analog Devices, Inc. | 0.07 | -3.24 | 0.02 | 14.29 | 3.0987 | 0.2504 | |||
| SONY / Sony Group Corporation - Depositary Receipt (Common Stock) | 0.63 | -3.11 | 0.02 | 0.00 | 3.0908 | -0.1760 | |||
| CSCO / Cisco Systems, Inc. | 0.23 | -6.71 | 0.02 | 0.00 | 2.9959 | -0.0029 | |||
| DIS / The Walt Disney Company | 0.13 | -2.45 | 0.02 | 25.00 | 2.9770 | 0.4272 | |||
| KEX / Kirby Corporation | 0.14 | -3.98 | 0.02 | 7.14 | 2.9567 | 0.0776 | |||
| JCI / Johnson Controls International plc | 0.15 | -5.71 | 0.02 | 25.00 | 2.9505 | 0.4589 | |||
| ALC / Alcon Inc. | 0.18 | 4.49 | 0.02 | -6.25 | 2.9488 | -0.2368 | |||
| AYI / Acuity Inc. | 0.05 | -9.65 | 0.02 | 0.00 | 2.9119 | -0.0747 | |||
| AAPL / Apple Inc. | 0.07 | -20.27 | 0.01 | -26.32 | 2.7172 | -1.1561 | |||
| MKL / Markel Group Inc. | 0.01 | -5.39 | 0.01 | 0.00 | 2.7066 | -0.1044 | |||
| HD / The Home Depot, Inc. | 0.04 | -2.76 | 0.01 | 0.00 | 2.5674 | -0.2031 | |||
| ORCL / Oracle Corporation | 0.06 | -1.57 | 0.01 | 62.50 | 2.5173 | 0.8004 | |||
| ITW / Illinois Tool Works Inc. | 0.05 | -11.76 | 0.01 | -14.29 | 2.4296 | -0.4697 | |||
| IBM / International Business Machines Corporation | 0.04 | 1.62 | 0.01 | 33.33 | 2.2729 | 0.2923 | |||
| TMO / Thermo Fisher Scientific Inc. | 0.03 | 2.91 | 0.01 | -21.43 | 2.2617 | -0.5698 | |||
| XOM / Exxon Mobil Corporation | 0.11 | 3.78 | 0.01 | -8.33 | 2.1796 | -0.2528 | |||
| JPM / JPMorgan Chase & Co. | 0.04 | 522.02 | 0.01 | 1,000.00 | 2.1048 | 1.8043 | |||
| ADBE / Adobe Inc. | 0.03 | 2.78 | 0.01 | 11.11 | 1.9416 | -0.0244 | |||
| MMC / Marsh & McLennan Companies, Inc. | 0.04 | 0.01 | 1.4661 | 1.4661 | |||||
| NKE / NIKE, Inc. | 0.10 | 6.66 | 0.01 | 40.00 | 1.3422 | 0.1616 | |||
| GE / General Electric Company | 0.03 | -5.14 | 0.01 | 20.00 | 1.3120 | 0.1830 | |||
| SLB / Schlumberger Limited | 0.19 | -3.85 | 0.01 | -25.00 | 1.1880 | -0.4162 | |||
| CVS / CVS Health Corporation | 0.08 | -2.73 | 0.01 | 0.00 | 1.1034 | -0.0663 | |||
| TER / Teradyne, Inc. | 0.06 | -20.58 | 0.01 | -16.67 | 0.9994 | -0.2141 | |||
| DHR / Danaher Corporation | 0.02 | 6.98 | 0.00 | 0.00 | 0.9181 | -0.0169 | |||
| BRK.B / Berkshire Hathaway Inc. | 0.01 | 0.05 | 0.00 | -20.00 | 0.9059 | -0.1362 | |||
| UPS / United Parcel Service, Inc. | 0.05 | -18.66 | 0.00 | -33.33 | 0.8762 | -0.3559 | |||
| CFR / Cullen/Frost Bankers, Inc. | 0.03 | -58.98 | 0.00 | -60.00 | 0.8469 | -1.2645 | |||
| ACN / Accenture plc | 0.01 | -14.44 | 0.00 | -20.00 | 0.8357 | -0.2347 | |||
| SCHM / Schwab Strategic Trust - Schwab U.S. Mid-Cap ETF | 0.15 | -7.71 | 0.00 | 0.00 | 0.7926 | -0.0496 | |||
| NVDA / NVIDIA Corporation | 0.02 | 7.43 | 0.00 | 50.00 | 0.6222 | 0.2050 | |||
| OLO / Olo Inc. | 0.33 | 0.00 | 0.00 | 0.00 | 0.5587 | 0.1605 | |||
| SCHZ / Schwab Strategic Trust - Schwab U.S. Aggregate Bond ETF | 0.09 | 10.39 | 0.00 | 100.00 | 0.4082 | 0.0214 | |||
| PANW / Palo Alto Networks, Inc. | 0.01 | 0.00 | 0.00 | 100.00 | 0.3861 | 0.0481 | |||
| LRCX / Lam Research Corporation | 0.02 | -66.08 | 0.00 | -66.67 | 0.3080 | -0.4042 | |||
| BRK.A / Berkshire Hathaway Inc. | 0.00 | 0.00 | 0.00 | 0.00 | 0.2757 | -0.0413 | |||
| PKB / Invesco Exchange-Traded Fund Trust - Invesco Building & Construction ETF | 0.01 | 9.58 | 0.00 | 0.00 | 0.2256 | 0.0197 | |||
| SCHX / Schwab Strategic Trust - Schwab U.S. Large-Cap ETF | 0.05 | 6.98 | 0.00 | 0.2101 | 0.0239 | ||||
| AMZN / Amazon.com, Inc. | 0.00 | 0.29 | 0.00 | 0.1991 | 0.0183 | ||||
| LLY / Eli Lilly and Company | 0.00 | 6.97 | 0.00 | 0.1809 | -0.0072 | ||||
| KO / The Coca-Cola Company | 0.01 | -6.75 | 0.00 | 0.1702 | -0.0238 | ||||
| BAC / Bank of America Corporation | 0.02 | -0.88 | 0.00 | 0.1637 | 0.0109 | ||||
| ABBV / AbbVie Inc. | 0.00 | 0.00 | 0.00 | 0.1499 | -0.0277 | ||||
| CADE / Cadence Bank | 0.02 | 0.00 | 0.00 | 0.1378 | 0.0005 | ||||
| JNJ / Johnson & Johnson | 0.00 | 0.00 | 0.00 | 0.1375 | -0.0194 | ||||
| AMTM / Amentum Holdings, Inc. | 0.03 | -31.37 | 0.00 | 0.1242 | -0.0223 | ||||
| SO / The Southern Company | 0.01 | 0.00 | 0.00 | 0.1237 | -0.0064 | ||||
| ANET / Arista Networks Inc | 0.01 | 0.00 | 0.00 | 0.1082 | 0.0222 | ||||
| HOMB / Home Bancshares, Inc. (Conway, AR) | 0.02 | 0.00 | 0.00 | 0.1038 | -0.0044 | ||||
| ABT / Abbott Laboratories | 0.00 | 0.00 | 0.00 | 0.1010 | -0.0024 | ||||
| META / Meta Platforms, Inc. | 0.00 | 11.32 | 0.00 | 0.1002 | 0.0264 | ||||
| GOOGL / Alphabet Inc. | 0.00 | -2.85 | 0.00 | 0.0976 | 0.0051 | ||||
| TSN / Tyson Foods, Inc. | 0.01 | 0.00 | 0.00 | 0.0932 | -0.0183 | ||||
| MRK / Merck & Co., Inc. | 0.01 | -1.75 | 0.00 | 0.0881 | -0.0187 | ||||
| ETR / Entergy Corporation | 0.01 | 0.00 | 0.00 | 0.0787 | -0.0061 | ||||
| COST / Costco Wholesale Corporation | 0.00 | 0.00 | 0.00 | 0.0718 | -0.0002 | ||||
| EME / EMCOR Group, Inc. | 0.00 | 0.00 | 0.0705 | 0.0705 | |||||
| GOOG / Alphabet Inc. | 0.00 | -5.09 | 0.00 | 0.0701 | 0.0019 | ||||
| JBHT / J.B. Hunt Transport Services, Inc. | 0.00 | 0.00 | 0.00 | 0.0650 | -0.0052 | ||||
| AEP / American Electric Power Company, Inc. | 0.00 | 0.00 | 0.00 | 0.0620 | -0.0065 | ||||
| RF / Regions Financial Corporation | 0.01 | 0.00 | 0.00 | 0.0616 | 0.0019 | ||||
| WCN / Waste Connections, Inc. | 0.00 | -20.03 | 0.00 | 0.0599 | -0.0222 | ||||
| OZK / Bank OZK | 0.01 | -2.48 | 0.00 | 0.0592 | 0.0004 | ||||
| VO / Vanguard Index Funds - Vanguard Mid-Cap ETF | 0.00 | 3.73 | 0.00 | 0.0545 | 0.0034 | ||||
| SCHF / Schwab Strategic Trust - Schwab International Equity ETF | 0.01 | 0.00 | 0.0539 | 0.0539 | |||||
| NFLX / Netflix, Inc. | 0.00 | 0.00 | 0.0512 | 0.0512 | |||||
| PEP / PepsiCo, Inc. | 0.00 | 0.00 | 0.00 | 0.0459 | -0.0088 | ||||
| QQQ / Invesco QQQ Trust, Series 1 | 0.00 | -3.13 | 0.00 | 0.0452 | 0.0035 | ||||
| KMB / Kimberly-Clark Corporation | 0.00 | 0.00 | 0.00 | 0.0452 | -0.0070 | ||||
| IWS / iShares Trust - iShares Russell Mid-Cap Value ETF | 0.00 | 0.00 | 0.00 | 0.0444 | -0.0000 | ||||
| PG / The Procter & Gamble Company | 0.00 | -2.19 | 0.00 | 0.0403 | -0.0060 | ||||
| PM / Philip Morris International Inc. | 0.00 | 0.00 | 0.0395 | 0.0395 | |||||
| GEV / GE Vernova Inc. | 0.00 | 0.00 | 0.0391 | 0.0391 | |||||
| WEST / Westrock Coffee Company | 0.02 | 0.00 | 0.00 | 0.0187 | -0.0059 | ||||
| BMY / Bristol-Myers Squibb Company | 0.00 | -100.00 | 0.00 | 0.0000 | |||||
| AMD / Advanced Micro Devices, Inc. | 0.00 | -100.00 | 0.00 | -100.00 | -0.2040 | ||||
| UNH / UnitedHealth Group Incorporated | 0.00 | -100.00 | 0.00 | 0.0000 | |||||
| CRL / Charles River Laboratories International, Inc. | 0.00 | -100.00 | 0.00 | 0.0000 | |||||
| FI / Fiserv, Inc. | 0.00 | -100.00 | 0.00 | 0.0000 | |||||
| TGI / Triumph Group, Inc. | 0.00 | -100.00 | 0.00 | 0.0000 |