Statistik Asas
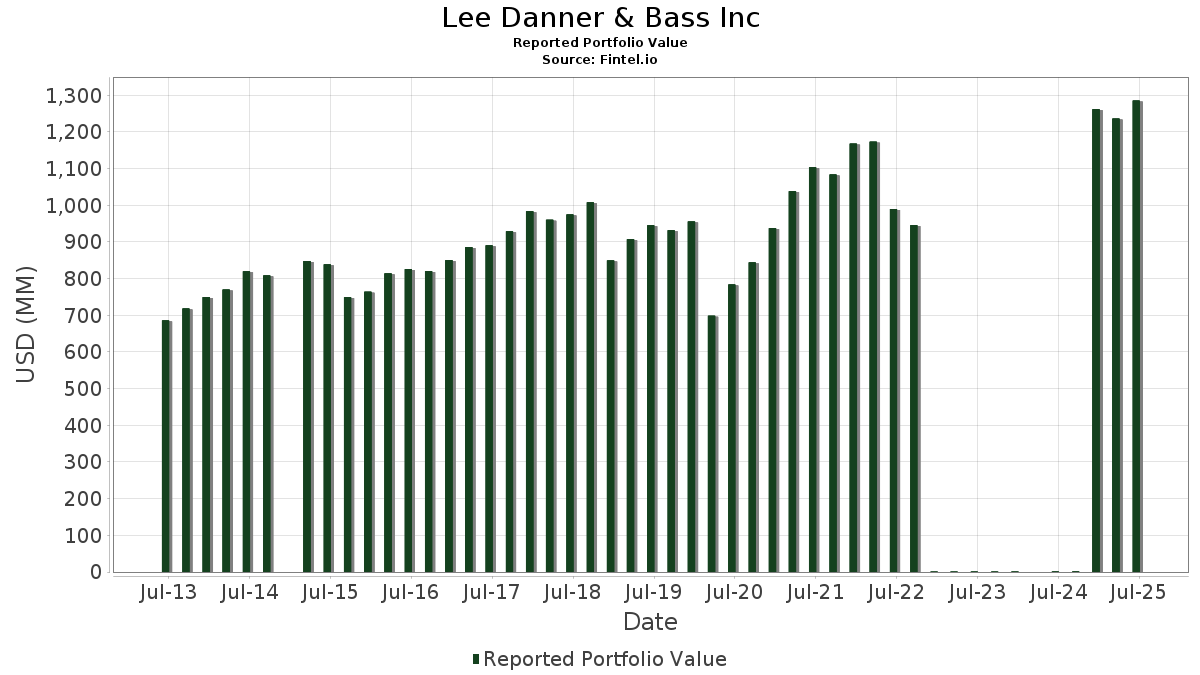
| Nilai Portfolio | $ 1,285,626,043 |
| Kedudukan Semasa | 223 |
Pegangan Terkini, Prestasi, AUM (dari 13F, 13D)
Lee Danner & Bass Inc telah mendedahkan 223 jumlah pegangan dalam pemfailan SEC terkini mereka. Nilai portfolio terkini dikira sebagai $ 1,285,626,043 USD. Aset Sebenar Di Bawah Pengurusan (AUM) ialah nilai ini ditambah dengan tunai (yang tidak didedahkan). Pegangan teratas Lee Danner & Bass Inc ialah HCA Healthcare, Inc. (US:HCA) , Berkshire Hathaway Inc. (US:BRK.A) , Microsoft Corporation (US:MSFT) , Apple Inc. (US:AAPL) , and Alphabet Inc. (US:GOOG) . Kedudukan baharu Lee Danner & Bass Inc termasuk Core Scientific, Inc. (US:CORZ) , Core Scientific, Inc. - Equity Warrant (US:CORZ.W) , .
Kenaikan Teratas Suku Tahun Ini
Kami menggunakan perubahan dalam peruntukan portfolio kerana ini adalah metrik yang paling bermakna. Perubahan boleh disebabkan oleh perdagangan atau perubahan dalam harga saham.
| Sekuriti | Saham (MM) |
Nilai (MM$) |
Portfolio % | ΔPortfolio % |
|---|---|---|---|---|
| 0.10 | 47.91 | 3.7269 | 0.7803 | |
| 0.40 | 152.05 | 11.8270 | 0.6375 | |
| 0.02 | 5.38 | 0.4183 | 0.4183 | |
| 0.04 | 26.22 | 2.0392 | 0.3972 | |
| 0.16 | 34.52 | 2.6850 | 0.3208 | |
| 0.34 | 6.83 | 0.5313 | 0.2721 | |
| 0.08 | 11.88 | 0.9242 | 0.2666 | |
| 0.03 | 24.74 | 1.9244 | 0.2593 | |
| 0.04 | 9.71 | 0.7556 | 0.2555 | |
| 0.21 | 37.26 | 2.8981 | 0.2224 |
Penurunan Teratas Suku Tahun Ini
Kami menggunakan perubahan dalam peruntukan portfolio kerana ini adalah metrik yang paling bermakna. Perubahan boleh disebabkan oleh perdagangan atau perubahan dalam harga saham.
| Sekuriti | Saham (MM) |
Nilai (MM$) |
Portfolio % | ΔPortfolio % |
|---|---|---|---|---|
| 0.29 | 138.93 | 10.8067 | -1.6156 | |
| 0.23 | 47.69 | 3.7092 | -0.6490 | |
| 0.11 | 32.75 | 2.5474 | -0.3434 | |
| 0.11 | 16.66 | 1.2960 | -0.2487 | |
| 0.16 | 16.73 | 1.3014 | -0.1614 | |
| 0.09 | 13.61 | 1.0583 | -0.1473 | |
| 0.06 | 14.52 | 1.1291 | -0.1396 | |
| 0.27 | 6.36 | 0.4946 | -0.1326 | |
| 0.09 | 7.40 | 0.5757 | -0.1304 | |
| 0.14 | 4.69 | 0.3650 | -0.1266 |
13F dan Pemfailan Dana
Borang ini telah difailkan pada 2025-07-31 untuk tempoh pelaporan 2025-06-30. Klik ikon pautan untuk melihat sejarah transaksi penuh.
Tingkatkan untuk membuka data premium dan eksport ke Excel ![]() .
.
| Sekuriti | Jenis | Purata Harga Saham | Saham (MM) |
ΔSaham (%) |
ΔSaham (%) |
Nilai ($MM) |
Portfolio (%) |
ΔPortfolio (%) |
|
|---|---|---|---|---|---|---|---|---|---|
| HCA / HCA Healthcare, Inc. | 0.40 | -0.88 | 152.05 | 9.89 | 11.8270 | 0.6375 | |||
| BRK.A / Berkshire Hathaway Inc. | 0.29 | -0.84 | 138.93 | -9.55 | 10.8067 | -1.6156 | |||
| MSFT / Microsoft Corporation | 0.10 | -0.76 | 47.91 | 31.50 | 3.7269 | 0.7803 | |||
| AAPL / Apple Inc. | 0.23 | -4.20 | 47.69 | -11.51 | 3.7092 | -0.6490 | |||
| GOOG / Alphabet Inc. | 0.21 | -0.82 | 37.26 | 12.61 | 2.8981 | 0.2224 | |||
| AMZN / Amazon.com, Inc. | 0.16 | 2.40 | 34.52 | 18.08 | 2.6850 | 0.3208 | |||
| ACN / Accenture plc | 0.11 | -4.35 | 32.75 | -8.38 | 2.5474 | -0.3434 | |||
| GS / The Goldman Sachs Group, Inc. | 0.04 | -0.34 | 26.22 | 29.12 | 2.0392 | 0.3972 | |||
| URI / United Rentals, Inc. | 0.03 | -0.05 | 24.74 | 20.16 | 1.9244 | 0.2593 | |||
| V / Visa Inc. | 0.06 | 0.97 | 23.04 | 2.30 | 1.7923 | -0.0293 | |||
| PNFP / Pinnacle Financial Partners, Inc. | 0.20 | -0.25 | 21.60 | 3.86 | 1.6798 | -0.0018 | |||
| RTX / RTX Corporation | 0.14 | -0.54 | 20.73 | 9.64 | 1.6122 | 0.0834 | |||
| FI / Fiserv, Inc. | 0.11 | 23.53 | 18.28 | -3.56 | 1.4219 | -0.1109 | |||
| XOM / Exxon Mobil Corporation | 0.16 | 2.05 | 16.73 | -7.50 | 1.3014 | -0.1614 | |||
| JNJ / Johnson & Johnson | 0.11 | -5.29 | 16.66 | -12.77 | 1.2960 | -0.2487 | |||
| LOW / Lowe's Companies, Inc. | 0.07 | 0.35 | 16.09 | -4.54 | 1.2514 | -0.1115 | |||
| AEM / Agnico Eagle Mines Limited | 0.13 | -0.20 | 15.48 | 9.48 | 1.2045 | 0.0607 | |||
| DIS / The Walt Disney Company | 0.12 | 1.57 | 15.22 | 27.62 | 1.1838 | 0.2194 | |||
| CAT / Caterpillar Inc. | 0.04 | -0.22 | 14.86 | 17.45 | 1.1561 | 0.1327 | |||
| FDX / FedEx Corporation | 0.06 | -0.76 | 14.52 | -7.47 | 1.1291 | -0.1396 | |||
| L / Loews Corporation | 0.16 | -1.28 | 14.49 | -1.55 | 1.1272 | -0.0632 | |||
| META / Meta Platforms, Inc. | 0.02 | -4.31 | 14.23 | 22.54 | 1.1066 | 0.1677 | |||
| SYY / Sysco Corporation | 0.19 | 0.87 | 14.08 | 1.81 | 1.0953 | -0.0232 | |||
| PG / The Procter & Gamble Company | 0.09 | -2.37 | 13.61 | -8.73 | 1.0583 | -0.1473 | |||
| RSG / Republic Services, Inc. | 0.05 | -3.96 | 13.46 | -2.20 | 1.0467 | -0.0659 | |||
| MDLZ / Mondelez International, Inc. | 0.20 | -0.15 | 13.22 | -0.75 | 1.0282 | -0.0489 | |||
| PM / Philip Morris International Inc. | 0.07 | -2.06 | 12.64 | 12.38 | 0.9830 | 0.0736 | |||
| WMT / Walmart Inc. | 0.13 | -1.40 | 12.52 | 9.82 | 0.9736 | 0.0519 | |||
| NVDD / Direxion Shares ETF Trust - Direxion Daily NVDA Bear 1X Shares | 0.08 | 0.23 | 11.88 | 46.11 | 0.9242 | 0.2666 | |||
| MDT / Medtronic plc | 0.12 | 0.63 | 10.59 | -2.38 | 0.8235 | -0.0536 | |||
| HD / The Home Depot, Inc. | 0.03 | -0.33 | 10.17 | -0.28 | 0.7914 | -0.0338 | |||
| ORCL / Oracle Corporation | 0.04 | 0.45 | 9.71 | 57.07 | 0.7556 | 0.2555 | |||
| CXW / CoreCivic, Inc. | 0.45 | -0.85 | 9.38 | 2.96 | 0.7295 | -0.0072 | |||
| BAC / Bank of America Corporation | 0.18 | 7.54 | 8.31 | 21.94 | 0.6467 | 0.0953 | |||
| HON / Honeywell International Inc. | 0.03 | -5.96 | 7.67 | 3.43 | 0.5963 | -0.0031 | |||
| JPM / JPMorgan Chase & Co. | 0.03 | -6.24 | 7.50 | 10.82 | 0.5832 | 0.0360 | |||
| MRK / Merck & Co., Inc. | 0.09 | -3.88 | 7.40 | -15.23 | 0.5757 | -0.1304 | |||
| CMP / Compass Minerals International, Inc. | 0.34 | -1.45 | 6.83 | 113.10 | 0.5313 | 0.2721 | |||
| BKFOF / Brookfield Corporation - Preferred Stock | 0.11 | -4.75 | 6.82 | 12.41 | 0.5306 | 0.0398 | |||
| AMGN / Amgen Inc. | 0.02 | -0.35 | 6.40 | -10.69 | 0.4980 | -0.0817 | |||
| GEO / The GEO Group, Inc. | 0.27 | 0.00 | 6.36 | -18.01 | 0.4946 | -0.1326 | |||
| UPS / United Parcel Service, Inc. | 0.06 | -0.63 | 6.28 | -8.81 | 0.4888 | -0.0685 | |||
| RF / Regions Financial Corporation | 0.26 | -0.44 | 6.10 | 7.76 | 0.4744 | 0.0167 | |||
| BA / The Boeing Company | 0.03 | 2.29 | 6.02 | 25.66 | 0.4681 | 0.0808 | |||
| UNH / UnitedHealth Group Incorporated | 0.02 | 65.86 | 5.98 | -1.21 | 0.4649 | -0.0244 | |||
| CSCO / Cisco Systems, Inc. | 0.09 | -2.68 | 5.96 | 9.42 | 0.4637 | 0.0231 | |||
| WTM / White Mountains Insurance Group, Ltd. | 0.00 | 0.00 | 5.65 | -6.76 | 0.4397 | -0.0506 | |||
| SYK / Stryker Corporation | 0.01 | -0.91 | 5.64 | 5.30 | 0.4388 | 0.0056 | |||
| INTC / Intel Corporation | 0.25 | 3.32 | 5.56 | 1.91 | 0.4323 | -0.0088 | |||
| MMM / 3M Company | 0.04 | -0.49 | 5.51 | 3.15 | 0.4285 | -0.0034 | |||
| KO / The Coca-Cola Company | 0.08 | -1.81 | 5.48 | -3.01 | 0.4263 | -0.0306 | |||
| HAL / Halliburton Company | 0.27 | 3.37 | 5.42 | -16.96 | 0.4214 | -0.1062 | |||
| CRM / Salesforce, Inc. | 0.02 | 5.38 | 0.4183 | 0.4183 | |||||
| JEF / Jefferies Financial Group Inc. | 0.10 | -6.69 | 5.34 | -4.74 | 0.4156 | -0.0380 | |||
| CVX / Chevron Corporation | 0.04 | 0.00 | 5.30 | -14.41 | 0.4126 | -0.0886 | |||
| IAK / iShares Trust - iShares U.S. Insurance ETF | 0.04 | 13.61 | 5.15 | 10.84 | 0.4010 | 0.0249 | |||
| SRE / Sempra | 0.06 | 37.01 | 4.80 | 45.49 | 0.3737 | 0.1066 | |||
| SLB / Schlumberger Limited | 0.14 | -4.54 | 4.69 | -22.80 | 0.3650 | -0.1266 | |||
| TRV / The Travelers Companies, Inc. | 0.02 | 0.00 | 4.66 | 1.17 | 0.3628 | -0.0101 | |||
| ADT / ADT Inc. | 0.55 | -2.62 | 4.66 | 1.35 | 0.3626 | -0.0094 | |||
| WFC / Wells Fargo & Company | 0.06 | -0.85 | 4.60 | 10.66 | 0.3578 | 0.0216 | |||
| TGNA / TEGNA Inc. | 0.27 | -7.20 | 4.46 | -14.63 | 0.3472 | -0.0756 | |||
| NKE / NIKE, Inc. | 0.06 | -3.02 | 4.44 | 8.53 | 0.3455 | 0.0145 | |||
| PINK / Simplify Exchange Traded Funds - Simplify Health Care ETF | 0.15 | 0.00 | 4.43 | 2.38 | 0.3444 | -0.0053 | |||
| NHI / National Health Investors, Inc. | 0.06 | -1.58 | 4.38 | -6.57 | 0.3405 | -0.0384 | |||
| SBUX / Starbucks Corporation | 0.05 | -0.99 | 4.34 | -7.50 | 0.3376 | -0.0419 | |||
| ABT / Abbott Laboratories | 0.03 | -3.61 | 4.33 | -1.19 | 0.3367 | -0.0175 | |||
| ZTS / Zoetis Inc. | 0.03 | -0.09 | 4.30 | -5.37 | 0.3347 | -0.0330 | |||
| IRM / Iron Mountain Incorporated | 0.04 | 15.75 | 4.28 | 38.01 | 0.3327 | 0.0820 | |||
| VERSX / Vanguard Emerging Markets Stock Index Fund | 0.09 | -0.71 | 4.28 | 8.53 | 0.3325 | 0.0139 | |||
| GHC / Graham Holdings Company | 0.00 | 0.00 | 4.26 | -1.53 | 0.3312 | -0.0185 | |||
| VSAT / Viasat, Inc. | 0.28 | 43.56 | 4.07 | 101.19 | 0.3163 | 0.1528 | |||
| MCD / McDonald's Corporation | 0.01 | 1.57 | 4.04 | -5.01 | 0.3145 | -0.0297 | |||
| MTB / M&T Bank Corporation | 0.02 | 0.00 | 3.96 | 8.53 | 0.3080 | 0.0129 | |||
| IJR / iShares Trust - iShares Core S&P Small-Cap ETF | 0.04 | -0.32 | 3.94 | 4.18 | 0.3065 | 0.0006 | |||
| HSIC / Henry Schein, Inc. | 0.05 | 44.63 | 3.82 | 54.28 | 0.2974 | 0.0970 | |||
| BAM / Brookfield Asset Management Ltd. | 0.07 | 0.00 | 3.78 | 14.10 | 0.2940 | 0.0261 | |||
| IBM / International Business Machines Corporation | 0.01 | -5.84 | 3.70 | 11.60 | 0.2881 | 0.0198 | |||
| ABBV / AbbVie Inc. | 0.02 | -0.64 | 3.63 | -11.98 | 0.2825 | -0.0512 | |||
| CVS / CVS Health Corporation | 0.05 | -6.67 | 3.57 | -4.96 | 0.2773 | -0.0261 | |||
| GOOGL / Alphabet Inc. | 0.02 | -0.58 | 3.32 | 13.30 | 0.2585 | 0.0213 | |||
| CMCSA / Comcast Corporation | 0.09 | -21.95 | 3.24 | -24.50 | 0.2517 | -0.0950 | |||
| DHR / Danaher Corporation | 0.02 | 10.88 | 3.22 | 6.83 | 0.2508 | 0.0068 | |||
| VTS / Vitesse Energy, Inc. | 0.13 | -1.53 | 2.84 | -11.53 | 0.2208 | -0.0387 | |||
| PANW / Palo Alto Networks, Inc. | 0.01 | 4.73 | 2.83 | 25.63 | 0.2204 | 0.0379 | |||
| BKD / Brookdale Senior Living Inc. | 0.41 | -6.87 | 2.83 | 3.55 | 0.2203 | -0.0009 | |||
| KKR / KKR & Co. Inc. | 0.02 | 3.11 | 2.64 | 18.68 | 0.2056 | 0.0254 | |||
| STZ / Constellation Brands, Inc. | 0.02 | -3.27 | 2.60 | -14.25 | 0.2023 | -0.0430 | |||
| NOV / NOV Inc. | 0.21 | 0.00 | 2.60 | -18.33 | 0.2021 | -0.0552 | |||
| PFE / Pfizer Inc. | 0.11 | -7.80 | 2.58 | -11.78 | 0.2004 | -0.0358 | |||
| DEO / Diageo plc - Depositary Receipt (Common Stock) | 0.03 | -0.81 | 2.57 | -4.57 | 0.2000 | -0.0178 | |||
| DUK / Duke Energy Corporation | 0.02 | -3.23 | 2.56 | -6.40 | 0.1993 | -0.0220 | |||
| TFC / Truist Financial Corporation | 0.06 | -0.33 | 2.53 | 4.15 | 0.1971 | 0.0003 | |||
| CARR / Carrier Global Corporation | 0.03 | 0.00 | 2.53 | 15.41 | 0.1969 | 0.0196 | |||
| TPR / Tapestry, Inc. | 0.03 | 0.00 | 2.48 | 24.71 | 0.1928 | 0.0321 | |||
| T / AT&T Inc. | 0.08 | 1.91 | 2.40 | 4.26 | 0.1865 | 0.0006 | |||
| BP / BP p.l.c. - Depositary Receipt (Common Stock) | 0.08 | -0.90 | 2.39 | -12.21 | 0.1856 | -0.0342 | |||
| COST / Costco Wholesale Corporation | 0.00 | 19.20 | 2.36 | 24.80 | 0.1836 | 0.0306 | |||
| USB / U.S. Bancorp | 0.05 | 2.56 | 2.31 | 9.88 | 0.1800 | 0.0097 | |||
| IWF / iShares Trust - iShares Russell 1000 Growth ETF | 0.01 | 0.00 | 2.30 | 17.57 | 0.1791 | 0.0207 | |||
| SPYV / SPDR Series Trust - SPDR Portfolio S&P 500 Value ETF | 0.04 | -17.06 | 2.29 | -15.00 | 0.1781 | -0.0397 | |||
| CLF / Cleveland-Cliffs Inc. | 0.30 | 143.46 | 2.26 | 125.25 | 0.1756 | 0.0945 | |||
| AXP / American Express Company | 0.01 | 0.00 | 2.09 | 18.60 | 0.1622 | 0.0200 | |||
| PEP / PepsiCo, Inc. | 0.02 | -1.19 | 2.03 | -13.01 | 0.1582 | -0.0308 | |||
| EEM / iShares, Inc. - iShares MSCI Emerging Markets ETF | 0.04 | 17.40 | 2.03 | 29.57 | 0.1582 | 0.0313 | |||
| IWD / iShares Trust - iShares Russell 1000 Value ETF | 0.01 | -0.50 | 1.94 | 2.75 | 0.1511 | -0.0018 | |||
| MCK / McKesson Corporation | 0.00 | 0.00 | 1.92 | 8.85 | 0.1493 | 0.0067 | |||
| OIH / VanEck ETF Trust - VanEck Oil Services ETF | 0.01 | -5.29 | 1.90 | -16.76 | 0.1476 | -0.0368 | |||
| IWB / iShares Trust - iShares Russell 1000 ETF | 0.01 | -14.69 | 1.82 | -5.54 | 0.1418 | -0.0143 | |||
| DAL / Delta Air Lines, Inc. | 0.04 | 0.03 | 1.80 | 12.80 | 0.1399 | 0.0110 | |||
| VMC / Vulcan Materials Company | 0.01 | 0.00 | 1.74 | 11.82 | 0.1355 | 0.0095 | |||
| EFA / iShares Trust - iShares MSCI EAFE ETF | 0.02 | 2.52 | 1.73 | 12.12 | 0.1346 | 0.0098 | |||
| XLU / The Select Sector SPDR Trust - The Utilities Select Sector SPDR Fund | 0.02 | 35.82 | 1.70 | 40.63 | 0.1325 | 0.0346 | |||
| SPY / SPDR S&P 500 ETF | 0.00 | 1.30 | 1.69 | 11.87 | 0.1313 | 0.0093 | |||
| OI / O-I Glass, Inc. | 0.11 | -2.39 | 1.58 | 25.46 | 0.1227 | 0.0210 | |||
| XLB / The Select Sector SPDR Trust - The Materials Select Sector SPDR Fund | 0.02 | 0.00 | 1.49 | 2.13 | 0.1155 | -0.0021 | |||
| OC / Owens Corning | 0.01 | -19.56 | 1.47 | -22.59 | 0.1144 | -0.0392 | |||
| BMY / Bristol-Myers Squibb Company | 0.03 | 0.00 | 1.47 | -24.13 | 0.1143 | -0.0423 | |||
| GLD / SPDR Gold Trust | 0.00 | 10.70 | 1.47 | 17.11 | 0.1140 | 0.0128 | |||
| BRK.A / Berkshire Hathaway Inc. | 0.00 | 0.00 | 1.46 | -8.71 | 0.1134 | -0.0158 | |||
| D / Dominion Energy, Inc. | 0.03 | 1.26 | 1.43 | 2.06 | 0.1116 | -0.0021 | |||
| IVV / iShares Trust - iShares Core S&P 500 ETF | 0.00 | -3.59 | 1.43 | 6.55 | 0.1114 | 0.0027 | |||
| AIG / American International Group, Inc. | 0.02 | 0.49 | 1.42 | -1.04 | 0.1106 | -0.0056 | |||
| TGT / Target Corporation | 0.01 | 5.95 | 1.41 | 0.14 | 0.1098 | -0.0042 | |||
| MO / Altria Group, Inc. | 0.02 | 0.16 | 1.37 | -2.21 | 0.1070 | -0.0067 | |||
| DXC / DXC Technology Company | 0.09 | -45.36 | 1.33 | -50.99 | 0.1037 | -0.1163 | |||
| ALL / The Allstate Corporation | 0.01 | -12.64 | 1.30 | -15.06 | 0.1014 | -0.0227 | |||
| VV / Vanguard Index Funds - Vanguard Large-Cap ETF | 0.00 | -0.05 | 1.16 | 10.96 | 0.0906 | 0.0057 | |||
| PSX / Phillips 66 | 0.01 | 0.00 | 1.08 | -3.41 | 0.0839 | -0.0064 | |||
| AVGO / Broadcom Inc. | 0.00 | -4.02 | 1.05 | 58.02 | 0.0820 | 0.0280 | |||
| TJX / The TJX Companies, Inc. | 0.01 | 0.00 | 1.03 | 1.38 | 0.0803 | -0.0020 | |||
| EPP / iShares, Inc. - iShares MSCI Pacific ex Japan ETF | 0.02 | 0.00 | 1.01 | 11.93 | 0.0788 | 0.0056 | |||
| LUV / Southwest Airlines Co. | 0.03 | -2.63 | 1.01 | -5.98 | 0.0783 | -0.0082 | |||
| HPE / Hewlett Packard Enterprise Company | 0.05 | 0.00 | 0.99 | 32.58 | 0.0773 | 0.0167 | |||
| SHEL / Shell plc - Depositary Receipt (Common Stock) | 0.01 | 0.00 | 0.96 | -3.92 | 0.0745 | -0.0061 | |||
| VB / Vanguard Index Funds - Vanguard Small-Cap ETF | 0.00 | -0.62 | 0.95 | 6.27 | 0.0738 | 0.0016 | |||
| INTU / Intuit Inc. | 0.00 | -30.54 | 0.93 | -10.89 | 0.0726 | -0.0121 | |||
| DRI / Darden Restaurants, Inc. | 0.00 | 0.00 | 0.92 | 5.00 | 0.0719 | 0.0006 | |||
| APA / APA Corporation | 0.05 | -2.70 | 0.92 | -15.40 | 0.0719 | -0.0164 | |||
| NVS / Novartis AG - Depositary Receipt (Common Stock) | 0.01 | -4.24 | 0.89 | 3.99 | 0.0689 | -0.0000 | |||
| VTI / Vanguard Index Funds - Vanguard Total Stock Market ETF | 0.00 | 0.00 | 0.86 | 10.70 | 0.0668 | 0.0040 | |||
| GE / General Electric Company | 0.00 | 0.00 | 0.82 | 28.68 | 0.0639 | 0.0122 | |||
| MS / Morgan Stanley | 0.01 | -11.90 | 0.82 | 6.36 | 0.0638 | 0.0014 | |||
| TRC / Tejon Ranch Co. | 0.05 | 0.00 | 0.80 | 7.12 | 0.0620 | 0.0018 | |||
| VYM / Vanguard Whitehall Funds - Vanguard High Dividend Yield ETF | 0.01 | 0.00 | 0.77 | 3.37 | 0.0597 | -0.0003 | |||
| OTIS / Otis Worldwide Corporation | 0.01 | -7.18 | 0.73 | -10.94 | 0.0571 | -0.0096 | |||
| IWR / iShares Trust - iShares Russell Mid-Cap ETF | 0.01 | 2.26 | 0.73 | 10.47 | 0.0567 | 0.0034 | |||
| TSCO / Tractor Supply Company | 0.01 | 0.00 | 0.73 | -4.23 | 0.0564 | -0.0048 | |||
| NSC / Norfolk Southern Corporation | 0.00 | -12.63 | 0.71 | -5.58 | 0.0554 | -0.0056 | |||
| ADBE / Adobe Inc. | 0.00 | 0.70 | 0.0544 | 0.0544 | |||||
| GIS / General Mills, Inc. | 0.01 | 0.00 | 0.68 | -13.27 | 0.0529 | -0.0106 | |||
| VO / Vanguard Index Funds - Vanguard Mid-Cap ETF | 0.00 | -2.10 | 0.68 | 5.93 | 0.0528 | 0.0010 | |||
| BYON / Beyond, Inc. | 0.10 | 0.00 | 0.68 | 18.63 | 0.0525 | 0.0065 | |||
| NEE / NextEra Energy, Inc. | 0.01 | -3.99 | 0.67 | -5.92 | 0.0519 | -0.0055 | |||
| DOC / Healthpeak Properties, Inc. | 0.04 | -21.46 | 0.62 | -32.01 | 0.0481 | -0.0254 | |||
| VUG / Vanguard Index Funds - Vanguard Growth ETF | 0.00 | 0.00 | 0.60 | 18.18 | 0.0465 | 0.0056 | |||
| IWM / iShares Trust - iShares Russell 2000 ETF | 0.00 | 0.00 | 0.59 | 8.09 | 0.0458 | 0.0018 | |||
| VEA / Vanguard Tax-Managed Funds - Vanguard FTSE Developed Markets ETF | 0.01 | 40.99 | 0.59 | 58.49 | 0.0458 | 0.0157 | |||
| FOXA / Fox Corporation | 0.01 | 0.00 | 0.58 | -1.03 | 0.0451 | -0.0023 | |||
| VBK / Vanguard Index Funds - Vanguard Small-Cap Growth ETF | 0.00 | 0.00 | 0.57 | 9.96 | 0.0447 | 0.0025 | |||
| COP / ConocoPhillips | 0.01 | -0.78 | 0.57 | -15.20 | 0.0443 | -0.0100 | |||
| LHX / L3Harris Technologies, Inc. | 0.00 | 0.00 | 0.55 | 19.91 | 0.0432 | 0.0057 | |||
| MA / Mastercard Incorporated | 0.00 | 0.00 | 0.55 | 2.44 | 0.0425 | -0.0006 | |||
| MPC / Marathon Petroleum Corporation | 0.00 | -13.47 | 0.54 | -1.27 | 0.0423 | -0.0023 | |||
| ADX / Adams Diversified Equity Fund, Inc. | 0.03 | 0.00 | 0.54 | 14.35 | 0.0422 | 0.0038 | |||
| AGI / Alamos Gold Inc. | 0.02 | 0.00 | 0.53 | -0.56 | 0.0413 | -0.0019 | |||
| MDY / SPDR S&P MidCap 400 ETF Trust | 0.00 | 0.00 | 0.52 | 6.09 | 0.0408 | 0.0009 | |||
| AZO / AutoZone, Inc. | 0.00 | -25.00 | 0.52 | -26.96 | 0.0407 | -0.0173 | |||
| PYPL / PayPal Holdings, Inc. | 0.01 | -28.01 | 0.52 | -18.05 | 0.0406 | -0.0109 | |||
| VLO / Valero Energy Corporation | 0.00 | 19.24 | 0.50 | 21.41 | 0.0389 | 0.0056 | |||
| FLOT / iShares Trust - iShares Floating Rate Bond ETF | 0.01 | 0.00 | 0.49 | -0.20 | 0.0383 | -0.0015 | |||
| LLY / Eli Lilly and Company | 0.00 | 1.71 | 0.46 | -4.14 | 0.0361 | -0.0030 | |||
| SO / The Southern Company | 0.00 | 0.00 | 0.45 | -0.22 | 0.0351 | -0.0014 | |||
| EW / Edwards Lifesciences Corporation | 0.01 | 0.00 | 0.44 | 7.92 | 0.0339 | 0.0012 | |||
| CABO / Cable One, Inc. | 0.00 | -13.02 | 0.43 | -55.62 | 0.0338 | -0.0453 | |||
| TDY / Teledyne Technologies Incorporated | 0.00 | 0.00 | 0.43 | 2.85 | 0.0338 | -0.0003 | |||
| TM / Toyota Motor Corporation - Depositary Receipt (Common Stock) | 0.00 | 0.00 | 0.43 | -2.48 | 0.0337 | -0.0022 | |||
| SHY / iShares Trust - iShares 1-3 Year Treasury Bond ETF | 0.01 | 0.00 | 0.43 | 0.23 | 0.0336 | -0.0013 | |||
| PAASF / Pan American Silver Corp. - Equity Right | 0.01 | 0.00 | 0.43 | 10.08 | 0.0331 | 0.0018 | |||
| WBD / Warner Bros. Discovery, Inc. | 0.04 | -1.28 | 0.42 | 5.29 | 0.0326 | 0.0005 | |||
| GEV / GE Vernova Inc. | 0.00 | 0.00 | 0.42 | 73.33 | 0.0324 | 0.0130 | |||
| CI / The Cigna Group | 0.00 | 0.00 | 0.41 | 0.49 | 0.0319 | -0.0011 | |||
| FTSM / First Trust Exchange Traded Fund IV - First Trust Enhanced Short Maturity ETF | 0.01 | 0.00 | 0.41 | 0.25 | 0.0317 | -0.0012 | |||
| SPSB / SPDR Series Trust - SPDR Portfolio Short Term Corporate Bond ETF | 0.01 | 0.00 | 0.40 | 0.50 | 0.0311 | -0.0011 | |||
| DVY / iShares Trust - iShares Select Dividend ETF | 0.00 | -11.96 | 0.39 | -12.92 | 0.0304 | -0.0059 | |||
| PLD / Prologis, Inc. | 0.00 | -3.29 | 0.39 | -8.96 | 0.0301 | -0.0043 | |||
| IUSG / iShares Trust - iShares Core S&P U.S. Growth ETF | 0.00 | 0.00 | 0.37 | 18.27 | 0.0288 | 0.0035 | |||
| CORZ / Core Scientific, Inc. | 0.02 | 0.34 | 0.0267 | 0.0267 | |||||
| LUMN / Lumen Technologies, Inc. | 0.08 | 0.00 | 0.33 | 11.74 | 0.0259 | 0.0018 | |||
| TEL / TE Connectivity plc | 0.00 | -33.11 | 0.32 | -20.25 | 0.0252 | -0.0076 | |||
| COF / Capital One Financial Corporation | 0.00 | 0.32 | 0.0249 | 0.0249 | |||||
| KGC / Kinross Gold Corporation | 0.02 | 0.11 | 0.32 | 24.22 | 0.0248 | 0.0040 | |||
| VHT / Vanguard World Fund - Vanguard Health Care ETF | 0.00 | 0.00 | 0.31 | -6.01 | 0.0243 | -0.0026 | |||
| NOC / Northrop Grumman Corporation | 0.00 | -0.49 | 0.30 | -2.90 | 0.0235 | -0.0016 | |||
| ONEQ / Fidelity Commonwealth Trust - Fidelity Nasdaq Composite Index ETF | 0.00 | 0.00 | 0.30 | 17.58 | 0.0235 | 0.0027 | |||
| AGG / iShares Trust - iShares Core U.S. Aggregate Bond ETF | 0.00 | -73.08 | 0.30 | -73.05 | 0.0235 | -0.0669 | |||
| IJH / iShares Trust - iShares Core S&P Mid-Cap ETF | 0.00 | -0.66 | 0.30 | 5.65 | 0.0233 | 0.0004 | |||
| FOX / Fox Corporation | 0.01 | 0.00 | 0.30 | -1.99 | 0.0230 | -0.0014 | |||
| ACWI / iShares Trust - iShares MSCI ACWI ETF | 0.00 | -19.49 | 0.29 | -10.98 | 0.0227 | -0.0038 | |||
| AMAT / Applied Materials, Inc. | 0.00 | 0.00 | 0.29 | 26.11 | 0.0222 | 0.0039 | |||
| VZ / Verizon Communications Inc. | 0.01 | -11.93 | 0.26 | -15.96 | 0.0201 | -0.0048 | |||
| ECL / Ecolab Inc. | 0.00 | 0.00 | 0.25 | 6.30 | 0.0197 | 0.0004 | |||
| QQQ / Invesco QQQ Trust, Series 1 | 0.00 | 0.25 | 0.0191 | 0.0191 | |||||
| BX / Blackstone Inc. | 0.00 | 0.00 | 0.25 | 7.46 | 0.0191 | 0.0005 | |||
| XLV / The Select Sector SPDR Trust - The Health Care Select Sector SPDR Fund | 0.00 | 0.00 | 0.24 | -7.42 | 0.0185 | -0.0023 | |||
| ATO / Atmos Energy Corporation | 0.00 | -1.61 | 0.24 | -1.67 | 0.0183 | -0.0011 | |||
| TSLA / Tesla, Inc. | 0.00 | 0.23 | 0.0178 | 0.0178 | |||||
| SOLV / Solventum Corporation | 0.00 | -4.67 | 0.23 | -5.02 | 0.0177 | -0.0017 | |||
| XLK / The Select Sector SPDR Trust - The Technology Select Sector SPDR Fund | 0.00 | 0.23 | 0.0176 | 0.0176 | |||||
| UNP / Union Pacific Corporation | 0.00 | -0.40 | 0.23 | -3.00 | 0.0176 | -0.0013 | |||
| VOO / Vanguard Index Funds - Vanguard S&P 500 ETF | 0.00 | 0.00 | 0.23 | 10.78 | 0.0176 | 0.0010 | |||
| VNQ / Vanguard Specialized Funds - Vanguard Real Estate ETF | 0.00 | 0.00 | 0.23 | -1.75 | 0.0176 | -0.0010 | |||
| ZBH / Zimmer Biomet Holdings, Inc. | 0.00 | -6.46 | 0.22 | -24.58 | 0.0175 | -0.0066 | |||
| IXUS / iShares Trust - iShares Core MSCI Total International Stock ETF | 0.00 | 0.00 | 0.22 | 10.89 | 0.0174 | 0.0011 | |||
| CORZ.W / Core Scientific, Inc. - Equity Warrant | 0.02 | 0.22 | 0.0170 | 0.0170 | |||||
| SCHX / Schwab Strategic Trust - Schwab U.S. Large-Cap ETF | 0.01 | 0.22 | 0.0169 | 0.0169 | |||||
| JCI / Johnson Controls International plc | 0.00 | -32.20 | 0.21 | -10.50 | 0.0166 | -0.0027 | |||
| AAL / American Airlines Group Inc. | 0.02 | 0.00 | 0.21 | 6.63 | 0.0163 | 0.0004 | |||
| VIG / Vanguard Specialized Funds - Vanguard Dividend Appreciation ETF | 0.00 | -9.13 | 0.20 | -4.25 | 0.0158 | -0.0013 | |||
| SXC / SunCoke Energy, Inc. | 0.02 | 0.00 | 0.17 | -7.07 | 0.0134 | -0.0015 | |||
| MPW / Medical Properties Trust, Inc. | 0.02 | 0.00 | 0.10 | -28.68 | 0.0076 | -0.0035 | |||
| RMNI / Rimini Street, Inc. | 0.02 | 0.00 | 0.08 | 8.70 | 0.0059 | 0.0002 | |||
| MBOT / Microbot Medical Inc. | 0.01 | 0.00 | 0.03 | 62.50 | 0.0021 | 0.0008 | |||
| KMB / Kimberly-Clark Corporation | 0.00 | -100.00 | 0.00 | 0.0000 | |||||
| DFS / Discover Financial Services | 0.00 | -100.00 | 0.00 | 0.0000 | |||||
| NEM / Newmont Corporation | 0.00 | -100.00 | 0.00 | 0.0000 | |||||
| EQC / Equity Commonwealth | 0.00 | -100.00 | 0.00 | 0.0000 | |||||
| VWOB / Vanguard Whitehall Funds - Vanguard Emerging Markets Government Bond ETF | 0.00 | -100.00 | 0.00 | 0.0000 | |||||
| KHC / The Kraft Heinz Company | 0.00 | -100.00 | 0.00 | 0.0000 |