Statistik Asas
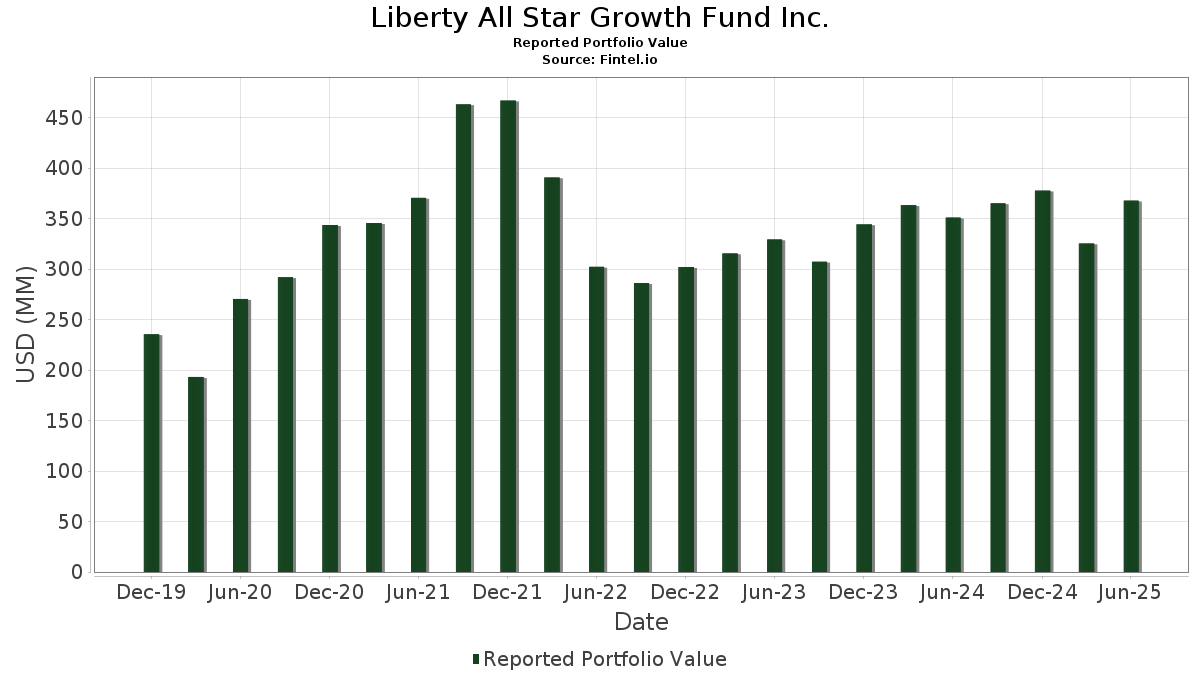
| Nilai Portfolio | $ 367,745,353 |
| Kedudukan Semasa | 119 |
Pegangan Terkini, Prestasi, AUM (dari 13F, 13D)
Liberty All Star Growth Fund Inc. telah mendedahkan 119 jumlah pegangan dalam pemfailan SEC terkini mereka. Nilai portfolio terkini dikira sebagai $ 367,745,353 USD. Aset Sebenar Di Bawah Pengurusan (AUM) ialah nilai ini ditambah dengan tunai (yang tidak didedahkan). Pegangan teratas Liberty All Star Growth Fund Inc. ialah NVIDIA Corporation (US:NVDA) , Microsoft Corporation (US:MSFT) , Apple Inc. (US:AAPL) , Amazon.com, Inc. (US:AMZN) , and Meta Platforms, Inc. (US:META) . Kedudukan baharu Liberty All Star Growth Fund Inc. termasuk Artivion, Inc. (US:AORT) , Cloudflare, Inc. (US:NET) , Encompass Health Corporation (US:EHC) , HEICO Corporation (US:HEI) , and Fair Isaac Corporation (US:FICO) .
Kenaikan Teratas Suku Tahun Ini
Kami menggunakan perubahan dalam peruntukan portfolio kerana ini adalah metrik yang paling bermakna. Perubahan boleh disebabkan oleh perdagangan atau perubahan dalam harga saham.
| Sekuriti | Saham (MM) |
Nilai (MM$) |
Portfolio % | ΔPortfolio % |
|---|---|---|---|---|
| 0.11 | 16.84 | 4.5814 | 1.2765 | |
| 0.12 | 3.64 | 0.9916 | 0.9916 | |
| 0.02 | 3.27 | 0.8886 | 0.8886 | |
| 0.03 | 3.15 | 0.8576 | 0.8576 | |
| 0.01 | 2.99 | 0.8149 | 0.8149 | |
| 0.00 | 2.90 | 0.7894 | 0.7894 | |
| 0.08 | 2.80 | 0.7623 | 0.7623 | |
| 0.06 | 2.34 | 0.6358 | 0.6358 | |
| 0.03 | 2.25 | 0.6117 | 0.6117 | |
| 0.01 | 2.10 | 0.5703 | 0.5703 |
Penurunan Teratas Suku Tahun Ini
Kami menggunakan perubahan dalam peruntukan portfolio kerana ini adalah metrik yang paling bermakna. Perubahan boleh disebabkan oleh perdagangan atau perubahan dalam harga saham.
| Sekuriti | Saham (MM) |
Nilai (MM$) |
Portfolio % | ΔPortfolio % |
|---|---|---|---|---|
| 0.00 | 0.69 | 0.1871 | -1.4340 | |
| 7.26 | 7.26 | 1.9760 | -1.3250 | |
| 0.03 | 5.64 | 1.5356 | -0.7686 | |
| 0.16 | 0.75 | 0.2044 | -0.5597 | |
| 0.04 | 8.82 | 2.4006 | -0.5532 | |
| 0.00 | 1.30 | 0.3551 | -0.5452 | |
| 0.07 | 3.64 | 0.9904 | -0.5223 | |
| 0.10 | 1.50 | 0.4086 | -0.4979 | |
| 0.05 | 5.86 | 1.5935 | -0.4231 | |
| 0.04 | 8.89 | 2.4182 | -0.4154 |
13F dan Pemfailan Dana
Borang ini telah difailkan pada 2025-08-27 untuk tempoh pelaporan 2025-06-30. Klik ikon pautan untuk melihat sejarah transaksi penuh.
Tingkatkan untuk membuka data premium dan eksport ke Excel ![]() .
.
| Sekuriti | Jenis | Purata Harga Saham | Saham (MM) |
ΔSaham (%) |
ΔSaham (%) |
Nilai ($MM) |
Portfolio (%) |
ΔPortfolio (%) |
|
|---|---|---|---|---|---|---|---|---|---|
| NVDA / NVIDIA Corporation | 0.11 | 7.52 | 16.84 | 56.74 | 4.5814 | 1.2765 | |||
| MSFT / Microsoft Corporation | 0.02 | -2.30 | 11.21 | 29.46 | 3.0497 | 0.3863 | |||
| AAPL / Apple Inc. | 0.04 | 4.46 | 8.89 | -3.51 | 2.4182 | -0.4154 | |||
| AMZN / Amazon.com, Inc. | 0.04 | -20.31 | 8.82 | -8.11 | 2.4006 | -0.5532 | |||
| META / Meta Platforms, Inc. | 0.01 | -5.94 | 8.64 | 20.45 | 2.3516 | 0.1442 | |||
| OLLI / Ollie's Bargain Outlet Holdings, Inc. | 0.07 | -0.73 | 8.59 | 12.43 | 2.3366 | -0.0132 | |||
| GVMXX / State Street Institutional Investment Trust - State Street Institutional US Govt Money Market Fnd Premier Cls | 7.26 | -32.32 | 7.26 | -32.32 | 1.9760 | -1.3250 | |||
| NTRA / Natera, Inc. | 0.04 | 5.66 | 6.62 | 26.24 | 1.8005 | 0.1878 | |||
| FSV / FirstService Corporation | 0.04 | -3.52 | 6.55 | 1.52 | 1.7832 | -0.2027 | |||
| CWST / Casella Waste Systems, Inc. | 0.05 | -13.66 | 5.86 | -10.67 | 1.5935 | -0.4231 | |||
| GOOGL / Alphabet Inc. | 0.03 | -33.88 | 5.64 | -24.66 | 1.5356 | -0.7686 | |||
| V / Visa Inc. | 0.01 | -7.49 | 5.26 | -6.29 | 1.4319 | -0.2955 | |||
| SPSC / SPS Commerce, Inc. | 0.04 | -11.60 | 5.21 | -9.37 | 1.4168 | -0.3505 | |||
| DXCM / DexCom, Inc. | 0.06 | -1.30 | 5.01 | 26.17 | 1.3631 | 0.1416 | |||
| NFLX / Netflix, Inc. | 0.00 | -2.36 | 4.99 | 40.21 | 1.3582 | 0.2630 | |||
| ACAD / ACADIA Pharmaceuticals Inc. | 0.21 | 1.84 | 4.61 | 32.25 | 1.2543 | 0.1820 | |||
| AIR / AAR Corp. | 0.06 | 48.91 | 4.43 | 82.99 | 1.2061 | 0.4608 | |||
| UPST / Upstart Holdings, Inc. | 0.07 | -26.94 | 4.40 | 2.69 | 1.1963 | -0.1211 | |||
| AVGO / Broadcom Inc. | 0.02 | -2.33 | 4.39 | 60.84 | 1.1949 | 0.3548 | |||
| ASND / Ascendis Pharma A/S - Depositary Receipt (Common Stock) | 0.02 | 5.16 | 4.25 | 16.46 | 1.1573 | 0.0338 | |||
| SITE / SiteOne Landscape Supply, Inc. | 0.03 | 23.51 | 4.19 | 23.00 | 1.1398 | 0.0921 | |||
| CASY / Casey's General Stores, Inc. | 0.01 | -0.62 | 4.11 | 16.84 | 1.1178 | 0.0361 | |||
| CW / Curtiss-Wright Corporation | 0.01 | -18.00 | 4.01 | 26.29 | 1.0902 | 0.1140 | |||
| EME / EMCOR Group, Inc. | 0.01 | -0.67 | 3.98 | 43.72 | 1.0844 | 0.2315 | |||
| BRO / Brown & Brown, Inc. | 0.04 | -0.60 | 3.97 | -11.41 | 1.0797 | -0.2982 | |||
| PEN / Penumbra, Inc. | 0.02 | -0.58 | 3.95 | -4.58 | 1.0762 | -0.1991 | |||
| RJF / Raymond James Financial, Inc. | 0.02 | -0.64 | 3.81 | 9.71 | 1.0367 | -0.0317 | |||
| NOW / ServiceNow, Inc. | 0.00 | -2.12 | 3.80 | 26.38 | 1.0340 | 0.1091 | |||
| TDG / TransDigm Group Incorporated | 0.00 | -17.21 | 3.79 | -8.98 | 1.0312 | -0.2498 | |||
| VSEC / VSE Corporation | 0.03 | 4.28 | 3.78 | 13.83 | 1.0281 | 0.0070 | |||
| CR / Crane Company | 0.02 | -0.62 | 3.77 | 23.21 | 1.0270 | 0.0845 | |||
| AORT / Artivion, Inc. | 0.12 | 3.64 | 0.9916 | 0.9916 | |||||
| STEP / StepStone Group Inc. | 0.07 | -30.34 | 3.64 | -25.98 | 0.9904 | -0.5223 | |||
| PLNT / Planet Fitness, Inc. | 0.03 | 4.00 | 3.54 | 17.41 | 0.9637 | 0.0355 | |||
| PGNY / Progyny, Inc. | 0.16 | 81.39 | 3.52 | 78.65 | 0.9588 | 0.3519 | |||
| GWRE / Guidewire Software, Inc. | 0.01 | -0.69 | 3.39 | 24.82 | 0.9226 | 0.0868 | |||
| AXON / Axon Enterprise, Inc. | 0.00 | -2.39 | 3.39 | 53.70 | 0.9215 | 0.2435 | |||
| DT / Dynatrace, Inc. | 0.06 | -0.72 | 3.29 | 16.22 | 0.8949 | 0.0245 | |||
| SFM / Sprouts Farmers Market, Inc. | 0.02 | -0.75 | 3.27 | 7.08 | 0.8893 | -0.0499 | |||
| NET / Cloudflare, Inc. | 0.02 | 3.27 | 0.8886 | 0.8886 | |||||
| EHC / Encompass Health Corporation | 0.03 | 3.15 | 0.8576 | 0.8576 | |||||
| PSTG / Pure Storage, Inc. | 0.05 | -0.79 | 3.14 | 29.05 | 0.8550 | 0.1059 | |||
| ATR / AptarGroup, Inc. | 0.02 | -0.78 | 3.10 | 4.62 | 0.8448 | -0.0683 | |||
| MPWR / Monolithic Power Systems, Inc. | 0.00 | 24.33 | 3.05 | 56.85 | 0.8290 | 0.2312 | |||
| LLY / Eli Lilly and Company | 0.00 | 24.20 | 3.04 | 17.24 | 0.8273 | 0.0294 | |||
| CYBR / CyberArk Software Ltd. | 0.01 | -0.80 | 3.03 | 19.41 | 0.8238 | 0.0438 | |||
| DSGX / The Descartes Systems Group Inc. | 0.03 | -0.78 | 3.03 | 0.03 | 0.8233 | -0.1074 | |||
| HEI / HEICO Corporation | 0.01 | 2.99 | 0.8149 | 0.8149 | |||||
| PI / Impinj, Inc. | 0.03 | 92.31 | 2.96 | 135.64 | 0.8061 | 0.4191 | |||
| VRT / Vertiv Holdings Co | 0.02 | -2.33 | 2.96 | 73.69 | 0.8051 | 0.2811 | |||
| LRN / Stride, Inc. | 0.02 | -0.80 | 2.95 | 13.84 | 0.8034 | 0.0056 | |||
| FICO / Fair Isaac Corporation | 0.00 | 2.90 | 0.7894 | 0.7894 | |||||
| PINS / Pinterest, Inc. | 0.08 | 2.80 | 0.7623 | 0.7623 | |||||
| FA / First Advantage Corporation | 0.17 | 93.56 | 2.80 | 128.12 | 0.7619 | 0.3844 | |||
| USFD / US Foods Holding Corp. | 0.04 | -27.33 | 2.80 | -14.51 | 0.7615 | -0.2455 | |||
| GDDY / GoDaddy Inc. | 0.02 | -0.87 | 2.77 | -0.93 | 0.7529 | -0.1062 | |||
| ORCL / Oracle Corporation | 0.01 | -2.27 | 2.73 | 52.86 | 0.7431 | 0.1934 | |||
| WING / Wingstop Inc. | 0.01 | -5.34 | 2.73 | 41.26 | 0.7418 | 0.1483 | |||
| NVT / nVent Electric plc | 0.04 | -0.87 | 2.72 | 38.58 | 0.7410 | 0.1362 | |||
| HLI / Houlihan Lokey, Inc. | 0.01 | -0.90 | 2.67 | 10.40 | 0.7279 | -0.0174 | |||
| TXRH / Texas Roadhouse, Inc. | 0.01 | -0.87 | 2.67 | 11.46 | 0.7255 | -0.0102 | |||
| HALO / Halozyme Therapeutics, Inc. | 0.05 | -0.90 | 2.58 | -19.22 | 0.7014 | -0.2802 | |||
| BAC / Bank of America Corporation | 0.05 | 57.13 | 2.56 | 78.27 | 0.6967 | 0.2546 | |||
| APO / Apollo Global Management, Inc. | 0.02 | 54.75 | 2.52 | 60.38 | 0.6853 | 0.2020 | |||
| COST / Costco Wholesale Corporation | 0.00 | -2.32 | 2.50 | 2.25 | 0.6816 | -0.0721 | |||
| DDOG / Datadog, Inc. | 0.02 | -1.00 | 2.46 | 34.06 | 0.6695 | 0.1048 | |||
| GRMN / Garmin Ltd. | 0.01 | -0.97 | 2.46 | -4.80 | 0.6694 | -0.1256 | |||
| IRTC / iRhythm Technologies, Inc. | 0.02 | -8.73 | 2.46 | 34.21 | 0.6685 | 0.1055 | |||
| TRNS / Transcat, Inc. | 0.03 | 74.66 | 2.39 | 101.69 | 0.6493 | 0.2853 | |||
| TSM / Taiwan Semiconductor Manufacturing Company Limited - Depositary Receipt (Common Stock) | 0.01 | -2.32 | 2.38 | 33.26 | 0.6490 | 0.0984 | |||
| FAST / Fastenal Company | 0.06 | 2.34 | 0.6358 | 0.6358 | |||||
| MKTX / MarketAxess Holdings Inc. | 0.01 | -1.05 | 2.32 | 2.16 | 0.6315 | -0.0675 | |||
| CAVA / CAVA Group, Inc. | 0.03 | 2.25 | 0.6117 | 0.6117 | |||||
| SMTC / Semtech Corporation | 0.05 | 83.05 | 2.23 | 140.37 | 0.6078 | 0.3217 | |||
| BAH / Booz Allen Hamilton Holding Corporation | 0.02 | -1.11 | 2.18 | -1.54 | 0.5927 | -0.0879 | |||
| MEG / Montrose Environmental Group, Inc. | 0.10 | 23.74 | 2.17 | 89.95 | 0.5915 | 0.2394 | |||
| AGYS / Agilysys, Inc. | 0.02 | -36.88 | 2.14 | -0.23 | 0.5814 | -0.0775 | |||
| HWM / Howmet Aerospace Inc. | 0.01 | 2.10 | 0.5703 | 0.5703 | |||||
| NOVT / Novanta Inc. | 0.02 | 285.54 | 2.08 | 288.76 | 0.5650 | 0.4007 | |||
| PLMR / Palomar Holdings, Inc. | 0.01 | -27.10 | 2.02 | -18.00 | 0.5505 | -0.2083 | |||
| CRM / Salesforce, Inc. | 0.01 | -22.75 | 2.02 | -21.51 | 0.5494 | -0.2419 | |||
| VERX / Vertex, Inc. | 0.06 | 26.84 | 2.02 | 27.98 | 0.5491 | 0.0642 | |||
| COO / The Cooper Companies, Inc. | 0.03 | -1.20 | 1.97 | -16.65 | 0.5357 | -0.1909 | |||
| GEV / GE Vernova Inc. | 0.00 | -2.11 | 1.96 | 69.66 | 0.5342 | 0.1783 | |||
| STRL / Sterling Infrastructure, Inc. | 0.01 | -4.38 | 1.96 | 95.02 | 0.5329 | 0.2237 | |||
| ICE / Intercontinental Exchange, Inc. | 0.01 | 1.93 | 0.5252 | 0.5252 | |||||
| KTOS / Kratos Defense & Security Solutions, Inc. | 0.04 | -32.10 | 1.89 | 6.19 | 0.5140 | -0.0331 | |||
| DECK / Deckers Outdoor Corporation | 0.02 | -1.27 | 1.88 | -8.99 | 0.5123 | -0.1241 | |||
| TSLA / Tesla, Inc. | 0.01 | -2.33 | 1.73 | 19.71 | 0.4711 | 0.0262 | |||
| SPOT / Spotify Technology S.A. | 0.00 | 1.73 | 0.4696 | 0.4696 | |||||
| NCNO / nCino, Inc. | 0.06 | 55.54 | 1.70 | 58.29 | 0.4629 | 0.1324 | |||
| UNP / Union Pacific Corporation | 0.01 | -2.37 | 1.61 | -4.90 | 0.4383 | -0.0829 | |||
| GKOS / Glaukos Corporation | 0.02 | 127.46 | 1.59 | 138.89 | 0.4330 | 0.2279 | |||
| RDNT / RadNet, Inc. | 0.03 | 272.68 | 1.58 | 326.83 | 0.4288 | 0.3152 | |||
| CHKP / Check Point Software Technologies Ltd. | 0.01 | -32.25 | 1.52 | -34.27 | 0.4136 | -0.2974 | |||
| RXO / RXO, Inc. | 0.10 | -38.09 | 1.50 | -49.05 | 0.4086 | -0.4979 | |||
| RARE / Ultragenyx Pharmaceutical Inc. | 0.04 | 0.00 | 1.50 | 0.40 | 0.4071 | -0.0513 | |||
| TTD / The Trade Desk, Inc. | 0.02 | -1.65 | 1.49 | 29.33 | 0.4046 | 0.0511 | |||
| SNPS / Synopsys, Inc. | 0.00 | -40.55 | 1.37 | -48.81 | 0.3739 | -0.3911 | |||
| ORLY / O'Reilly Automotive, Inc. | 0.02 | 1.36 | 0.3704 | 0.3704 | |||||
| AMAT / Applied Materials, Inc. | 0.01 | 1.32 | 0.3592 | 0.3592 | |||||
| PGR / The Progressive Corporation | 0.00 | -52.71 | 1.30 | -55.43 | 0.3551 | -0.5452 | |||
| CDRE / Cadre Holdings, Inc. | 0.04 | -40.40 | 1.21 | -35.87 | 0.3299 | -0.2518 | |||
| PIPR / Piper Sandler Companies | 0.00 | 1.20 | 0.3267 | 0.3267 | |||||
| LOAR / Loar Holdings Inc. | 0.01 | -14.80 | 1.18 | 3.88 | 0.3204 | -0.0282 | |||
| LEGN / Legend Biotech Corporation - Depositary Receipt (Common Stock) | 0.03 | -2.33 | 1.15 | 2.14 | 0.3123 | -0.0333 | |||
| TNDM / Tandem Diabetes Care, Inc. | 0.05 | -48.24 | 1.01 | -49.68 | 0.2761 | -0.3438 | |||
| USPH / U.S. Physical Therapy, Inc. | 0.01 | 0.00 | 0.95 | 7.96 | 0.2585 | -0.0119 | |||
| UNH / UnitedHealth Group Incorporated | 0.00 | -13.50 | 0.94 | -48.49 | 0.2557 | -0.3054 | |||
| XMTR / Xometry, Inc. | 0.03 | -18.89 | 0.87 | 10.00 | 0.2367 | -0.0066 | |||
| PRO / PROS Holdings, Inc. | 0.06 | 0.00 | 0.87 | -17.74 | 0.2362 | -0.0883 | |||
| INSP / Inspire Medical Systems, Inc. | 0.01 | 81.99 | 0.85 | 48.35 | 0.2323 | 0.0552 | |||
| NEOG / Neogen Corporation | 0.16 | -45.15 | 0.75 | -69.75 | 0.2044 | -0.5597 | |||
| HLNE / Hamilton Lane Incorporated | 0.00 | -86.35 | 0.69 | -86.96 | 0.1871 | -1.4340 | |||
| INMD / InMode Ltd. | 0.04 | 0.00 | 0.58 | -18.63 | 0.1582 | -0.0615 | |||
| CLB / Core Laboratories Inc. | 0.05 | 0.00 | 0.58 | -23.20 | 0.1570 | -0.0740 | |||
| NEO / NeoGenomics, Inc. | 0.08 | -35.73 | 0.57 | -50.52 | 0.1561 | -0.2004 | |||
| SITM / SiTime Corporation | 0.00 | -80.56 | 0.43 | -72.89 | 0.1181 | -0.3747 | |||
| PAR / PAR Technology Corporation | 0.00 | 0.00 | 0.30 | 13.03 | 0.0804 | 0.0000 | |||
| State Street Navigator Securities lending Prime Portfolio / STIV (N/A) | 0.00 | 0.00 | 0.0000 | 0.0000 |