Statistik Asas
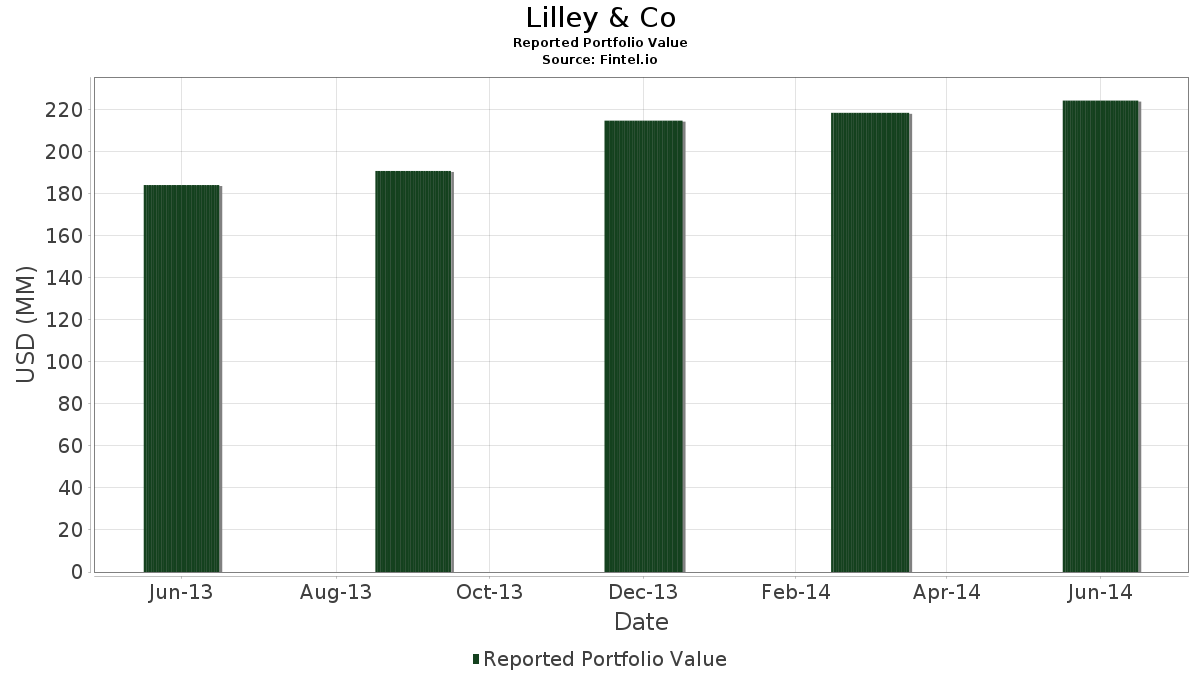
| Nilai Portfolio | $ 224,352,000 |
| Kedudukan Semasa | 105 |
Pegangan Terkini, Prestasi, AUM (dari 13F, 13D)
Lilley & Co telah mendedahkan 105 jumlah pegangan dalam pemfailan SEC terkini mereka. Nilai portfolio terkini dikira sebagai $ 224,352,000 USD. Aset Sebenar Di Bawah Pengurusan (AUM) ialah nilai ini ditambah dengan tunai (yang tidak didedahkan). Pegangan teratas Lilley & Co ialah SPDR S&P MidCap 400 ETF Trust (US:MDY) , ALPS ETF Trust - Alerian MLP ETF (US:AMLP) , iShares Trust - iShares MSCI EAFE ETF (US:EFA) , Vanguard International Equity Index Funds - Vanguard FTSE Emerging Markets ETF (US:VWO) , and iShares, Inc. - iShares MSCI Pacific ex Japan ETF (US:EPP) . Kedudukan baharu Lilley & Co termasuk Alphabet Inc. (US:GOOG) , Perrigo Company plc (US:PRGO) , Visa Inc. (US:V) , Air Products and Chemicals, Inc. (US:APD) , and .
Kenaikan Teratas Suku Tahun Ini
Kami menggunakan perubahan dalam peruntukan portfolio kerana ini adalah metrik yang paling bermakna. Perubahan boleh disebabkan oleh perdagangan atau perubahan dalam harga saham.
| Sekuriti | Saham (MM) |
Nilai (MM$) |
Portfolio % | ΔPortfolio % |
|---|---|---|---|---|
| 0.17 | 11.68 | 5.2048 | 0.6707 | |
| 0.05 | 4.46 | 1.9875 | 0.5035 | |
| 0.68 | 12.92 | 5.7588 | 0.2555 | |
| 0.22 | 9.55 | 4.2563 | 0.1560 | |
| 0.05 | 2.25 | 1.0024 | 0.1508 | |
| 0.12 | 5.00 | 2.2286 | 0.0984 | |
| 0.08 | 4.38 | 1.9536 | 0.0898 | |
| 0.03 | 4.57 | 2.0356 | 0.0885 | |
| 0.09 | 5.01 | 2.2327 | 0.0846 | |
| 0.07 | 4.05 | 1.8048 | 0.0832 |
Penurunan Teratas Suku Tahun Ini
Kami menggunakan perubahan dalam peruntukan portfolio kerana ini adalah metrik yang paling bermakna. Perubahan boleh disebabkan oleh perdagangan atau perubahan dalam harga saham.
| Sekuriti | Saham (MM) |
Nilai (MM$) |
Portfolio % | ΔPortfolio % |
|---|---|---|---|---|
| 0.02 | 0.58 | 0.2608 | -0.8911 | |
| 0.00 | 2.37 | 1.0568 | -0.6016 | |
| 0.07 | 3.92 | 1.7486 | -0.3020 | |
| 0.01 | 1.84 | 0.8197 | -0.1665 | |
| 0.00 | 0.00 | -0.1524 | ||
| 0.02 | 0.27 | 0.1221 | -0.1460 | |
| 0.04 | 4.52 | 2.0160 | -0.1389 | |
| 0.01 | 0.70 | 0.3120 | -0.1319 | |
| 0.06 | 2.18 | 0.9708 | -0.1289 | |
| 0.00 | 0.00 | -0.1085 |
13F dan Pemfailan Dana
Borang ini telah difailkan pada 2014-07-14 untuk tempoh pelaporan 2014-06-30. Klik ikon pautan untuk melihat sejarah transaksi penuh.
Tingkatkan untuk membuka data premium dan eksport ke Excel ![]() .
.
| Sekuriti | Jenis | Purata Harga Saham | Saham (MM) |
ΔSaham (%) |
ΔSaham (%) |
Nilai ($MM) |
Portfolio (%) |
ΔPortfolio (%) |
|
|---|---|---|---|---|---|---|---|---|---|
| MDY / SPDR S&P MidCap 400 ETF Trust | 0.07 | -0.43 | 18.21 | 3.54 | 8.1180 | 0.0686 | |||
| AMLP / ALPS ETF Trust - Alerian MLP ETF | 0.68 | -0.14 | 12.92 | 7.43 | 5.7588 | 0.2555 | |||
| EFA / iShares Trust - iShares MSCI EAFE ETF | 0.17 | 15.83 | 11.68 | 17.85 | 5.2048 | 0.6707 | |||
| VWO / Vanguard International Equity Index Funds - Vanguard FTSE Emerging Markets ETF | 0.22 | 0.26 | 9.55 | 6.57 | 4.2563 | 0.1560 | |||
| EPP / iShares, Inc. - iShares MSCI Pacific ex Japan ETF | 0.14 | 1.37 | 7.02 | 3.80 | 3.1272 | 0.0342 | |||
| IJR / iShares Trust - iShares Core S&P Small-Cap ETF | 0.05 | 0.69 | 5.97 | 2.47 | 2.6614 | -0.0051 | |||
| IWM / iShares Trust - iShares Russell 2000 ETF | 0.05 | 0.65 | 5.76 | 2.78 | 2.5692 | 0.0029 | |||
| IJH / iShares Trust - iShares Core S&P Mid-Cap ETF | 0.04 | 0.16 | 5.42 | 4.25 | 2.4136 | 0.0368 | |||
| XOM / Exxon Mobil Corporation | 0.05 | 0.95 | 5.14 | 4.04 | 2.2933 | 0.0304 | |||
| ABBV / AbbVie Inc. | 0.09 | -2.83 | 5.01 | 6.71 | 2.2327 | 0.0846 | |||
| ABT / Abbott Laboratories | 0.12 | 1.14 | 5.00 | 7.41 | 2.2286 | 0.0984 | |||
| VNQ / Vanguard Specialized Funds - Vanguard Real Estate ETF | 0.07 | -4.18 | 4.92 | 1.55 | 2.1925 | -0.0242 | |||
| BRK.A / Berkshire Hathaway Inc. | 0.00 | 0.00 | 4.75 | 1.37 | 2.1163 | -0.0272 | |||
| CVX / Chevron Corporation | 0.03 | -2.24 | 4.57 | 7.33 | 2.0356 | 0.0885 | |||
| RTX / RTX Corporation | 0.04 | -2.80 | 4.52 | -3.95 | 2.0160 | -0.1389 | |||
| AAPL / Apple Inc. | 0.05 | 694.22 | 4.46 | 37.50 | 1.9875 | 0.5035 | |||
| WFC / Wells Fargo & Company | 0.08 | 1.83 | 4.38 | 7.61 | 1.9536 | 0.0898 | |||
| PG / The Procter & Gamble Company | 0.05 | 0.66 | 4.25 | -1.85 | 1.8961 | -0.0872 | |||
| DHR / Danaher Corporation | 0.05 | -1.12 | 4.23 | 3.78 | 1.8859 | 0.0202 | |||
| SYK / Stryker Corporation | 0.05 | -1.08 | 4.11 | 2.39 | 1.8328 | -0.0050 | |||
| BEN / Franklin Resources, Inc. | 0.07 | 0.81 | 4.05 | 7.63 | 1.8048 | 0.0832 | |||
| PEP / PepsiCo, Inc. | 0.04 | -0.76 | 3.95 | 6.15 | 1.7615 | 0.0578 | |||
| TJX / The TJX Companies, Inc. | 0.07 | -0.08 | 3.92 | -12.45 | 1.7486 | -0.3020 | |||
| ORCL / Oracle Corporation | 0.10 | -0.31 | 3.90 | -1.22 | 1.7361 | -0.0683 | |||
| AXP / American Express Company | 0.04 | -0.32 | 3.82 | 5.05 | 1.7045 | 0.0387 | |||
| JNJ / Johnson & Johnson | 0.04 | -4.38 | 3.66 | 1.84 | 1.6323 | -0.0133 | |||
| MCD / McDonald's Corporation | 0.03 | -0.57 | 3.46 | 2.19 | 1.5409 | -0.0072 | |||
| GE / General Electric Company | 0.11 | -3.51 | 2.78 | -2.04 | 1.2400 | -0.0596 | |||
| GOOGL / Alphabet Inc. | 0.00 | 24.72 | 2.37 | -34.58 | 1.0568 | -0.6016 | |||
| VZ / Verizon Communications Inc. | 0.05 | 17.45 | 2.25 | 20.85 | 1.0024 | 0.1508 | |||
| SYY / Sysco Corporation | 0.06 | -12.59 | 2.18 | -9.36 | 0.9708 | -0.1289 | |||
| GOOG / Alphabet Inc. | 0.00 | 1.98 | 0.0000 | ||||||
| SLB / Schlumberger Limited | 0.02 | -6.70 | 1.92 | 12.91 | 0.8536 | 0.0775 | |||
| ESRX / Express Scripts Holding Co. | 0.03 | 2.45 | 1.87 | -5.40 | 0.8348 | -0.0712 | |||
| IBM / International Business Machines Corporation | 0.01 | -9.41 | 1.84 | -14.66 | 0.8197 | -0.1665 | |||
| GD / General Dynamics Corporation | 0.02 | -1.92 | 1.79 | 4.99 | 0.7979 | 0.0176 | |||
| JPM / JPMorgan Chase & Co. | 0.03 | 1.38 | 1.72 | -3.81 | 0.7662 | -0.0516 | |||
| MCHP / Microchip Technology Incorporated | 0.04 | 8.53 | 1.72 | 10.92 | 0.7649 | 0.0569 | |||
| MSFT / Microsoft Corporation | 0.04 | -3.68 | 1.66 | -2.01 | 0.7381 | -0.0352 | |||
| ADP / Automatic Data Processing, Inc. | 0.02 | -1.33 | 1.65 | 1.23 | 0.7332 | -0.0104 | |||
| INTC / Intel Corporation | 0.05 | -5.28 | 1.60 | 13.46 | 0.7141 | 0.0679 | |||
| NKE / NIKE, Inc. | 0.02 | -0.01 | 1.49 | 4.94 | 0.6628 | 0.0144 | |||
| COST / Costco Wholesale Corporation | 0.01 | 1.38 | 1.44 | 4.50 | 0.6423 | 0.0112 | |||
| K / Kellanova | 0.02 | -0.69 | 1.43 | 4.08 | 0.6365 | 0.0087 | |||
| CMI / Cummins Inc. | 0.01 | -0.07 | 1.40 | 3.54 | 0.6258 | 0.0053 | |||
| QCOM / QUALCOMM Incorporated | 0.02 | 1.60 | 1.35 | 2.03 | 0.6035 | -0.0037 | |||
| CB / Chubb Limited | 0.01 | -3.11 | 1.29 | 0.00 | 0.5732 | -0.0153 | |||
| CAT / Caterpillar Inc. | 0.01 | 2.28 | 1.27 | 11.94 | 0.5643 | 0.0467 | |||
| CSCO / Cisco Systems, Inc. | 0.05 | -13.60 | 1.24 | -4.17 | 0.5527 | -0.0395 | |||
| GIS / General Mills, Inc. | 0.02 | -1.38 | 1.24 | 0.08 | 0.5509 | -0.0142 | |||
| IVV / iShares Trust - iShares Core S&P 500 ETF | 0.01 | -0.35 | 1.13 | 4.33 | 0.5050 | 0.0080 | |||
| ITW / Illinois Tool Works Inc. | 0.01 | -2.19 | 1.07 | 5.40 | 0.4787 | 0.0124 | |||
| MRO / Marathon Oil Corporation | 0.03 | 0.00 | 1.01 | 12.32 | 0.4511 | 0.0388 | |||
| SPY / SPDR S&P 500 ETF | 0.00 | -3.06 | 0.93 | 1.53 | 0.4145 | -0.0046 | |||
| VFC / V.F. Corporation | 0.01 | -1.21 | 0.92 | 0.55 | 0.4078 | -0.0086 | |||
| TGT / Target Corporation | 0.01 | -12.74 | 0.86 | -16.43 | 0.3856 | -0.0881 | |||
| EEM / iShares, Inc. - iShares MSCI Emerging Markets ETF | 0.02 | 10.30 | 0.78 | 16.34 | 0.3459 | 0.0407 | |||
| MPC / Marathon Petroleum Corporation | 0.01 | -2.28 | 0.75 | -12.35 | 0.3352 | -0.0574 | |||
| NSC / Norfolk Southern Corporation | 0.01 | 11.09 | 0.75 | 17.95 | 0.3339 | 0.0433 | |||
| PRGO / Perrigo Company plc | 0.00 | 0.72 | 0.0000 | ||||||
| CVS / CVS Health Corporation | 0.01 | 5.01 | 0.72 | 5.72 | 0.3214 | 0.0093 | |||
| PFE / Pfizer Inc. | 0.02 | -15.26 | 0.71 | -21.71 | 0.3151 | -0.0981 | |||
| D / Dominion Energy, Inc. | 0.01 | -28.38 | 0.70 | -27.84 | 0.3120 | -0.1319 | |||
| DIS / The Walt Disney Company | 0.01 | 23.05 | 0.68 | 31.71 | 0.3018 | 0.0665 | |||
| NEE / NextEra Energy, Inc. | 0.01 | -4.64 | 0.63 | 2.11 | 0.2808 | -0.0015 | |||
| FXI / iShares Trust - iShares China Large-Cap ETF | 0.02 | -77.52 | 0.58 | -76.76 | 0.2608 | -0.8911 | |||
| KO / The Coca-Cola Company | 0.01 | -9.35 | 0.55 | -0.73 | 0.2434 | -0.0083 | |||
| T / AT&T Inc. | 0.01 | -15.61 | 0.52 | -14.82 | 0.2331 | -0.0479 | |||
| NOV / NOV Inc. | 0.01 | 5.66 | 0.52 | 11.64 | 0.2309 | 0.0186 | |||
| FAST / Fastenal Company | 0.01 | -9.40 | 0.51 | -9.12 | 0.2264 | -0.0294 | |||
| C.WSA / Citigroup, Inc. | 0.00 | 10.45 | 0.51 | 12.17 | 0.2260 | 0.0191 | |||
| PRU / Prudential Financial, Inc. | 0.01 | 11.69 | 0.50 | 17.33 | 0.2233 | 0.0279 | |||
| CERN / Cerner Corp. | 0.01 | -2.59 | 0.49 | -10.64 | 0.2171 | -0.0323 | |||
| COP / ConocoPhillips | 0.01 | -8.00 | 0.48 | 12.33 | 0.2153 | 0.0185 | |||
| BRCM / Broadcom Corporation | 0.01 | 3.34 | 0.48 | 22.03 | 0.2148 | 0.0341 | |||
| SO / The Southern Company | 0.01 | -25.14 | 0.45 | -22.59 | 0.2001 | -0.0653 | |||
| JCI / Johnson Controls International plc | 0.01 | 0.00 | 0.40 | 5.48 | 0.1801 | 0.0048 | |||
| TROW / T. Rowe Price Group, Inc. | 0.00 | 5.50 | 0.39 | 8.36 | 0.1734 | 0.0091 | |||
| NVS / Novartis AG - Depositary Receipt (Common Stock) | 0.00 | -22.55 | 0.39 | -17.48 | 0.1725 | -0.0421 | |||
| WMT / Walmart Inc. | 0.00 | 23.52 | 0.37 | 21.24 | 0.1654 | 0.0253 | |||
| WAG / | 0.00 | -0.24 | 0.36 | 11.73 | 0.1614 | 0.0131 | |||
| 00B65Z9D7 / Noble Corporation plc | 0.01 | 12.35 | 0.35 | 15.03 | 0.1569 | 0.0169 | |||
| KEY / KeyCorp | 0.02 | -7.75 | 0.34 | -7.34 | 0.1520 | -0.0164 | |||
| AFL / Aflac Incorporated | 0.01 | 0.00 | 0.33 | -1.21 | 0.1453 | -0.0057 | |||
| EMC / Global X Funds - Global X Emerging Markets Great Consumer ETF | 0.01 | -18.21 | 0.32 | -21.41 | 0.1440 | -0.0441 | |||
| BA / The Boeing Company | 0.00 | -2.00 | 0.31 | -0.64 | 0.1391 | -0.0046 | |||
| BHI / Baker Hughes Inc. | 0.00 | -9.37 | 0.31 | 3.69 | 0.1377 | 0.0014 | |||
| COL / Rockwell Collins, Inc. | 0.00 | -1.26 | 0.30 | -3.17 | 0.1359 | -0.0082 | |||
| RDS.A / Shell Plc - ADR (Representing Ordinary Shares - Class A) | 0.00 | -30.39 | 0.29 | -21.43 | 0.1275 | -0.0391 | |||
| PFF / iShares Trust - iShares Preferred and Income Securities ETF | 0.01 | -5.38 | 0.28 | -3.10 | 0.1252 | -0.0075 | |||
| F / Ford Motor Company | 0.02 | -57.62 | 0.27 | -53.24 | 0.1221 | -0.1460 | |||
| XLK / The Select Sector SPDR Trust - The Technology Select Sector SPDR Fund | 0.01 | 0.00 | 0.27 | 5.38 | 0.1221 | 0.0031 | |||
| V / Visa Inc. | 0.00 | 0.27 | 0.0000 | ||||||
| J / Jacobs Solutions Inc. | 0.01 | -3.12 | 0.27 | -18.90 | 0.1186 | -0.0315 | |||
| EMR / Emerson Electric Co. | 0.00 | -17.45 | 0.26 | -17.87 | 0.1168 | -0.0292 | |||
| ACN / Accenture plc | 0.00 | -11.50 | 0.26 | -10.27 | 0.1168 | -0.0168 | |||
| CHRW / C.H. Robinson Worldwide, Inc. | 0.00 | -26.85 | 0.26 | -10.76 | 0.1146 | -0.0172 | |||
| MMM / 3M Company | 0.00 | 0.00 | 0.23 | 5.41 | 0.1043 | 0.0027 | |||
| RWX / SPDR Index Shares Funds - SPDR Dow Jones International Real Estate ETF | 0.01 | 0.00 | 0.23 | 7.41 | 0.1034 | 0.0046 | |||
| LMT / Lockheed Martin Corporation | 0.00 | 0.00 | 0.23 | -1.70 | 0.1030 | -0.0046 | |||
| NUE / Nucor Corporation | 0.00 | 0.00 | 0.23 | -2.55 | 0.1021 | -0.0055 | |||
| DOW / Dow Inc. | 0.00 | -6.26 | 0.20 | -8.52 | 0.0909 | -0.0111 | |||
| APD / Air Products and Chemicals, Inc. | 0.00 | 0.20 | 0.0000 | ||||||
| BMY / Bristol-Myers Squibb Company | 0.00 | 0.00 | 0.20 | -6.54 | 0.0891 | -0.0088 | |||
| HBAN / Huntington Bancshares Incorporated | 0.02 | 0.00 | 0.16 | -4.29 | 0.0695 | -0.0051 | |||
| APA / APA Corporation | 0.00 | -100.00 | 0.00 | -100.00 | -0.1085 | ||||
| PM / Philip Morris International Inc. | 0.00 | -100.00 | 0.00 | -100.00 | -0.1524 |