Statistik Asas
| Nilai Portfolio | $ 64,028,000 |
| Kedudukan Semasa | 31 |
Pegangan Terkini, Prestasi, AUM (dari 13F, 13D)
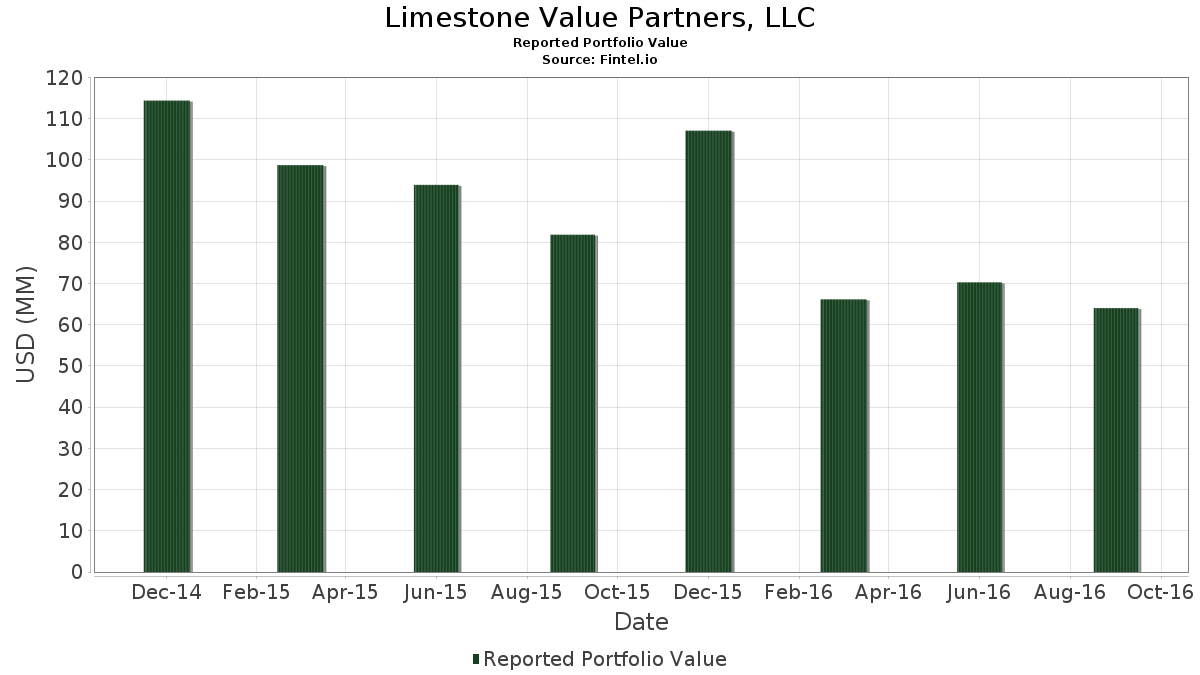
Limestone Value Partners, LLC telah mendedahkan 31 jumlah pegangan dalam pemfailan SEC terkini mereka. Nilai portfolio terkini dikira sebagai $ 64,028,000 USD. Aset Sebenar Di Bawah Pengurusan (AUM) ialah nilai ini ditambah dengan tunai (yang tidak didedahkan). Pegangan teratas Limestone Value Partners, LLC ialah MGIC Investment Corporation (US:MTG) , Western Asset Mortgage Opportunity Fund Inc. (US:DMO) , Realogy Holdings Corp (US:RLGY) , PGIM ETF Trust - PGIM Corporate Bond 5-10 Year ETF (US:PCI) , and PIMCO Dynamic Income Fund (US:XPDIX) . Kedudukan baharu Limestone Value Partners, LLC termasuk Interactive Brokers Group, Inc. (US:IBKR) , Calamos Convertible and High Income Fund (US:CHY) , SPDR S&P 500 ETF (US:SPY) , .
Kenaikan Teratas Suku Tahun Ini
Kami menggunakan perubahan dalam peruntukan portfolio kerana ini adalah metrik yang paling bermakna. Perubahan boleh disebabkan oleh perdagangan atau perubahan dalam harga saham.
| Sekuriti | Saham (MM) |
Nilai (MM$) |
Portfolio % | ΔPortfolio % |
|---|---|---|---|---|
| 0.63 | 5.06 | 7.9012 | 7.9012 | |
| 0.20 | 4.71 | 7.3577 | 7.3577 | |
| 0.17 | 4.47 | 6.9751 | 6.9751 | |
| 0.15 | 4.21 | 6.5752 | 6.5752 | |
| 0.01 | 3.02 | 4.7120 | 4.7120 | |
| 0.04 | 2.83 | 4.4215 | 4.4215 | |
| 0.21 | 2.66 | 4.1482 | 4.1482 | |
| 0.22 | 4.46 | 6.9610 | 3.1503 | |
| 0.31 | 3.38 | 5.2821 | 3.0907 | |
| 0.03 | 2.61 | 4.0810 | 2.6951 |
Penurunan Teratas Suku Tahun Ini
Kami menggunakan perubahan dalam peruntukan portfolio kerana ini adalah metrik yang paling bermakna. Perubahan boleh disebabkan oleh perdagangan atau perubahan dalam harga saham.
| Sekuriti | Saham (MM) |
Nilai (MM$) |
Portfolio % | ΔPortfolio % |
|---|---|---|---|---|
| 0.00 | 0.00 | -5.8085 | ||
| 0.00 | 0.00 | -3.3183 | ||
| 0.00 | 0.00 | -3.2771 | ||
| 0.04 | 2.18 | 3.4032 | -1.7735 | |
| 0.01 | 1.13 | 1.7664 | -1.6345 | |
| 0.03 | 0.52 | 0.8043 | -0.4550 | |
| 0.12 | 2.85 | 4.4434 | -0.0162 |
13F dan Pemfailan Dana
Borang ini telah difailkan pada 2016-11-10 untuk tempoh pelaporan 2016-09-30. Klik ikon pautan untuk melihat sejarah transaksi penuh.
Tingkatkan untuk membuka data premium dan eksport ke Excel ![]() .
.
| Sekuriti | Jenis | Purata Harga Saham | Saham (MM) |
ΔSaham (%) |
ΔSaham (%) |
Nilai ($MM) |
Portfolio (%) |
ΔPortfolio (%) |
|
|---|---|---|---|---|---|---|---|---|---|
| MTG / MGIC Investment Corporation | 0.63 | -13.65 | 5.06 | 16.09 | 7.9012 | 7.9012 | |||
| DMO / Western Asset Mortgage Opportunity Fund Inc. | 0.20 | 26.19 | 4.71 | 26.16 | 7.3577 | 7.3577 | |||
| RLGY / Realogy Holdings Corp | 0.17 | 0.00 | 4.47 | -10.89 | 6.9751 | 6.9751 | |||
| PCI / PGIM ETF Trust - PGIM Corporate Bond 5-10 Year ETF | 0.22 | 56.11 | 4.46 | 66.43 | 6.9610 | 3.1503 | |||
| XPDIX / PIMCO Dynamic Income Fund | 0.15 | -6.22 | 4.21 | -3.55 | 6.5752 | 6.5752 | |||
| JFR / Nuveen Floating Rate Income Fund | 0.31 | 110.06 | 3.38 | 119.61 | 5.2821 | 3.0907 | |||
| IR / Ingersoll Rand Inc. | 0.05 | 0.00 | 3.12 | 6.70 | 4.8760 | 0.7124 | |||
| ICE / Intercontinental Exchange, Inc. | 0.01 | -6.67 | 3.02 | -1.79 | 4.7120 | 4.7120 | |||
| FOXA / Fox Corporation | 0.12 | 0.00 | 2.85 | -9.22 | 4.4434 | -0.0162 | |||
| BBWI / Bath & Body Works, Inc. | 0.04 | 0.00 | 2.83 | 5.44 | 4.4215 | 4.4215 | |||
| GOOG / Alphabet Inc. | 0.00 | 75.00 | 2.72 | 96.60 | 4.2497 | 2.2803 | |||
| WFC.WS / Wells Fargo & Co. (Warrant) | 0.21 | 73.26 | 2.66 | 58.76 | 4.1482 | 4.1482 | |||
| CME / CME Group Inc. | 0.03 | 150.00 | 2.61 | 168.28 | 4.0810 | 2.6951 | |||
| SRG / Seritage Growth Properties | 0.04 | -41.10 | 2.18 | -40.10 | 3.4032 | -1.7735 | |||
| US0268741560 / American International Group, Inc. Warrants | 0.08 | 4.40 | 1.71 | 18.40 | 2.6629 | 0.6138 | |||
| US1182301010 / Buckeye Partners, L.P. | 0.02 | 0.00 | 1.61 | -3.01 | 2.5161 | 2.5161 | |||
| AFI / Armstrong Flooring Inc | 0.08 | 69.90 | 1.60 | 89.15 | 2.5052 | 2.5052 | |||
| IBKR / Interactive Brokers Group, Inc. | 0.04 | 1.48 | 2.3131 | 2.3131 | |||||
| WFC / Wells Fargo & Company | 0.03 | 1.33 | 2.0741 | 2.0741 | |||||
| PAA / Plains All American Pipeline, L.P. - Limited Partnership | 0.04 | -41.01 | 1.29 | -37.14 | 2.0116 | 2.0116 | |||
| EPD / Enterprise Products Partners L.P. - Limited Partnership | 0.04 | -18.18 | 1.24 | -23.55 | 1.9413 | 1.9413 | |||
| AAPL / Apple Inc. | 0.01 | -60.00 | 1.13 | -52.68 | 1.7664 | -1.6345 | |||
| SPY / SPDR S&P 500 ETF | 0.00 | -37.67 | 0.89 | -37.54 | 1.3853 | 1.3853 | |||
| CHY / Calamos Convertible and High Income Fund | 0.07 | 0.73 | 1.1339 | 1.1339 | |||||
| PMF / PIMCO Municipal Income Fund | 0.03 | 0.00 | 0.53 | 0.95 | 0.8293 | 0.8293 | |||
| MMP / Magellan Midstream Partners L.P. | 0.01 | 0.00 | 0.53 | -4.67 | 0.8293 | 0.8293 | |||
| CMA / Comerica Incorporated | 0.03 | -58.78 | 0.52 | -41.81 | 0.8043 | -0.4550 | |||
| IDCC / InterDigital, Inc. | 0.01 | 0.00 | 0.40 | 38.95 | 0.6185 | 0.6185 | |||
| SPY / SPDR S&P 500 ETF | Put | 0.07 | 0.32 | 0.4998 | 0.4998 | ||||
| TEGP / Tallgrass Energy GP, LP | 0.01 | 0.00 | 0.25 | 6.47 | 0.3858 | 0.3858 | |||
| PHYS / Sprott Physical Gold Trust | 0.02 | 0.00 | 0.21 | -0.92 | 0.3358 | 0.3358 | |||
| WBA / Walgreens Boots Alliance, Inc. | 0.00 | -100.00 | 0.00 | -100.00 | -3.3183 | ||||
| IEF / iShares Trust - iShares 7-10 Year Treasury Bond ETF | 0.00 | -100.00 | 0.00 | -100.00 | 0.0000 | ||||
| IBTX / Independent Bank Group, Inc. | 0.00 | -100.00 | 0.00 | -100.00 | 0.0000 | ||||
| PSLV / Sprott Physical Silver Trust | 0.00 | -100.00 | 0.00 | -100.00 | 0.0000 | ||||
| MSFT / Microsoft Corporation | 0.00 | -100.00 | 0.00 | -100.00 | -3.2771 | ||||
| SBAC / SBA Communications Corporation | 0.00 | -100.00 | 0.00 | -100.00 | -5.8085 | ||||
| PYPL / PayPal Holdings, Inc. | 0.00 | -100.00 | 0.00 | -100.00 | 0.0000 | ||||
| SCM / Stellus Capital Investment Corporation | 0.00 | -100.00 | 0.00 | -100.00 | 0.0000 |