Statistik Asas
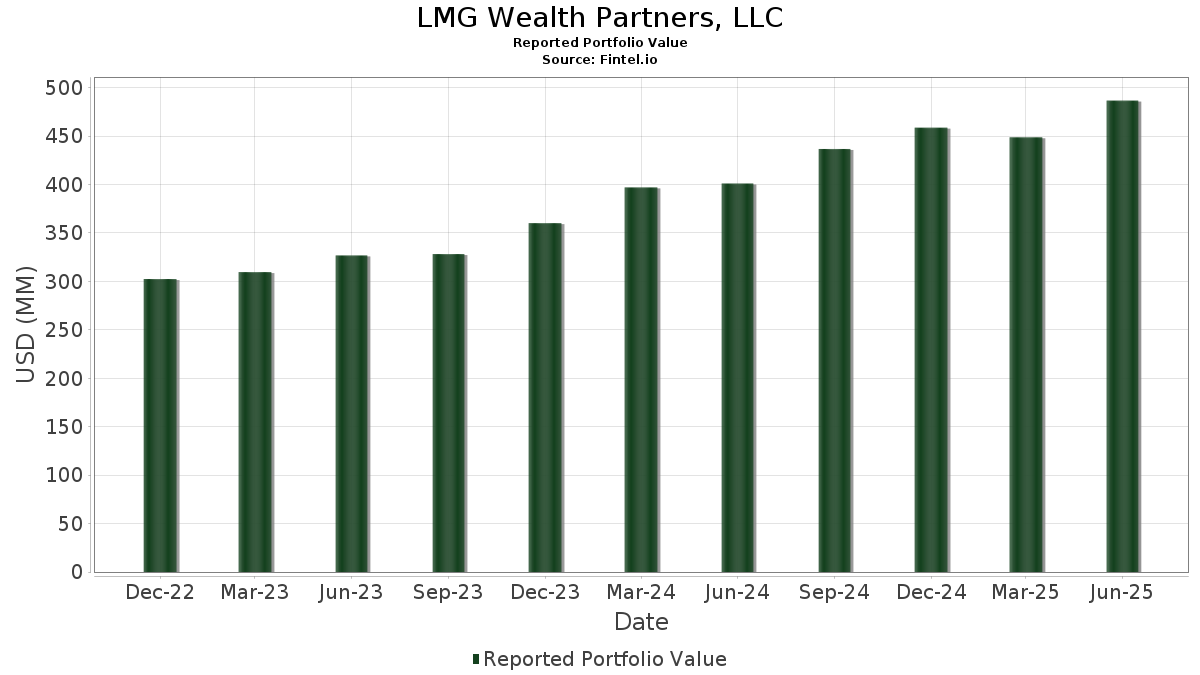
| Nilai Portfolio | $ 486,695,757 |
| Kedudukan Semasa | 139 |
Pegangan Terkini, Prestasi, AUM (dari 13F, 13D)
LMG Wealth Partners, LLC telah mendedahkan 139 jumlah pegangan dalam pemfailan SEC terkini mereka. Nilai portfolio terkini dikira sebagai $ 486,695,757 USD. Aset Sebenar Di Bawah Pengurusan (AUM) ialah nilai ini ditambah dengan tunai (yang tidak didedahkan). Pegangan teratas LMG Wealth Partners, LLC ialah iShares Trust - iShares S&P 500 Growth ETF (US:IVW) , Walmart Inc. (US:WMT) , Microsoft Corporation (US:MSFT) , Apple Inc. (US:AAPL) , and Vanguard Index Funds - Vanguard Small-Cap Value ETF (US:VBR) . Kedudukan baharu LMG Wealth Partners, LLC termasuk Kimberly-Clark Corporation (US:KMB) , Stride, Inc. (US:LRN) , Vanguard Index Funds - Vanguard S&P 500 ETF (US:VOO) , iShares Trust - iShares Core S&P 500 ETF (US:IVV) , and Grayscale Bitcoin Mini Trust (US:BTC) .
Kenaikan Teratas Suku Tahun Ini
Kami menggunakan perubahan dalam peruntukan portfolio kerana ini adalah metrik yang paling bermakna. Perubahan boleh disebabkan oleh perdagangan atau perubahan dalam harga saham.
| Sekuriti | Saham (MM) |
Nilai (MM$) |
Portfolio % | ΔPortfolio % |
|---|---|---|---|---|
| 0.05 | 3.80 | 0.7813 | 0.6114 | |
| 0.03 | 16.89 | 3.4705 | 0.6113 | |
| 0.33 | 36.83 | 7.5677 | 0.5669 | |
| 0.03 | 4.83 | 0.9914 | 0.4433 | |
| 0.01 | 2.73 | 0.5613 | 0.2725 | |
| 0.01 | 1.29 | 0.2658 | 0.2658 | |
| 0.01 | 1.16 | 0.2393 | 0.2393 | |
| 0.02 | 11.06 | 2.2724 | 0.2051 | |
| 0.10 | 13.65 | 2.8039 | 0.1995 | |
| 0.00 | 0.83 | 0.1696 | 0.1696 |
Penurunan Teratas Suku Tahun Ini
Kami menggunakan perubahan dalam peruntukan portfolio kerana ini adalah metrik yang paling bermakna. Perubahan boleh disebabkan oleh perdagangan atau perubahan dalam harga saham.
| Sekuriti | Saham (MM) |
Nilai (MM$) |
Portfolio % | ΔPortfolio % |
|---|---|---|---|---|
| 0.07 | 14.97 | 3.0762 | -0.5433 | |
| 0.07 | 10.38 | 2.1334 | -0.4976 | |
| 0.06 | 9.86 | 2.0267 | -0.3359 | |
| 0.06 | 6.59 | 1.3541 | -0.2452 | |
| 0.05 | 6.75 | 1.3873 | -0.2380 | |
| 0.01 | 5.97 | 1.2265 | -0.2322 | |
| 0.12 | 11.96 | 2.4575 | -0.2021 | |
| 0.06 | 6.07 | 1.2464 | -0.1859 | |
| 0.02 | 4.03 | 0.8285 | -0.1830 | |
| 0.05 | 2.21 | 0.4540 | -0.1813 |
13F dan Pemfailan Dana
Borang ini telah difailkan pada 2025-07-29 untuk tempoh pelaporan 2025-06-30. Klik ikon pautan untuk melihat sejarah transaksi penuh.
Tingkatkan untuk membuka data premium dan eksport ke Excel ![]() .
.
| Sekuriti | Jenis | Purata Harga Saham | Saham (MM) |
ΔSaham (%) |
ΔSaham (%) |
Nilai ($MM) |
Portfolio (%) |
ΔPortfolio (%) |
|
|---|---|---|---|---|---|---|---|---|---|
| IVW / iShares Trust - iShares S&P 500 Growth ETF | 0.33 | -1.16 | 36.83 | 17.23 | 7.5677 | 0.5669 | |||
| WMT / Walmart Inc. | 0.17 | -0.90 | 16.96 | 10.38 | 3.4844 | 0.0609 | |||
| MSFT / Microsoft Corporation | 0.03 | -0.65 | 16.89 | 31.63 | 3.4705 | 0.6113 | |||
| AAPL / Apple Inc. | 0.07 | -0.21 | 14.97 | -7.83 | 3.0762 | -0.5433 | |||
| VBR / Vanguard Index Funds - Vanguard Small-Cap Value ETF | 0.08 | -0.03 | 14.71 | 4.65 | 3.0230 | -0.1098 | |||
| IWP / iShares Trust - iShares Russell Mid-Cap Growth ETF | 0.10 | -1.08 | 13.65 | 16.76 | 2.8039 | 0.1995 | |||
| IWO / iShares Trust - iShares Russell 2000 Growth ETF | 0.04 | -0.31 | 12.77 | 11.52 | 2.6238 | 0.0723 | |||
| AGG / iShares Trust - iShares Core U.S. Aggregate Bond ETF | 0.12 | -0.07 | 11.96 | 0.21 | 2.4575 | -0.2021 | |||
| SPY / SPDR S&P 500 ETF | 0.02 | 7.93 | 11.06 | 19.21 | 2.2724 | 0.2051 | |||
| CVX / Chevron Corporation | 0.07 | 2.74 | 10.38 | -12.06 | 2.1334 | -0.4976 | |||
| CAH / Cardinal Health, Inc. | 0.06 | -23.71 | 9.86 | -6.97 | 2.0267 | -0.3359 | |||
| RTX / RTX Corporation | 0.07 | -0.86 | 9.86 | 9.29 | 2.0252 | 0.0156 | |||
| DIVI / Franklin Templeton ETF Trust - Franklin International Core Dividend Tilt Index ETF | 0.25 | 2.31 | 8.90 | 11.88 | 1.8284 | 0.0562 | |||
| AMZN / Amazon.com, Inc. | 0.04 | 0.28 | 8.76 | 15.64 | 1.7990 | 0.1118 | |||
| IVE / iShares Trust - iShares S&P 500 Value ETF | 0.04 | -0.10 | 8.71 | 2.44 | 1.7888 | -0.1050 | |||
| PRU / Prudential Financial, Inc. | 0.07 | 1.80 | 7.94 | -2.06 | 1.6323 | -0.1752 | |||
| XMMO / Invesco Exchange-Traded Fund Trust - Invesco S&P MidCap Momentum ETF | 0.06 | -0.26 | 7.71 | 12.77 | 1.5838 | 0.0608 | |||
| VIOG / Vanguard Admiral Funds - Vanguard S&P Small-Cap 600 Growth ETF | 0.07 | 0.05 | 7.51 | 7.12 | 1.5434 | -0.0192 | |||
| EMR / Emerson Electric Co. | 0.06 | -0.43 | 7.39 | 21.08 | 1.5188 | 0.1584 | |||
| IJJ / iShares Trust - iShares S&P Mid-Cap 400 Value ETF | 0.06 | 1.49 | 7.30 | 4.75 | 1.5009 | -0.0530 | |||
| NOBL / ProShares Trust - ProShares S&P 500 Dividend Aristocrats ETF | 0.07 | -1.41 | 7.18 | -2.83 | 1.4753 | -0.1714 | |||
| PEP / PepsiCo, Inc. | 0.05 | 5.12 | 6.75 | -7.43 | 1.3873 | -0.2380 | |||
| XOM / Exxon Mobil Corporation | 0.06 | 1.30 | 6.59 | -8.18 | 1.3541 | -0.2452 | |||
| RJF / Raymond James Financial, Inc. | 0.04 | 0.87 | 6.20 | 11.37 | 1.2744 | 0.0334 | |||
| AFL / Aflac Incorporated | 0.06 | -0.49 | 6.07 | -5.63 | 1.2464 | -0.1859 | |||
| BRK.B / Berkshire Hathaway Inc. | 0.01 | -0.02 | 5.97 | -8.80 | 1.2265 | -0.2322 | |||
| USB / U.S. Bancorp | 0.13 | 2.33 | 5.92 | 9.67 | 1.2162 | 0.0136 | |||
| VNQ / Vanguard Specialized Funds - Vanguard Real Estate ETF | 0.06 | 0.51 | 5.74 | -1.14 | 1.1788 | -0.1143 | |||
| ADP / Automatic Data Processing, Inc. | 0.02 | -0.42 | 5.69 | 0.51 | 1.1699 | -0.0924 | |||
| MCD / McDonald's Corporation | 0.02 | 2.45 | 5.57 | -4.18 | 1.1440 | -0.1508 | |||
| LOW / Lowe's Companies, Inc. | 0.02 | 0.26 | 5.35 | -4.63 | 1.0994 | -0.1507 | |||
| VFH / Vanguard World Fund - Vanguard Financials ETF | 0.04 | -0.91 | 5.15 | 5.57 | 1.0591 | -0.0288 | |||
| DVY / iShares Trust - iShares Select Dividend ETF | 0.04 | -1.04 | 4.96 | -2.13 | 1.0186 | -0.1101 | |||
| CLS / Celestica Inc. | 0.03 | -0.98 | 4.83 | 96.22 | 0.9914 | 0.4433 | |||
| O / Realty Income Corporation | 0.08 | 4.62 | 4.54 | 3.91 | 0.9326 | -0.0409 | |||
| SYY / Sysco Corporation | 0.06 | 0.51 | 4.46 | 1.46 | 0.9169 | -0.0633 | |||
| BNDX / Vanguard Charlotte Funds - Vanguard Total International Bond ETF | 0.09 | 0.92 | 4.41 | 2.32 | 0.9053 | -0.0540 | |||
| ALL / The Allstate Corporation | 0.02 | -0.09 | 4.33 | -2.87 | 0.8901 | -0.1038 | |||
| JNJ / Johnson & Johnson | 0.03 | 2.79 | 4.30 | -5.33 | 0.8831 | -0.1285 | |||
| CB / Chubb Limited | 0.01 | 1.26 | 4.07 | -2.84 | 0.8353 | -0.0972 | |||
| ABBV / AbbVie Inc. | 0.02 | 0.27 | 4.03 | -11.15 | 0.8285 | -0.1830 | |||
| CAT / Caterpillar Inc. | 0.01 | 3.25 | 3.99 | 21.53 | 0.8202 | 0.0883 | |||
| TSLA / Tesla, Inc. | 0.01 | 6.72 | 3.95 | 30.84 | 0.8125 | 0.1389 | |||
| EEMV / iShares, Inc. - iShares MSCI Emerging Markets Min Vol Factor ETF | 0.06 | -0.65 | 3.90 | 6.93 | 0.8021 | -0.0113 | |||
| JPM / JPMorgan Chase & Co. | 0.01 | 1.68 | 3.85 | 20.16 | 0.7902 | 0.0771 | |||
| FDX / FedEx Corporation | 0.02 | -0.09 | 3.84 | -6.84 | 0.7893 | -0.1295 | |||
| WFC / Wells Fargo & Company | 0.05 | 346.89 | 3.80 | 398.95 | 0.7813 | 0.6114 | |||
| DIS / The Walt Disney Company | 0.03 | -0.05 | 3.49 | 25.59 | 0.7180 | 0.0980 | |||
| REGL / ProShares Trust - ProShares S&P Midcap 400 Dividend Aristocrats ETF | 0.04 | -0.96 | 3.14 | 0.13 | 0.6445 | -0.0536 | |||
| ADM / Archer-Daniels-Midland Company | 0.06 | 1.85 | 3.04 | 11.97 | 0.6248 | 0.0196 | |||
| PG / The Procter & Gamble Company | 0.02 | 2.33 | 2.93 | -4.35 | 0.6013 | -0.0804 | |||
| ABNB / Airbnb, Inc. | 0.02 | 2.49 | 2.78 | 13.56 | 0.5715 | 0.0256 | |||
| APP / AppLovin Corporation | 0.01 | 0.49 | 2.78 | 32.78 | 0.5712 | 0.1046 | |||
| STRL / Sterling Infrastructure, Inc. | 0.01 | 3.42 | 2.73 | 110.73 | 0.5613 | 0.2725 | |||
| ROP / Roper Technologies, Inc. | 0.00 | 7.69 | 2.69 | 3.54 | 0.5531 | -0.0262 | |||
| ETN / Eaton Corporation plc | 0.01 | -18.29 | 2.69 | 7.31 | 0.5518 | -0.0059 | |||
| CSCO / Cisco Systems, Inc. | 0.04 | 3.41 | 2.68 | 16.24 | 0.5516 | 0.0371 | |||
| GOOG / Alphabet Inc. | 0.01 | 1.27 | 2.66 | 14.98 | 0.5457 | 0.0310 | |||
| VERSX / Vanguard Emerging Markets Stock Index Fund | 0.05 | 2.22 | 2.62 | 11.73 | 0.5384 | 0.0157 | |||
| VZ / Verizon Communications Inc. | 0.06 | 0.04 | 2.44 | -4.57 | 0.5023 | -0.0685 | |||
| T / AT&T Inc. | 0.08 | -0.88 | 2.38 | 1.41 | 0.4883 | -0.0338 | |||
| OKTA / Okta, Inc. | 0.02 | 0.25 | 2.33 | -4.75 | 0.4782 | -0.0663 | |||
| BMY / Bristol-Myers Squibb Company | 0.05 | 2.12 | 2.21 | -22.49 | 0.4540 | -0.1813 | |||
| SKYW / SkyWest, Inc. | 0.02 | 0.96 | 2.19 | 19.00 | 0.4493 | 0.0398 | |||
| GOOGL / Alphabet Inc. | 0.01 | 3.51 | 2.10 | 17.94 | 0.4324 | 0.0349 | |||
| KO / The Coca-Cola Company | 0.03 | 5.00 | 2.09 | 3.71 | 0.4303 | -0.0196 | |||
| MRK / Merck & Co., Inc. | 0.03 | 7.06 | 2.02 | -5.58 | 0.4142 | -0.0615 | |||
| CAAP / Corporación América Airports S.A. | 0.10 | 3.01 | 1.99 | 14.07 | 0.4082 | 0.0200 | |||
| BSM / Black Stone Minerals, L.P. - Limited Partnership | 0.15 | 0.00 | 1.97 | -14.34 | 0.4038 | -0.1074 | |||
| PKG / Packaging Corporation of America | 0.01 | 6.85 | 1.95 | 1.73 | 0.3997 | -0.0266 | |||
| PAYX / Paychex, Inc. | 0.01 | 5.33 | 1.92 | -0.67 | 0.3940 | -0.0363 | |||
| SO / The Southern Company | 0.02 | 5.91 | 1.92 | 5.80 | 0.3937 | -0.0100 | |||
| MFC / Manulife Financial Corporation | 0.06 | 3.09 | 1.91 | 5.77 | 0.3920 | -0.0099 | |||
| CRM / Salesforce, Inc. | 0.01 | 4.05 | 1.74 | 5.73 | 0.3566 | -0.0092 | |||
| LNT / Alliant Energy Corporation | 0.03 | 0.20 | 1.73 | -5.86 | 0.3565 | -0.0541 | |||
| QTWO / Q2 Holdings, Inc. | 0.02 | 4.72 | 1.64 | 22.44 | 0.3365 | 0.0386 | |||
| RGA / Reinsurance Group of America, Incorporated | 0.01 | 3.58 | 1.62 | 4.37 | 0.3335 | -0.0131 | |||
| PYPL / PayPal Holdings, Inc. | 0.02 | 7.56 | 1.59 | 22.55 | 0.3261 | 0.0374 | |||
| GRBK / Green Brick Partners, Inc. | 0.02 | 6.41 | 1.56 | 14.80 | 0.3204 | 0.0176 | |||
| BX / Blackstone Inc. | 0.01 | 9.07 | 1.54 | 16.74 | 0.3167 | 0.0224 | |||
| ETR / Entergy Corporation | 0.02 | 0.02 | 1.47 | -2.77 | 0.3025 | -0.0348 | |||
| TGT / Target Corporation | 0.01 | 26.54 | 1.37 | 19.56 | 0.2814 | 0.0263 | |||
| ITRN / Ituran Location and Control Ltd. | 0.03 | 10.34 | 1.35 | 18.25 | 0.2782 | 0.0229 | |||
| DUK / Duke Energy Corporation | 0.01 | 0.00 | 1.32 | -3.22 | 0.2721 | -0.0329 | |||
| DRI / Darden Restaurants, Inc. | 0.01 | 18.71 | 1.31 | 24.50 | 0.2685 | 0.0347 | |||
| KMB / Kimberly-Clark Corporation | 0.01 | 1.29 | 0.2658 | 0.2658 | |||||
| NVDA / NVIDIA Corporation | 0.01 | 9.78 | 1.22 | 60.13 | 0.2502 | 0.0807 | |||
| LRN / Stride, Inc. | 0.01 | 1.16 | 0.2393 | 0.2393 | |||||
| HPQ / HP Inc. | 0.05 | 34.16 | 1.12 | 18.48 | 0.2307 | 0.0196 | |||
| GPC / Genuine Parts Company | 0.01 | 33.79 | 1.12 | 36.14 | 0.2293 | 0.0467 | |||
| ET / Energy Transfer LP - Limited Partnership | 0.06 | -0.02 | 1.09 | -2.50 | 0.2240 | -0.0251 | |||
| IBM / International Business Machines Corporation | 0.00 | 0.42 | 0.99 | 19.01 | 0.2033 | 0.0181 | |||
| HD / The Home Depot, Inc. | 0.00 | 0.04 | 0.83 | 0.12 | 0.1709 | -0.0143 | |||
| VOO / Vanguard Index Funds - Vanguard S&P 500 ETF | 0.00 | 0.83 | 0.1696 | 0.1696 | |||||
| IVV / iShares Trust - iShares Core S&P 500 ETF | 0.00 | 0.81 | 0.1670 | 0.1670 | |||||
| RCL / Royal Caribbean Cruises Ltd. | 0.00 | 13.79 | 0.70 | 73.33 | 0.1444 | 0.0541 | |||
| EAT / Brinker International, Inc. | 0.00 | 9.21 | 0.70 | 32.26 | 0.1441 | 0.0258 | |||
| VTV / Vanguard Index Funds - Vanguard Value ETF | 0.00 | -4.55 | 0.65 | -2.40 | 0.1340 | -0.0148 | |||
| BAC / Bank of America Corporation | 0.01 | 0.22 | 0.55 | 13.49 | 0.1126 | 0.0051 | |||
| MCK / McKesson Corporation | 0.00 | 0.00 | 0.50 | 8.86 | 0.1037 | 0.0004 | |||
| BTC / Grayscale Bitcoin Mini Trust | 0.01 | 0.50 | 0.1034 | 0.1034 | |||||
| MPC / Marathon Petroleum Corporation | 0.00 | 0.20 | 0.49 | 14.29 | 0.1003 | 0.0051 | |||
| VIG / Vanguard Specialized Funds - Vanguard Dividend Appreciation ETF | 0.00 | 0.00 | 0.48 | 5.51 | 0.0985 | -0.0028 | |||
| VEU / Vanguard International Equity Index Funds - Vanguard FTSE All-World ex-US ETF | 0.01 | 0.00 | 0.43 | 10.74 | 0.0891 | 0.0019 | |||
| AEP / American Electric Power Company, Inc. | 0.00 | 0.00 | 0.43 | -4.92 | 0.0873 | -0.0124 | |||
| PFE / Pfizer Inc. | 0.02 | 0.00 | 0.40 | -4.49 | 0.0832 | -0.0111 | |||
| EEM / iShares, Inc. - iShares MSCI Emerging Markets ETF | 0.01 | 0.00 | 0.39 | 10.32 | 0.0793 | 0.0014 | |||
| IWN / iShares Trust - iShares Russell 2000 Value ETF | 0.00 | 0.00 | 0.38 | 4.43 | 0.0775 | -0.0029 | |||
| AVGO / Broadcom Inc. | 0.00 | 0.00 | 0.37 | 64.76 | 0.0770 | 0.0263 | |||
| AZO / AutoZone, Inc. | 0.00 | 0.00 | 0.37 | -2.62 | 0.0763 | -0.0087 | |||
| VOE / Vanguard Index Funds - Vanguard Mid-Cap Value ETF | 0.00 | 0.00 | 0.36 | 2.27 | 0.0744 | -0.0044 | |||
| GBTC / Grayscale Bitcoin Trust (BTC) | 0.00 | -44.36 | 0.36 | -27.62 | 0.0738 | -0.0367 | |||
| WM / Waste Management, Inc. | 0.00 | 0.33 | 0.35 | -0.85 | 0.0718 | -0.0067 | |||
| UPS / United Parcel Service, Inc. | 0.00 | 1.14 | 0.34 | -7.08 | 0.0701 | -0.0118 | |||
| CALM / Cal-Maine Foods, Inc. | 0.00 | 0.00 | 0.34 | 9.39 | 0.0696 | 0.0007 | |||
| VB / Vanguard Index Funds - Vanguard Small-Cap ETF | 0.00 | 0.31 | 0.0640 | 0.0640 | |||||
| VO / Vanguard Index Funds - Vanguard Mid-Cap ETF | 0.00 | 0.30 | 0.0622 | 0.0622 | |||||
| IJR / iShares Trust - iShares Core S&P Small-Cap ETF | 0.00 | 1.02 | 0.30 | 5.61 | 0.0620 | -0.0017 | |||
| RSG / Republic Services, Inc. | 0.00 | 0.00 | 0.30 | 2.04 | 0.0617 | -0.0040 | |||
| ABT / Abbott Laboratories | 0.00 | -4.35 | 0.28 | -1.75 | 0.0578 | -0.0061 | |||
| ORCL / Oracle Corporation | 0.00 | 0.28 | 0.0569 | 0.0569 | |||||
| QQQ / Invesco QQQ Trust, Series 1 | 0.00 | 9.47 | 0.27 | 29.25 | 0.0563 | 0.0089 | |||
| CP / Canadian Pacific Kansas City Limited | 0.00 | 0.00 | 0.27 | 13.19 | 0.0547 | 0.0022 | |||
| OKE / ONEOK, Inc. | 0.00 | 0.27 | 0.0546 | 0.0546 | |||||
| TXN / Texas Instruments Incorporated | 0.00 | 0.00 | 0.26 | 15.49 | 0.0537 | 0.0033 | |||
| SLVM / Sylvamo Corporation | 0.01 | 0.26 | 0.0533 | 0.0533 | |||||
| META / Meta Platforms, Inc. | 0.00 | 0.00 | 0.26 | 27.86 | 0.0529 | 0.0081 | |||
| COF / Capital One Financial Corporation | 0.00 | 0.25 | 0.0522 | 0.0522 | |||||
| GD / General Dynamics Corporation | 0.00 | 0.00 | 0.25 | 6.84 | 0.0515 | -0.0007 | |||
| CSX / CSX Corporation | 0.01 | 0.00 | 0.25 | 10.71 | 0.0510 | 0.0011 | |||
| BA / The Boeing Company | 0.00 | 0.23 | 0.0472 | 0.0472 | |||||
| NEE / NextEra Energy, Inc. | 0.00 | 0.00 | 0.22 | -2.19 | 0.0459 | -0.0049 | |||
| SPG / Simon Property Group, Inc. | 0.00 | 0.00 | 0.22 | -3.10 | 0.0451 | -0.0054 | |||
| CMI / Cummins Inc. | 0.00 | 0.21 | 0.0423 | 0.0423 | |||||
| XLK / The Select Sector SPDR Trust - The Technology Select Sector SPDR Fund | 0.00 | 0.20 | 0.0418 | 0.0418 | |||||
| F / Ford Motor Company | 0.02 | 0.00 | 0.17 | 7.79 | 0.0343 | -0.0001 | |||
| NTLA / Intellia Therapeutics, Inc. | 0.01 | -2.09 | 0.13 | 29.70 | 0.0270 | 0.0043 | |||
| STLA / Stellantis N.V. | 0.01 | 0.12 | 0.0240 | 0.0240 | |||||
| CLF / Cleveland-Cliffs Inc. | 0.01 | 0.00 | 0.08 | -7.32 | 0.0156 | -0.0027 | |||
| PGR / The Progressive Corporation | 0.00 | -100.00 | 0.00 | 0.0000 | |||||
| GIS / General Mills, Inc. | 0.00 | -100.00 | 0.00 | 0.0000 | |||||
| ANF / Abercrombie & Fitch Co. | 0.00 | -100.00 | 0.00 | 0.0000 | |||||
| PDCO / Patterson Companies, Inc. | 0.00 | -100.00 | 0.00 | 0.0000 |