Statistik Asas
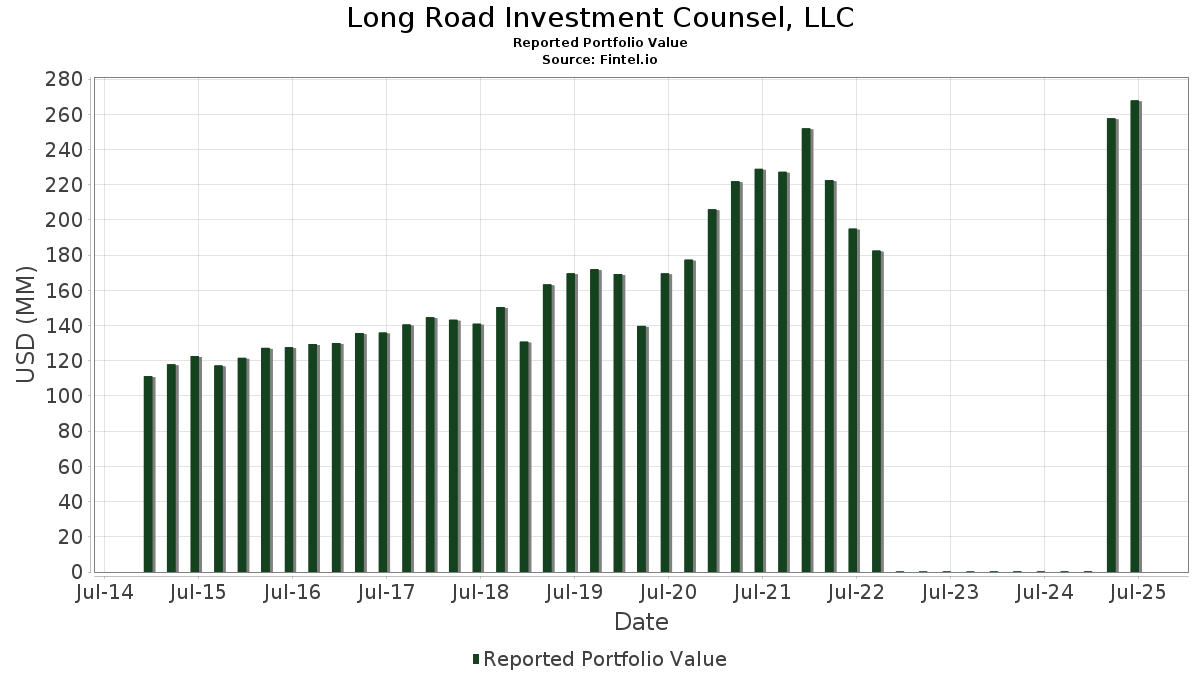
| Nilai Portfolio | $ 267,811,747 |
| Kedudukan Semasa | 80 |
Pegangan Terkini, Prestasi, AUM (dari 13F, 13D)
Long Road Investment Counsel, LLC telah mendedahkan 80 jumlah pegangan dalam pemfailan SEC terkini mereka. Nilai portfolio terkini dikira sebagai $ 267,811,747 USD. Aset Sebenar Di Bawah Pengurusan (AUM) ialah nilai ini ditambah dengan tunai (yang tidak didedahkan). Pegangan teratas Long Road Investment Counsel, LLC ialah O'Reilly Automotive, Inc. (US:ORLY) , Stryker Corporation (US:SYK) , Automatic Data Processing, Inc. (US:ADP) , Oracle Corporation (US:ORCL) , and Fastenal Company (US:FAST) . Kedudukan baharu Long Road Investment Counsel, LLC termasuk Northern Trust Corporation (US:NTRS) , Morgan Stanley (US:MS) , .
Kenaikan Teratas Suku Tahun Ini
Kami menggunakan perubahan dalam peruntukan portfolio kerana ini adalah metrik yang paling bermakna. Perubahan boleh disebabkan oleh perdagangan atau perubahan dalam harga saham.
| Sekuriti | Saham (MM) |
Nilai (MM$) |
Portfolio % | ΔPortfolio % |
|---|---|---|---|---|
| 0.07 | 15.57 | 5.8127 | 1.9044 | |
| 0.01 | 5.94 | 2.2194 | 0.3765 | |
| 0.00 | 1.66 | 0.6181 | 0.3447 | |
| 0.01 | 4.07 | 1.5205 | 0.2885 | |
| 0.00 | 1.89 | 0.7057 | 0.2804 | |
| 0.01 | 3.69 | 1.3778 | 0.2584 | |
| 0.05 | 8.67 | 3.2363 | 0.2465 | |
| 0.05 | 8.55 | 3.1918 | 0.2207 | |
| 0.04 | 2.71 | 1.0137 | 0.1912 | |
| 0.00 | 2.27 | 0.8482 | 0.1756 |
Penurunan Teratas Suku Tahun Ini
Kami menggunakan perubahan dalam peruntukan portfolio kerana ini adalah metrik yang paling bermakna. Perubahan boleh disebabkan oleh perdagangan atau perubahan dalam harga saham.
| Sekuriti | Saham (MM) |
Nilai (MM$) |
Portfolio % | ΔPortfolio % |
|---|---|---|---|---|
| 0.33 | 29.86 | 11.1495 | -1.1879 | |
| 0.03 | 6.43 | 2.4018 | -0.4820 | |
| 0.08 | 5.25 | 1.9595 | -0.4084 | |
| 0.02 | 2.80 | 1.0440 | -0.4079 | |
| 0.01 | 3.05 | 1.1394 | -0.3324 | |
| 0.07 | 6.19 | 2.3119 | -0.2985 | |
| 0.05 | 3.66 | 1.3655 | -0.2694 | |
| 0.03 | 3.75 | 1.3987 | -0.2481 | |
| 0.05 | 16.32 | 6.0951 | -0.2167 | |
| 0.04 | 4.66 | 1.7405 | -0.2014 |
13F dan Pemfailan Dana
Borang ini telah difailkan pada 2025-08-11 untuk tempoh pelaporan 2025-06-30. Klik ikon pautan untuk melihat sejarah transaksi penuh.
Tingkatkan untuk membuka data premium dan eksport ke Excel ![]() .
.
| Sekuriti | Jenis | Purata Harga Saham | Saham (MM) |
ΔSaham (%) |
ΔSaham (%) |
Nilai ($MM) |
Portfolio (%) |
ΔPortfolio (%) |
|
|---|---|---|---|---|---|---|---|---|---|
| ORLY / O'Reilly Automotive, Inc. | 0.33 | 1,392.99 | 29.86 | -6.07 | 11.1495 | -1.1879 | |||
| SYK / Stryker Corporation | 0.04 | -0.23 | 16.80 | 6.03 | 6.2719 | 0.1238 | |||
| ADP / Automatic Data Processing, Inc. | 0.05 | -0.56 | 16.32 | 0.37 | 6.0951 | -0.2167 | |||
| ORCL / Oracle Corporation | 0.07 | -1.15 | 15.57 | 54.59 | 5.8127 | 1.9044 | |||
| FAST / Fastenal Company | 0.25 | 96.80 | 10.33 | 6.58 | 3.8578 | 0.0957 | |||
| ITW / Illinois Tool Works Inc. | 0.04 | 0.01 | 9.65 | -0.30 | 3.6036 | -0.1530 | |||
| ICE / Intercontinental Exchange, Inc. | 0.05 | -0.98 | 9.26 | 5.32 | 3.4586 | 0.0452 | |||
| GOOG / Alphabet Inc. | 0.05 | -0.91 | 8.67 | 12.51 | 3.2363 | 0.2465 | |||
| GOOGL / Alphabet Inc. | 0.05 | -2.02 | 8.55 | 11.67 | 3.1918 | 0.2207 | |||
| AAPL / Apple Inc. | 0.03 | -6.28 | 6.43 | -13.43 | 2.4018 | -0.4820 | |||
| SBUX / Starbucks Corporation | 0.07 | -1.46 | 6.19 | -7.95 | 2.3119 | -0.2985 | |||
| RBA / RB Global, Inc. | 0.06 | -0.92 | 6.00 | 4.89 | 2.2409 | 0.0205 | |||
| IDXX / IDEXX Laboratories, Inc. | 0.01 | -1.99 | 5.94 | 25.17 | 2.2194 | 0.3765 | |||
| ACN / Accenture plc | 0.02 | 0.85 | 5.31 | -3.40 | 1.9832 | -0.1506 | |||
| KMX / CarMax, Inc. | 0.08 | -0.28 | 5.25 | -14.00 | 1.9595 | -0.4084 | |||
| AFL / Aflac Incorporated | 0.04 | -1.78 | 4.66 | -6.84 | 1.7405 | -0.2014 | |||
| EXPD / Expeditors International of Washington, Inc. | 0.04 | 0.18 | 4.35 | -4.82 | 1.6241 | -0.1494 | |||
| BR / Broadridge Financial Solutions, Inc. | 0.02 | -0.72 | 4.19 | -0.48 | 1.5631 | -0.0695 | |||
| APD / Air Products and Chemicals, Inc. | 0.01 | -0.27 | 4.12 | -4.63 | 1.5393 | -0.1382 | |||
| INTU / Intuit Inc. | 0.01 | 0.00 | 4.07 | 28.29 | 1.5205 | 0.2885 | |||
| WEX / WEX Inc. | 0.03 | -0.40 | 4.07 | -6.81 | 1.5179 | -0.1753 | |||
| PEP / PepsiCo, Inc. | 0.03 | 0.25 | 3.75 | -11.74 | 1.3987 | -0.2481 | |||
| GE / General Electric Company | 0.01 | -0.52 | 3.69 | 27.91 | 1.3778 | 0.2584 | |||
| OMC / Omnicom Group Inc. | 0.05 | 0.05 | 3.66 | -13.18 | 1.3655 | -0.2694 | |||
| DORM / Dorman Products, Inc. | 0.03 | -1.24 | 3.42 | 0.50 | 1.2779 | -0.0436 | |||
| CTAS / Cintas Corporation | 0.01 | 0.00 | 3.08 | 8.43 | 1.1484 | 0.0476 | |||
| TMO / Thermo Fisher Scientific Inc. | 0.01 | -1.25 | 3.05 | -19.54 | 1.1394 | -0.3324 | |||
| FIS / Fidelity National Information Services, Inc. | 0.04 | -0.65 | 3.01 | 8.29 | 1.1224 | 0.0453 | |||
| AMG / Affiliated Managers Group, Inc. | 0.02 | 0.50 | 2.97 | 17.72 | 1.1092 | 0.1296 | |||
| BDX / Becton, Dickinson and Company | 0.02 | -0.61 | 2.80 | -25.29 | 1.0440 | -0.4079 | |||
| EL / The Estée Lauder Companies Inc. | 0.03 | -0.87 | 2.76 | 21.41 | 1.0313 | 0.1480 | |||
| CAKE / The Cheesecake Factory Incorporated | 0.04 | -0.52 | 2.71 | 28.08 | 1.0137 | 0.1912 | |||
| GILD / Gilead Sciences, Inc. | 0.02 | -0.61 | 2.71 | -1.64 | 1.0101 | -0.0575 | |||
| STT / State Street Corporation | 0.02 | 0.00 | 2.34 | 18.79 | 0.8736 | 0.1091 | |||
| MSFT / Microsoft Corporation | 0.00 | -1.08 | 2.27 | 31.04 | 0.8482 | 0.1756 | |||
| WDAY / Workday, Inc. | 0.01 | 0.00 | 2.25 | 2.74 | 0.8416 | -0.0096 | |||
| GEN / Gen Digital Inc. | 0.08 | -0.62 | 2.23 | 10.06 | 0.8338 | 0.0466 | |||
| JNJ / Johnson & Johnson | 0.01 | 0.00 | 2.23 | -7.90 | 0.8319 | -0.1069 | |||
| GEV / GE Vernova Inc. | 0.00 | -0.50 | 1.89 | 72.51 | 0.7057 | 0.2804 | |||
| ABT / Abbott Laboratories | 0.01 | -1.88 | 1.88 | 0.59 | 0.7011 | -0.0233 | |||
| MCO / Moody's Corporation | 0.00 | 0.00 | 1.85 | 7.71 | 0.6890 | 0.0241 | |||
| SPY / SPDR S&P 500 ETF | 0.00 | 112.79 | 1.66 | 135.09 | 0.6181 | 0.3447 | |||
| BWA / BorgWarner Inc. | 0.05 | -1.06 | 1.56 | 15.59 | 0.5817 | 0.0588 | |||
| EFX / Equifax Inc. | 0.01 | 0.00 | 1.53 | 6.49 | 0.5699 | 0.0137 | |||
| BRK.A / Berkshire Hathaway Inc. | 0.00 | 0.00 | 1.46 | -8.71 | 0.5443 | -0.0755 | |||
| EFA / iShares Trust - iShares MSCI EAFE ETF | 0.02 | 1.52 | 1.35 | 11.06 | 0.5028 | 0.0321 | |||
| SYY / Sysco Corporation | 0.02 | 0.00 | 1.24 | 0.98 | 0.4627 | -0.0138 | |||
| PYPL / PayPal Holdings, Inc. | 0.02 | -0.98 | 1.13 | 12.73 | 0.4204 | 0.0330 | |||
| ABBV / AbbVie Inc. | 0.01 | 0.00 | 1.11 | -11.35 | 0.4141 | -0.0717 | |||
| JPM / JPMorgan Chase & Co. | 0.00 | 0.00 | 0.99 | 18.19 | 0.3715 | 0.0448 | |||
| MDY / SPDR S&P MidCap 400 ETF Trust | 0.00 | 32.58 | 0.99 | 40.77 | 0.3702 | 0.0969 | |||
| BOOT / Boot Barn Holdings, Inc. | 0.01 | -2.32 | 0.96 | 38.13 | 0.3588 | 0.0890 | |||
| VWO / Vanguard International Equity Index Funds - Vanguard FTSE Emerging Markets ETF | 0.02 | -0.52 | 0.94 | 8.69 | 0.3505 | 0.0154 | |||
| ADBE / Adobe Inc. | 0.00 | 3.55 | 0.90 | 4.52 | 0.3369 | 0.0017 | |||
| PG / The Procter & Gamble Company | 0.01 | 0.00 | 0.85 | -6.48 | 0.3183 | -0.0356 | |||
| SMG / The Scotts Miracle-Gro Company | 0.01 | -1.28 | 0.76 | 18.75 | 0.2839 | 0.0351 | |||
| TSCO / Tractor Supply Company | 0.01 | 0.00 | 0.70 | -4.25 | 0.2611 | -0.0223 | |||
| PHIN / PHINIA Inc. | 0.01 | -0.67 | 0.66 | 4.13 | 0.2446 | 0.0005 | |||
| MDT / Medtronic plc | 0.01 | 0.00 | 0.64 | -2.90 | 0.2376 | -0.0170 | |||
| AMGN / Amgen Inc. | 0.00 | 0.00 | 0.61 | -10.36 | 0.2294 | -0.0366 | |||
| GEHC / GE HealthCare Technologies Inc. | 0.01 | 0.74 | 0.61 | -7.62 | 0.2265 | -0.0281 | |||
| J / Jacobs Solutions Inc. | 0.00 | 0.00 | 0.60 | 8.68 | 0.2246 | 0.0099 | |||
| GNTX / Gentex Corporation | 0.03 | 0.00 | 0.58 | -5.56 | 0.2159 | -0.0219 | |||
| XOM / Exxon Mobil Corporation | 0.01 | 0.00 | 0.56 | -9.43 | 0.2083 | -0.0306 | |||
| WBA / Walgreens Boots Alliance, Inc. | 0.05 | -0.65 | 0.52 | 1.95 | 0.1953 | -0.0035 | |||
| ECL / Ecolab Inc. | 0.00 | 0.00 | 0.45 | 6.35 | 0.1690 | 0.0037 | |||
| V / Visa Inc. | 0.00 | 0.00 | 0.44 | 1.14 | 0.1653 | -0.0043 | |||
| COST / Costco Wholesale Corporation | 0.00 | 0.00 | 0.40 | 4.68 | 0.1508 | 0.0011 | |||
| MA / Mastercard Incorporated | 0.00 | 0.00 | 0.37 | 2.47 | 0.1395 | -0.0020 | |||
| IRM / Iron Mountain Incorporated | 0.00 | 0.00 | 0.36 | 18.94 | 0.1340 | 0.0172 | |||
| KNX / Knight-Swift Transportation Holdings Inc. | 0.01 | 2.66 | 0.34 | 4.29 | 0.1273 | 0.0006 | |||
| BRK.B / Berkshire Hathaway Inc. | 0.00 | 0.00 | 0.34 | -8.60 | 0.1270 | -0.0177 | |||
| PFE / Pfizer Inc. | 0.01 | 0.00 | 0.29 | -4.59 | 0.1090 | -0.0094 | |||
| PAYX / Paychex, Inc. | 0.00 | 0.00 | 0.29 | -5.84 | 0.1086 | -0.0111 | |||
| FI / Fiserv, Inc. | 0.00 | 0.00 | 0.28 | -22.03 | 0.1033 | -0.0342 | |||
| WU / The Western Union Company | 0.03 | -2.37 | 0.27 | -22.29 | 0.0991 | -0.0335 | |||
| META / Meta Platforms, Inc. | 0.00 | 0.00 | 0.26 | 28.43 | 0.0979 | 0.0184 | |||
| NTRS / Northern Trust Corporation | 0.00 | 0.25 | 0.0947 | 0.0947 | |||||
| LOW / Lowe's Companies, Inc. | 0.00 | 11.58 | 0.24 | 6.33 | 0.0878 | 0.0018 | |||
| MS / Morgan Stanley | 0.00 | 0.21 | 0.0768 | 0.0768 | |||||
| MRK / Merck & Co., Inc. | 0.00 | -100.00 | 0.00 | 0.0000 | |||||
| DLB / Dolby Laboratories, Inc. | 0.00 | -100.00 | 0.00 | 0.0000 |