Statistik Asas
| Profil Orang Dalam | MARATHON CAPITAL MANAGEMENT |
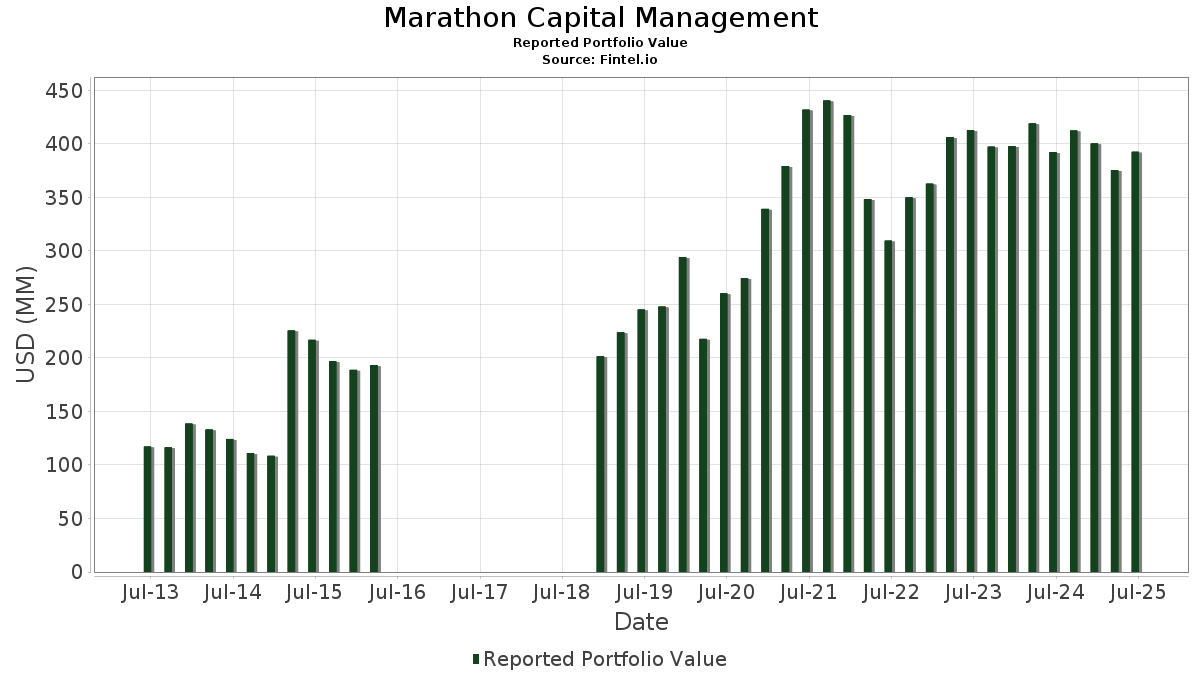
| Nilai Portfolio | $ 392,633,449 |
| Kedudukan Semasa | 166 |
Pegangan Terkini, Prestasi, AUM (dari 13F, 13D)
Marathon Capital Management telah mendedahkan 166 jumlah pegangan dalam pemfailan SEC terkini mereka. Nilai portfolio terkini dikira sebagai $ 392,633,449 USD. Aset Sebenar Di Bawah Pengurusan (AUM) ialah nilai ini ditambah dengan tunai (yang tidak didedahkan). Pegangan teratas Marathon Capital Management ialah T. Rowe Price Group, Inc. (US:TROW) , Microsoft Corporation (US:MSFT) , AstraZeneca PLC - Depositary Receipt (Common Stock) (US:AZN) , Corning Incorporated (US:GLW) , and Apple Inc. (US:AAPL) . Kedudukan baharu Marathon Capital Management termasuk Builders FirstSource, Inc. (US:BLDR) , Healthpeak Properties, Inc. (US:PEAK) , Barrick Mining Corporation (US:B) , PAR Technology Corporation (US:PAR) , and GE HealthCare Technologies Inc. (US:GEHC) .
Kenaikan Teratas Suku Tahun Ini
Kami menggunakan perubahan dalam peruntukan portfolio kerana ini adalah metrik yang paling bermakna. Perubahan boleh disebabkan oleh perdagangan atau perubahan dalam harga saham.
| Sekuriti | Saham (MM) |
Nilai (MM$) |
Portfolio % | ΔPortfolio % |
|---|---|---|---|---|
| 0.10 | 8.18 | 2.0845 | 2.0162 | |
| 0.06 | 6.74 | 1.7156 | 1.7156 | |
| 0.26 | 4.62 | 1.1757 | 1.1757 | |
| 0.15 | 3.05 | 0.7764 | 0.7764 | |
| 0.28 | 5.17 | 1.3157 | 0.4961 | |
| 0.11 | 4.12 | 1.0505 | 0.4674 | |
| 0.02 | 12.16 | 3.0975 | 0.3941 | |
| 0.04 | 3.49 | 0.8888 | 0.3318 | |
| 0.02 | 1.12 | 0.2860 | 0.2860 | |
| 0.03 | 9.39 | 2.3914 | 0.2776 |
Penurunan Teratas Suku Tahun Ini
Kami menggunakan perubahan dalam peruntukan portfolio kerana ini adalah metrik yang paling bermakna. Perubahan boleh disebabkan oleh perdagangan atau perubahan dalam harga saham.
| Sekuriti | Saham (MM) |
Nilai (MM$) |
Portfolio % | ΔPortfolio % |
|---|---|---|---|---|
| 0.10 | 0.71 | 0.1797 | -1.4166 | |
| 0.71 | 68.34 | 17.4045 | -0.9059 | |
| 0.06 | 8.70 | 2.2146 | -0.5459 | |
| 0.05 | 10.95 | 2.7877 | -0.5214 | |
| 0.06 | 2.21 | 0.5638 | -0.4046 | |
| 0.02 | 5.19 | 1.3211 | -0.3997 | |
| 0.06 | 8.34 | 2.1238 | -0.3799 | |
| 0.16 | 11.42 | 2.9082 | -0.3475 | |
| 0.13 | 4.46 | 1.1353 | -0.2719 | |
| 0.01 | 5.51 | 1.4037 | -0.2286 |
13F dan Pemfailan Dana
Borang ini telah difailkan pada 2025-08-14 untuk tempoh pelaporan 2025-06-30. Klik ikon pautan untuk melihat sejarah transaksi penuh.
Tingkatkan untuk membuka data premium dan eksport ke Excel ![]() .
.
| Sekuriti | Jenis | Purata Harga Saham | Saham (MM) |
ΔSaham (%) |
ΔSaham (%) |
Nilai ($MM) |
Portfolio (%) |
ΔPortfolio (%) |
|
|---|---|---|---|---|---|---|---|---|---|
| TROW / T. Rowe Price Group, Inc. | 0.71 | -5.37 | 68.34 | -0.60 | 17.4045 | -0.9059 | |||
| MSFT / Microsoft Corporation | 0.02 | -9.58 | 12.16 | 19.81 | 3.0975 | 0.3941 | |||
| AZN / AstraZeneca PLC - Depositary Receipt (Common Stock) | 0.16 | -1.75 | 11.42 | -6.59 | 2.9082 | -0.3475 | |||
| GLW / Corning Incorporated | 0.21 | -2.05 | 11.03 | 12.52 | 2.8103 | 0.1986 | |||
| AAPL / Apple Inc. | 0.05 | -4.62 | 10.95 | -11.90 | 2.7877 | -0.5214 | |||
| QCOM / QUALCOMM Incorporated | 0.06 | 11.45 | 9.67 | 15.55 | 2.4625 | 0.2341 | |||
| IBM / International Business Machines Corporation | 0.03 | -0.20 | 9.39 | 18.31 | 2.3914 | 0.2776 | |||
| CVX / Chevron Corporation | 0.06 | -1.99 | 8.70 | -16.10 | 2.2146 | -0.5459 | |||
| MET / MetLife, Inc. | 0.11 | -1.98 | 8.59 | -1.83 | 2.1872 | -0.1424 | |||
| FANG / Diamondback Energy, Inc. | 0.06 | 3.22 | 8.34 | -11.30 | 2.1238 | -0.3799 | |||
| VYMI / Vanguard Whitehall Funds - Vanguard International High Dividend Yield ETF | 0.10 | 2,833.30 | 8.18 | 3,096.88 | 2.0845 | 2.0162 | |||
| CPA / Copa Holdings, S.A. | 0.07 | -1.03 | 7.99 | 17.71 | 2.0361 | 0.2272 | |||
| GOOG / Alphabet Inc. | 0.04 | 1.41 | 7.94 | 15.15 | 2.0213 | 0.1856 | |||
| FIS / Fidelity National Information Services, Inc. | 0.09 | 0.55 | 7.37 | 9.62 | 1.8776 | 0.0864 | |||
| ALSN / Allison Transmission Holdings, Inc. | 0.08 | -1.00 | 7.17 | -1.70 | 1.8272 | -0.1167 | |||
| BLDR / Builders FirstSource, Inc. | 0.06 | 6.74 | 1.7156 | 1.7156 | |||||
| AMZN / Amazon.com, Inc. | 0.03 | -0.92 | 6.67 | 14.26 | 1.6979 | 0.1439 | |||
| O / Realty Income Corporation | 0.11 | -0.76 | 6.31 | -1.45 | 1.6068 | -0.0980 | |||
| JPM / JPMorgan Chase & Co. | 0.02 | -1.85 | 6.17 | 16.01 | 1.5710 | 0.1549 | |||
| BRK.B / Berkshire Hathaway Inc. | 0.01 | -1.41 | 5.51 | -10.07 | 1.4037 | -0.2286 | |||
| WTW / Willis Towers Watson Public Limited Company | 0.02 | -11.48 | 5.19 | -19.72 | 1.3211 | -0.3997 | |||
| ADMA / ADMA Biologics, Inc. | 0.28 | 82.88 | 5.17 | 67.86 | 1.3157 | 0.4961 | |||
| CALX / Calix, Inc. | 0.10 | -15.52 | 5.14 | 26.82 | 1.3091 | 0.2294 | |||
| ANIP / ANI Pharmaceuticals, Inc. | 0.07 | 4.09 | 4.70 | 1.45 | 1.1970 | -0.0369 | |||
| DHR / Danaher Corporation | 0.02 | 30.82 | 4.63 | 26.08 | 1.1798 | 0.2011 | |||
| PEAK / Healthpeak Properties, Inc. | 0.26 | 4.62 | 1.1757 | 1.1757 | |||||
| TTI / TETRA Technologies, Inc. | 1.34 | -5.80 | 4.51 | -5.81 | 1.1481 | -0.1263 | |||
| JNJ / Johnson & Johnson | 0.03 | -0.72 | 4.46 | -8.57 | 1.1364 | -0.1632 | |||
| SLB / Schlumberger Limited | 0.13 | 4.33 | 4.46 | -15.64 | 1.1353 | -0.2719 | |||
| ACA / Arcosa, Inc. | 0.05 | -0.58 | 4.14 | 11.77 | 1.0544 | 0.0680 | |||
| SYM / Symbotic Inc. | 0.11 | -2.00 | 4.12 | 88.40 | 1.0505 | 0.4674 | |||
| CEF / Sprott Physical Gold and Silver Trust | 0.13 | -10.36 | 3.97 | -5.02 | 1.0117 | -0.1022 | |||
| ARCC / Ares Capital Corporation | 0.16 | -1.09 | 3.54 | -1.97 | 0.9020 | -0.0603 | |||
| BIL / SPDR Series Trust - SPDR Bloomberg 1-3 Month T-Bill ETF | 0.04 | 66.86 | 3.49 | 66.86 | 0.8888 | 0.3318 | |||
| GLD / SPDR Gold Trust | 0.01 | -0.91 | 3.47 | 4.84 | 0.8834 | 0.0021 | |||
| ZETA / Zeta Global Holdings Corp. | 0.22 | -9.16 | 3.45 | 3.76 | 0.8778 | -0.0067 | |||
| NPKI / NPK International Inc. | 0.40 | -4.36 | 3.37 | 40.10 | 0.8580 | 0.2175 | |||
| CB / Chubb Limited | 0.01 | -1.60 | 3.11 | -5.61 | 0.7925 | -0.0854 | |||
| B / Barrick Mining Corporation | 0.15 | 3.05 | 0.7764 | 0.7764 | |||||
| CECO / CECO Environmental Corp. | 0.10 | 6.08 | 2.94 | 31.75 | 0.7494 | 0.1544 | |||
| MRK / Merck & Co., Inc. | 0.03 | -1.38 | 2.73 | -13.02 | 0.6961 | -0.1408 | |||
| PG / The Procter & Gamble Company | 0.02 | -0.07 | 2.67 | -6.58 | 0.6795 | -0.0811 | |||
| ATEC / Alphatec Holdings, Inc. | 0.23 | -3.10 | 2.57 | 6.07 | 0.6541 | 0.0093 | |||
| PFE / Pfizer Inc. | 0.10 | -4.73 | 2.41 | -8.84 | 0.6143 | -0.0906 | |||
| ENPH / Enphase Energy, Inc. | 0.06 | -4.72 | 2.21 | -39.14 | 0.5638 | -0.4046 | |||
| DAR / Darling Ingredients Inc. | 0.06 | 27.27 | 2.15 | 54.57 | 0.5477 | 0.1772 | |||
| TRGP / Targa Resources Corp. | 0.01 | 0.00 | 2.08 | -13.17 | 0.5309 | -0.1084 | |||
| HDSN / Hudson Technologies, Inc. | 0.25 | -34.82 | 2.03 | -14.23 | 0.5159 | -0.1130 | |||
| LLY / Eli Lilly and Company | 0.00 | 21.17 | 2.01 | 14.42 | 0.5114 | 0.0438 | |||
| KRNT / Kornit Digital Ltd. | 0.09 | -7.04 | 1.85 | -2.98 | 0.4720 | -0.0368 | |||
| SELF / Global Self Storage, Inc. | 0.33 | -9.62 | 1.78 | -4.25 | 0.4535 | -0.0417 | |||
| LAND / Gladstone Land Corporation | 0.14 | -5.81 | 1.46 | -8.95 | 0.3708 | -0.0550 | |||
| BAC.PRL / Bank of America Corporation - Preferred Stock | 0.00 | -1.29 | 1.39 | -3.00 | 0.3547 | -0.0277 | |||
| WY / Weyerhaeuser Company | 0.05 | -0.40 | 1.38 | -12.63 | 0.3527 | -0.0694 | |||
| EXE / Expand Energy Corporation | 0.01 | -6.53 | 1.36 | -1.87 | 0.3474 | -0.0226 | |||
| HON / Honeywell International Inc. | 0.01 | -1.00 | 1.34 | 8.88 | 0.3407 | 0.0135 | |||
| GOOGL / Alphabet Inc. | 0.01 | -1.98 | 1.31 | 11.77 | 0.3337 | 0.0213 | |||
| WFC.PRL / Wells Fargo & Company - Preferred Stock | 0.00 | -8.32 | 1.23 | -10.36 | 0.3131 | -0.0521 | |||
| VZ / Verizon Communications Inc. | 0.03 | -11.07 | 1.23 | -15.19 | 0.3130 | -0.0728 | |||
| KO / The Coca-Cola Company | 0.02 | -2.27 | 1.22 | -3.41 | 0.3103 | -0.0258 | |||
| AR / Antero Resources Corporation | 0.03 | 0.00 | 1.21 | -0.41 | 0.3078 | -0.0153 | |||
| ABBV / AbbVie Inc. | 0.01 | -0.84 | 1.17 | -12.14 | 0.2968 | -0.0565 | |||
| MU / Micron Technology, Inc. | 0.01 | 11.56 | 1.16 | 58.17 | 0.2959 | 0.1004 | |||
| GDX / VanEck ETF Trust - VanEck Gold Miners ETF | 0.02 | 1.12 | 0.2860 | 0.2860 | |||||
| CINF / Cincinnati Financial Corporation | 0.01 | 0.00 | 1.12 | 0.81 | 0.2859 | -0.0107 | |||
| XOM / Exxon Mobil Corporation | 0.01 | -6.03 | 1.01 | -14.88 | 0.2567 | -0.0584 | |||
| PAR / PAR Technology Corporation | 0.01 | 0.97 | 0.2472 | 0.2472 | |||||
| NVDA / NVIDIA Corporation | 0.01 | -7.90 | 0.96 | 34.22 | 0.2438 | 0.0539 | |||
| SPY / SPDR S&P 500 ETF | 0.00 | -11.12 | 0.95 | -1.86 | 0.2415 | -0.0158 | |||
| CYRX / Cryoport, Inc. | 0.12 | 37.26 | 0.91 | 68.46 | 0.2313 | 0.0877 | |||
| GEHC / GE HealthCare Technologies Inc. | 0.01 | 0.89 | 0.2274 | 0.2274 | |||||
| PEP / PepsiCo, Inc. | 0.01 | -0.39 | 0.85 | -12.27 | 0.2168 | -0.0416 | |||
| FCNCA / First Citizens BancShares, Inc. | 0.00 | 10.39 | 0.83 | 16.55 | 0.2118 | 0.0217 | |||
| ENB / Enbridge Inc. | 0.02 | -0.69 | 0.82 | 1.49 | 0.2078 | -0.0061 | |||
| ALL / The Allstate Corporation | 0.00 | -3.14 | 0.79 | -5.92 | 0.2024 | -0.0224 | |||
| AMD / Advanced Micro Devices, Inc. | 0.01 | 0.00 | 0.73 | 38.00 | 0.1861 | 0.0452 | |||
| RGLD / Royal Gold, Inc. | 0.00 | 0.00 | 0.73 | 8.67 | 0.1853 | 0.0072 | |||
| RXRX / Recursion Pharmaceuticals, Inc. | 0.14 | -5.31 | 0.72 | -9.47 | 0.1829 | -0.0283 | |||
| SRPT / Sarepta Therapeutics, Inc. | 0.04 | 0.71 | 0.1811 | 0.1811 | |||||
| HLMN / Hillman Solutions Corp. | 0.10 | -85.51 | 0.71 | -88.24 | 0.1797 | -1.4166 | |||
| GE / General Electric Company | 0.00 | 7.97 | 0.70 | 38.84 | 0.1776 | 0.0438 | |||
| HD / The Home Depot, Inc. | 0.00 | 0.00 | 0.69 | 0.00 | 0.1755 | -0.0079 | |||
| LOW / Lowe's Companies, Inc. | 0.00 | -1.04 | 0.68 | -5.84 | 0.1726 | -0.0191 | |||
| ABT / Abbott Laboratories | 0.00 | -1.04 | 0.65 | 1.57 | 0.1651 | -0.0050 | |||
| RTX / RTX Corporation | 0.00 | -21.62 | 0.65 | -13.64 | 0.1647 | -0.0346 | |||
| PNC / The PNC Financial Services Group, Inc. | 0.00 | -0.29 | 0.64 | 5.78 | 0.1634 | 0.0018 | |||
| MYCG / SSGA Active Trust - SPDR SSGA My2027 Corporate Bond ETF | 0.03 | 107.33 | 0.64 | 107.84 | 0.1622 | 0.0807 | |||
| MCD / McDonald's Corporation | 0.00 | 0.00 | 0.61 | -6.47 | 0.1548 | -0.0183 | |||
| ETN / Eaton Corporation plc | 0.00 | -10.61 | 0.60 | 17.38 | 0.1532 | 0.0167 | |||
| PLD / Prologis, Inc. | 0.01 | 0.00 | 0.55 | -5.97 | 0.1406 | -0.0158 | |||
| MYCF / SSGA Active Trust - SPDR SSGA My2026 Corporate Bond ETF | 0.02 | 105.99 | 0.54 | 106.08 | 0.1383 | 0.0681 | |||
| YOU / Clear Secure, Inc. | 0.02 | 0.00 | 0.53 | 7.11 | 0.1343 | 0.0032 | |||
| TXO / TXO Partners, L.P. | 0.04 | 40.00 | 0.53 | 9.81 | 0.1341 | 0.0065 | |||
| LSCC / Lattice Semiconductor Corporation | 0.01 | 0.00 | 0.50 | -6.58 | 0.1266 | -0.0151 | |||
| SANM / Sanmina Corporation | 0.01 | 0.00 | 0.49 | 28.68 | 0.1246 | 0.0231 | |||
| BXP / Boston Properties, Inc. | 0.01 | -0.85 | 0.47 | -0.42 | 0.1203 | -0.0060 | |||
| TMO / Thermo Fisher Scientific Inc. | 0.00 | 0.00 | 0.46 | -18.57 | 0.1164 | -0.0330 | |||
| CRBG / Corebridge Financial, Inc. | 0.01 | 0.45 | 0.1156 | 0.1156 | |||||
| SBUX / Starbucks Corporation | 0.00 | -20.83 | 0.45 | -26.14 | 0.1153 | -0.0477 | |||
| CSX / CSX Corporation | 0.01 | -3.56 | 0.44 | 7.02 | 0.1126 | 0.0025 | |||
| PCH / PotlatchDeltic Corporation | 0.01 | 0.44 | 0.1126 | 0.1126 | |||||
| GTY / Getty Realty Corp. | 0.02 | 3.48 | 0.43 | -8.32 | 0.1097 | -0.0154 | |||
| TMHC / Taylor Morrison Home Corporation | 0.01 | 0.00 | 0.43 | 2.14 | 0.1095 | -0.0024 | |||
| SYK / Stryker Corporation | 0.00 | 0.00 | 0.43 | 6.22 | 0.1089 | 0.0018 | |||
| CSCO / Cisco Systems, Inc. | 0.01 | 67.91 | 0.43 | 89.33 | 0.1086 | 0.0484 | |||
| SLV / iShares Silver Trust | 0.01 | -0.77 | 0.42 | 4.95 | 0.1081 | 0.0005 | |||
| IBB / iShares Trust - iShares Biotechnology ETF | 0.00 | -8.30 | 0.42 | -9.31 | 0.1068 | -0.0163 | |||
| XRAY / DENTSPLY SIRONA Inc. | 0.03 | 0.41 | 0.1034 | 0.1034 | |||||
| AVGO / Broadcom Inc. | 0.00 | 2.11 | 0.40 | 68.49 | 0.1021 | 0.0386 | |||
| RIO / Rio Tinto Group - Depositary Receipt (Common Stock) | 0.01 | 0.39 | 0.0983 | 0.0983 | |||||
| DIS / The Walt Disney Company | 0.00 | 0.00 | 0.38 | 25.75 | 0.0960 | 0.0161 | |||
| DUK / Duke Energy Corporation | 0.00 | 0.00 | 0.37 | -3.11 | 0.0953 | -0.0077 | |||
| OKE / ONEOK, Inc. | 0.00 | 0.00 | 0.36 | -17.69 | 0.0925 | -0.0251 | |||
| BMY / Bristol-Myers Squibb Company | 0.01 | -10.90 | 0.36 | -32.40 | 0.0921 | -0.0503 | |||
| CNX / CNX Resources Corporation | 0.01 | 0.00 | 0.34 | 7.01 | 0.0858 | 0.0019 | |||
| MXL / MaxLinear, Inc. | 0.02 | 0.00 | 0.32 | 30.74 | 0.0814 | 0.0164 | |||
| AMGN / Amgen Inc. | 0.00 | 0.00 | 0.32 | -10.45 | 0.0809 | -0.0135 | |||
| TCAF / T. Rowe Price Exchange-Traded Funds, Inc. - T. Rowe Price Capital Appreciation Equity ETF | 0.01 | -9.30 | 0.31 | -0.96 | 0.0788 | -0.0043 | |||
| COF / Capital One Financial Corporation | 0.00 | -1.74 | 0.30 | 16.34 | 0.0764 | 0.0079 | |||
| COPX / Global X Funds - Global X Copper Miners ETF | 0.01 | 6.63 | 0.30 | 22.82 | 0.0756 | 0.0112 | |||
| MPC / Marathon Petroleum Corporation | 0.00 | 0.00 | 0.28 | 14.17 | 0.0719 | 0.0060 | |||
| SMRI / EA Series Trust - Bushido Capital US Equity ETF | 0.01 | 3.02 | 0.28 | 10.20 | 0.0716 | 0.0035 | |||
| EMR / Emerson Electric Co. | 0.00 | -10.79 | 0.28 | 8.27 | 0.0702 | 0.0025 | |||
| CI / The Cigna Group | 0.00 | 0.00 | 0.27 | 0.37 | 0.0692 | -0.0028 | |||
| TMFC / The RBB Fund, Inc. - Motley Fool 100 Index ETF | 0.00 | 1.23 | 0.27 | 17.70 | 0.0678 | 0.0074 | |||
| FNB / F.N.B. Corporation | 0.02 | -10.00 | 0.26 | -2.60 | 0.0668 | -0.0048 | |||
| HSY / The Hershey Company | 0.00 | -1.58 | 0.26 | -4.44 | 0.0657 | -0.0062 | |||
| PM / Philip Morris International Inc. | 0.00 | -16.30 | 0.26 | -3.75 | 0.0655 | -0.0058 | |||
| KEYS / Keysight Technologies, Inc. | 0.00 | -14.05 | 0.25 | -6.02 | 0.0638 | -0.0072 | |||
| URA / Global X Funds - Global X Uranium ETF | 0.01 | 0.25 | 0.0636 | 0.0636 | |||||
| CIVI / Civitas Resources, Inc. | 0.01 | -5.24 | 0.25 | -25.30 | 0.0634 | -0.0253 | |||
| NEM / Newmont Corporation | 0.00 | -7.62 | 0.25 | 11.76 | 0.0629 | 0.0039 | |||
| WAB / Westinghouse Air Brake Technologies Corporation | 0.00 | -25.49 | 0.24 | -14.08 | 0.0623 | -0.0135 | |||
| VOO / Vanguard Index Funds - Vanguard S&P 500 ETF | 0.00 | 0.24 | 0.0622 | 0.0622 | |||||
| VIG / Vanguard Specialized Funds - Vanguard Dividend Appreciation ETF | 0.00 | 0.00 | 0.24 | 5.75 | 0.0609 | 0.0005 | |||
| LMT / Lockheed Martin Corporation | 0.00 | 4.07 | 0.24 | 7.76 | 0.0603 | 0.0019 | |||
| AMP / Ameriprise Financial, Inc. | 0.00 | 0.00 | 0.23 | 10.48 | 0.0591 | 0.0030 | |||
| IBDQ / iShares Trust - iShares iBonds Dec 2025 Term Corporate ETF | 0.23 | -9.41 | 0.0588 | -0.0093 | |||||
| CP / Canadian Pacific Kansas City Limited | 0.00 | 0.00 | 0.23 | 12.87 | 0.0582 | 0.0043 | |||
| MGY / Magnolia Oil & Gas Corporation | 0.01 | 0.00 | 0.22 | -11.11 | 0.0573 | -0.0100 | |||
| TOST / Toast, Inc. | 0.01 | 0.22 | 0.0564 | 0.0564 | |||||
| QQQ / Invesco QQQ Trust, Series 1 | 0.00 | -19.35 | 0.22 | -5.17 | 0.0562 | -0.0058 | |||
| NEE / NextEra Energy, Inc. | 0.00 | 0.00 | 0.22 | -1.79 | 0.0559 | -0.0038 | |||
| MMM / 3M Company | 0.00 | 0.00 | 0.21 | 3.88 | 0.0545 | -0.0005 | |||
| NBR / Nabors Industries Ltd. | 0.01 | 0.00 | 0.21 | -32.69 | 0.0535 | -0.0298 | |||
| V / Visa Inc. | 0.00 | 2.28 | 0.21 | 3.50 | 0.0528 | -0.0005 | |||
| CARR / Carrier Global Corporation | 0.00 | -28.54 | 0.21 | -17.67 | 0.0523 | -0.0140 | |||
| KHC / The Kraft Heinz Company | 0.01 | -2.95 | 0.20 | -17.81 | 0.0520 | -0.0140 | |||
| NOC / Northrop Grumman Corporation | 0.00 | 0.00 | 0.20 | -2.40 | 0.0518 | -0.0037 | |||
| IBDR / iShares Trust - iShares iBonds Dec 2026 Term Corporate ETF | 0.20 | 0.0517 | 0.0517 | ||||||
| IBDS / iShares Trust - iShares iBonds Dec 2027 Term Corporate ETF | 0.20 | 0.0513 | 0.0513 | ||||||
| NOW / ServiceNow, Inc. | 0.00 | 0.20 | 0.0511 | 0.0511 | |||||
| WM / Waste Management, Inc. | 0.00 | 0.00 | 0.20 | -0.99 | 0.0510 | -0.0030 | |||
| INVE / Identiv, Inc. | 0.06 | -65.48 | 0.20 | -64.70 | 0.0502 | -0.0986 | |||
| FRO / Frontline plc | 0.01 | 0.00 | 0.16 | 10.81 | 0.0418 | 0.0022 | |||
| ARAY / Accuray Incorporated | 0.10 | -9.09 | 0.14 | -30.10 | 0.0349 | -0.0175 | |||
| MCHX / Marchex, Inc. | 0.05 | 30.12 | 0.12 | 73.13 | 0.0297 | 0.0117 | |||
| CLF / Cleveland-Cliffs Inc. | 0.01 | 0.11 | 0.0290 | 0.0290 | |||||
| EVLV / Evolv Technologies Holdings, Inc. | 0.01 | -82.14 | 0.08 | -64.22 | 0.0199 | -0.0383 | |||
| ONDS / Ondas Holdings Inc. | 0.04 | 4.05 | 0.07 | 87.18 | 0.0188 | 0.0083 | |||
| LPZB / LightPath Technologies, Inc. | 0.02 | 0.05 | 0.0137 | 0.0137 | |||||
| BRFH / Barfresh Food Group, Inc. | 0.02 | 0.00 | 0.05 | 13.04 | 0.0134 | 0.0009 | |||
| LODE / Comstock Inc. | 0.01 | 8.00 | 0.05 | 70.00 | 0.0130 | 0.0049 | |||
| KOPN / Kopin Corporation | 0.03 | 0.00 | 0.05 | 66.67 | 0.0117 | 0.0042 | |||
| AIRG / Airgain, Inc. | 0.01 | 0.04 | 0.0106 | 0.0106 | |||||
| NNDM / Nano Dimension Ltd. - Depositary Receipt (Common Stock) | 0.02 | 0.00 | 0.03 | 3.23 | 0.0083 | -0.0002 | |||
| OTIS / Otis Worldwide Corporation | 0.00 | -100.00 | 0.00 | 0.0000 | |||||
| DCGO / DocGo Inc. | 0.00 | -100.00 | 0.00 | 0.0000 | |||||
| GOLD / Barrick Mining Corporation | 0.00 | -100.00 | 0.00 | 0.0000 | |||||
| BCX / Blackrock Resources & Commodities Strategy Trust | 0.00 | -100.00 | 0.00 | 0.0000 | |||||
| SHYF / The Shyft Group, Inc. | 0.00 | -100.00 | 0.00 | 0.0000 | |||||
| PXLW / Pixelworks, Inc. | 0.00 | -100.00 | 0.00 | 0.0000 | |||||
| DOW / Dow Inc. | 0.00 | -100.00 | 0.00 | 0.0000 | |||||
| KVUE / Kenvue Inc. | 0.00 | -100.00 | 0.00 | 0.0000 | |||||
| WBD / Warner Bros. Discovery, Inc. | 0.00 | -100.00 | 0.00 | 0.0000 | |||||
| LULU / lululemon athletica inc. | 0.00 | -100.00 | 0.00 | 0.0000 | |||||
| RIG / Transocean Ltd. | 0.00 | -100.00 | 0.00 | 0.0000 | |||||
| QTRX / Quanterix Corporation | 0.00 | -100.00 | 0.00 | 0.0000 |