Statistik Asas
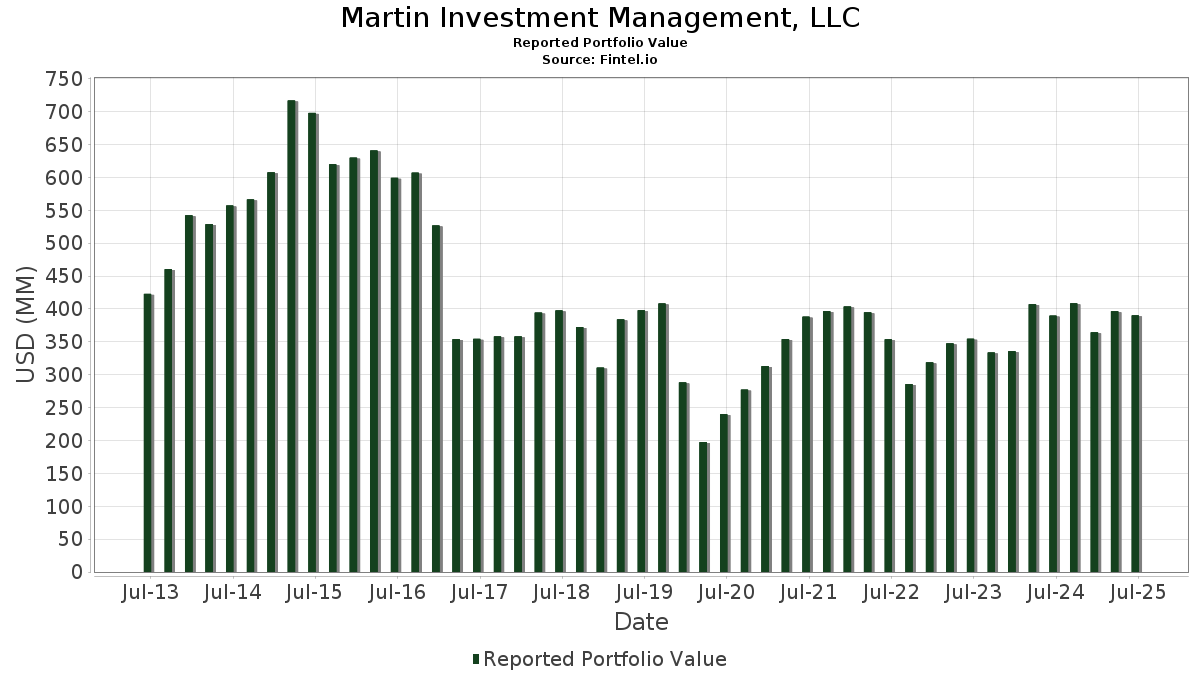
| Nilai Portfolio | $ 390,114,952 |
| Kedudukan Semasa | 49 |
Pegangan Terkini, Prestasi, AUM (dari 13F, 13D)
Martin Investment Management, LLC telah mendedahkan 49 jumlah pegangan dalam pemfailan SEC terkini mereka. Nilai portfolio terkini dikira sebagai $ 390,114,952 USD. Aset Sebenar Di Bawah Pengurusan (AUM) ialah nilai ini ditambah dengan tunai (yang tidak didedahkan). Pegangan teratas Martin Investment Management, LLC ialah Check Point Software Technologies Ltd. (US:CHKP) , Sony Group Corporation - Depositary Receipt (Common Stock) (US:SONY) , Novartis AG - Depositary Receipt (Common Stock) (US:NVS) , Alcon Inc. (US:ALC) , and AstraZeneca PLC - Depositary Receipt (Common Stock) (US:AZN) . Kedudukan baharu Martin Investment Management, LLC termasuk Leidos Holdings, Inc. (DE:S6IA) , .
Kenaikan Teratas Suku Tahun Ini
Kami menggunakan perubahan dalam peruntukan portfolio kerana ini adalah metrik yang paling bermakna. Perubahan boleh disebabkan oleh perdagangan atau perubahan dalam harga saham.
| Sekuriti | Saham (MM) |
Nilai (MM$) |
Portfolio % | ΔPortfolio % |
|---|---|---|---|---|
| 0.04 | 5.76 | 1.4758 | 1.4758 | |
| 0.13 | 21.14 | 5.4199 | 1.0751 | |
| 0.00 | 13.52 | 3.4651 | 0.7500 | |
| 0.02 | 3.42 | 0.8778 | 0.5414 | |
| 0.03 | 11.01 | 2.8228 | 0.4751 | |
| 0.07 | 12.31 | 3.1545 | 0.4271 | |
| 0.04 | 9.36 | 2.3987 | 0.3586 | |
| 0.03 | 7.84 | 2.0104 | 0.3543 | |
| 0.03 | 6.40 | 1.6394 | 0.2644 | |
| 0.22 | 26.53 | 6.8012 | 0.2548 |
Penurunan Teratas Suku Tahun Ini
Kami menggunakan perubahan dalam peruntukan portfolio kerana ini adalah metrik yang paling bermakna. Perubahan boleh disebabkan oleh perdagangan atau perubahan dalam harga saham.
| Sekuriti | Saham (MM) |
Nilai (MM$) |
Portfolio % | ΔPortfolio % |
|---|---|---|---|---|
| 0.13 | 29.21 | 7.4867 | -1.7162 | |
| 0.26 | 22.73 | 5.8263 | -0.7241 | |
| 0.12 | 20.00 | 5.1258 | -0.3881 | |
| 0.09 | 18.02 | 4.6187 | -0.3728 | |
| 0.02 | 6.35 | 1.6274 | -0.3520 | |
| 0.02 | 10.89 | 2.7920 | -0.2622 | |
| 1.03 | 26.91 | 6.8968 | -0.1819 | |
| 0.28 | 19.10 | 4.8963 | -0.1665 | |
| 0.05 | 4.00 | 1.0242 | -0.1101 | |
| 0.01 | 6.96 | 1.7830 | -0.0433 |
13F dan Pemfailan Dana
Borang ini telah difailkan pada 2025-08-07 untuk tempoh pelaporan 2025-06-30. Klik ikon pautan untuk melihat sejarah transaksi penuh.
Tingkatkan untuk membuka data premium dan eksport ke Excel ![]() .
.
| Sekuriti | Jenis | Purata Harga Saham | Saham (MM) |
ΔSaham (%) |
ΔSaham (%) |
Nilai ($MM) |
Portfolio (%) |
ΔPortfolio (%) |
|
|---|---|---|---|---|---|---|---|---|---|
| CHKP / Check Point Software Technologies Ltd. | 0.13 | -17.52 | 29.21 | -19.93 | 7.4867 | -1.7162 | |||
| SONY / Sony Group Corporation - Depositary Receipt (Common Stock) | 1.03 | -6.46 | 26.91 | -4.11 | 6.8968 | -0.1819 | |||
| NVS / Novartis AG - Depositary Receipt (Common Stock) | 0.22 | -5.80 | 26.53 | 2.25 | 6.8012 | 0.2548 | |||
| ALC / Alcon Inc. | 0.26 | -5.86 | 22.73 | -12.45 | 5.8263 | -0.7241 | |||
| AZN / AstraZeneca PLC - Depositary Receipt (Common Stock) | 0.32 | 3.55 | 22.50 | -1.55 | 5.7685 | 0.0014 | |||
| NICE / NICE Ltd. - Depositary Receipt (Common Stock) | 0.13 | 12.06 | 21.14 | 22.77 | 5.4199 | 1.0751 | |||
| TM / Toyota Motor Corporation - Depositary Receipt (Common Stock) | 0.12 | -6.24 | 20.00 | -8.51 | 5.1258 | -0.3881 | |||
| MA / Mastercard Incorporated | 0.03 | -1.33 | 19.11 | 1.15 | 4.8977 | 0.1321 | |||
| NVO / Novo Nordisk A/S - Depositary Receipt (Common Stock) | 0.28 | -4.23 | 19.10 | -4.81 | 4.8963 | -0.1665 | |||
| AAPL / Apple Inc. | 0.09 | -1.40 | 18.02 | -8.93 | 4.6187 | -0.3728 | |||
| BKNG / Booking Holdings Inc. | 0.00 | -0.04 | 13.52 | 25.61 | 3.4651 | 0.7500 | |||
| GOOGL / Alphabet Inc. | 0.07 | -0.11 | 12.31 | 13.84 | 3.1545 | 0.4271 | |||
| AXP / American Express Company | 0.03 | -0.18 | 11.01 | 18.34 | 2.8228 | 0.4751 | |||
| BRK.B / Berkshire Hathaway Inc. | 0.02 | -1.36 | 10.89 | -10.03 | 2.7920 | -0.2622 | |||
| WAB / Westinghouse Air Brake Technologies Corporation | 0.04 | 0.25 | 9.36 | 15.73 | 2.3987 | 0.3586 | |||
| VRSK / Verisk Analytics, Inc. | 0.03 | -0.26 | 8.64 | 4.40 | 2.2150 | 0.1266 | |||
| CBOE / Cboe Global Markets, Inc. | 0.03 | -0.06 | 8.05 | 2.99 | 2.0640 | 0.0916 | |||
| LHX / L3Harris Technologies, Inc. | 0.03 | -0.30 | 7.84 | 19.47 | 2.0104 | 0.3543 | |||
| SYK / Stryker Corporation | 0.02 | -0.50 | 7.65 | 5.75 | 1.9614 | 0.1359 | |||
| AZO / AutoZone, Inc. | 0.00 | 0.30 | 7.44 | -2.35 | 1.9060 | -0.0150 | |||
| ROP / Roper Technologies, Inc. | 0.01 | -0.06 | 6.96 | -3.91 | 1.7830 | -0.0433 | |||
| LNG / Cheniere Energy, Inc. | 0.03 | 0.00 | 6.89 | 5.24 | 1.7657 | 0.1143 | |||
| AME / AMETEK, Inc. | 0.04 | 0.20 | 6.62 | 5.33 | 1.6979 | 0.1114 | |||
| NXPI / NXP Semiconductors N.V. | 0.03 | 2.08 | 6.40 | 17.36 | 1.6394 | 0.2644 | |||
| ACN / Accenture plc | 0.02 | 1.20 | 6.38 | -3.07 | 1.6361 | -0.0251 | |||
| TMO / Thermo Fisher Scientific Inc. | 0.02 | -0.69 | 6.35 | -19.08 | 1.6274 | -0.3520 | |||
| S6IA / Leidos Holdings, Inc. | 0.04 | 5.76 | 1.4758 | 1.4758 | |||||
| ADBE / Adobe Inc. | 0.01 | -0.10 | 5.47 | 0.77 | 1.4030 | 0.0327 | |||
| MRK / Merck & Co., Inc. | 0.05 | 0.77 | 4.00 | -11.14 | 1.0242 | -0.1101 | |||
| NVDD / Direxion Shares ETF Trust - Direxion Daily NVDA Bear 1X Shares | 0.02 | 76.16 | 3.42 | 156.86 | 0.8778 | 0.5414 | |||
| MSFT / Microsoft Corporation | 0.00 | 5.16 | 1.01 | 39.34 | 0.2597 | 0.0763 | |||
| ASML / ASML Holding N.V. - Depositary Receipt (Common Stock) | 0.00 | 11.13 | 1.00 | 34.41 | 0.2564 | 0.0686 | |||
| AMZN / Amazon.com, Inc. | 0.00 | 0.69 | 0.86 | 16.10 | 0.2201 | 0.0335 | |||
| GOOG / Alphabet Inc. | 0.00 | -1.66 | 0.76 | 11.69 | 0.1936 | 0.0229 | |||
| XOM / Exxon Mobil Corporation | 0.01 | -2.02 | 0.73 | -11.27 | 0.1878 | -0.0203 | |||
| AON / Aon plc | 0.00 | 15.38 | 0.70 | 3.12 | 0.1783 | 0.0082 | |||
| RELX / RELX PLC - Depositary Receipt (Common Stock) | 0.01 | 33.45 | 0.62 | 43.72 | 0.1587 | 0.0501 | |||
| TSM / Taiwan Semiconductor Manufacturing Company Limited - Depositary Receipt (Common Stock) | 0.00 | -0.22 | 0.51 | 36.44 | 0.1315 | 0.0364 | |||
| MDT / Medtronic plc | 0.01 | 18.29 | 0.48 | 14.69 | 0.1243 | 0.0177 | |||
| HLN / Haleon plc - Depositary Receipt (Common Stock) | 0.05 | 24.66 | 0.47 | 25.73 | 0.1217 | 0.0263 | |||
| V / Visa Inc. | 0.00 | -7.14 | 0.46 | -5.92 | 0.1183 | -0.0055 | |||
| ALLE / Allegion plc | 0.00 | 33.62 | 0.42 | 47.37 | 0.1079 | 0.0360 | |||
| KMB / Kimberly-Clark Corporation | 0.00 | -1.41 | 0.36 | -10.67 | 0.0925 | -0.0094 | |||
| COST / Costco Wholesale Corporation | 0.00 | 0.00 | 0.34 | 4.69 | 0.0860 | 0.0051 | |||
| SU / Suncor Energy Inc. | 0.01 | 28.15 | 0.26 | 23.92 | 0.0664 | 0.0137 | |||
| FDS / FactSet Research Systems Inc. | 0.00 | 0.00 | 0.26 | -1.53 | 0.0659 | -0.0000 | |||
| META / Meta Platforms, Inc. | 0.00 | 0.24 | 0.0626 | 0.0626 | |||||
| AVGO / Broadcom Inc. | 0.00 | 0.22 | 0.0565 | 0.0565 | |||||
| PLTR / Palantir Technologies Inc. | 0.00 | -49.34 | 0.21 | -18.36 | 0.0538 | -0.0109 | |||
| FANG / Diamondback Energy, Inc. | 0.00 | -100.00 | 0.00 | 0.0000 | |||||
| GD / General Dynamics Corporation | 0.00 | -100.00 | 0.00 | 0.0000 | |||||
| TTE / TotalEnergies SE - Depositary Receipt (Common Stock) | 0.00 | -100.00 | 0.00 | 0.0000 | |||||
| AXON / Axon Enterprise, Inc. | 0.00 | -100.00 | 0.00 | 0.0000 |