Statistik Asas
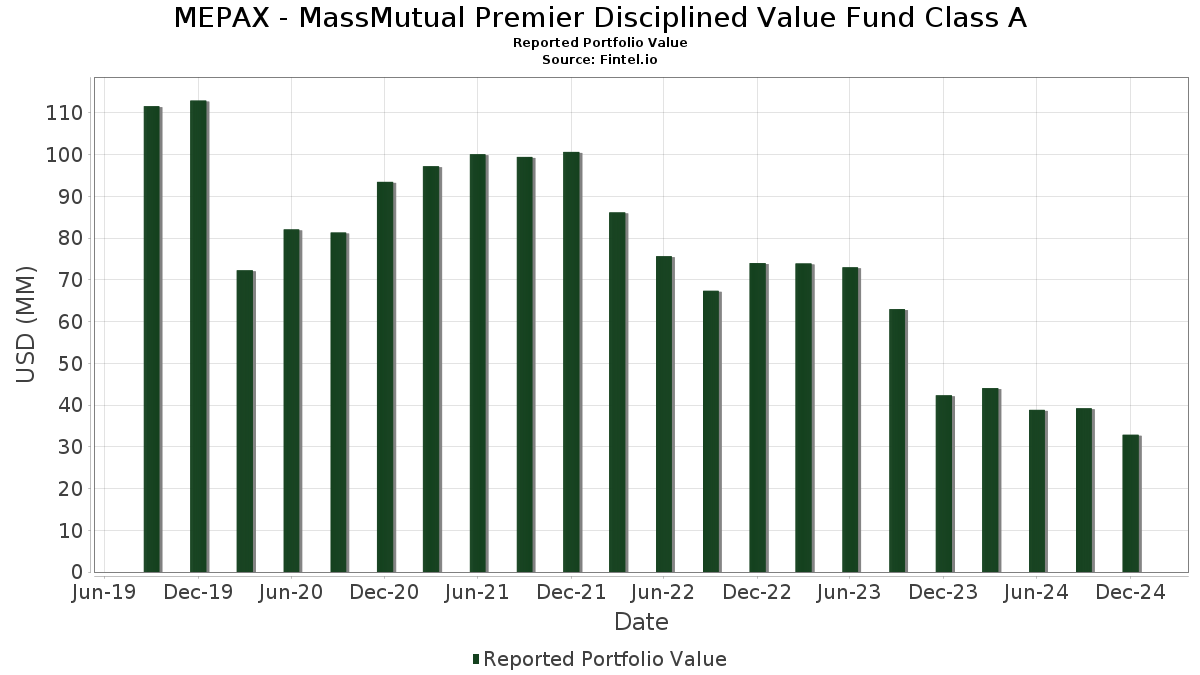
| Nilai Portfolio | $ 32,873,199 |
| Kedudukan Semasa | 153 |
Pegangan Terkini, Prestasi, AUM (dari 13F, 13D)
MEPAX - MassMutual Premier Disciplined Value Fund Class A telah mendedahkan 153 jumlah pegangan dalam pemfailan SEC terkini mereka. Nilai portfolio terkini dikira sebagai $ 32,873,199 USD. Aset Sebenar Di Bawah Pengurusan (AUM) ialah nilai ini ditambah dengan tunai (yang tidak didedahkan). Pegangan teratas MEPAX - MassMutual Premier Disciplined Value Fund Class A ialah Berkshire Hathaway Inc. (US:BRK.B) , JPMorgan Chase & Co. (US:JPM) , Walmart Inc. (US:WMT) , Johnson & Johnson (US:JNJ) , and Exxon Mobil Corporation (US:XOM) . Kedudukan baharu MEPAX - MassMutual Premier Disciplined Value Fund Class A termasuk BlackRock, Inc. (US:BLK) , Albertsons Companies, Inc. (US:ACI) , Crane NXT, Co. (US:CXT) , Chesapeake Energy Corporation (US:CHK) , and SharkNinja, Inc. (US:SN) .
Kenaikan Teratas Suku Tahun Ini
Kami menggunakan perubahan dalam peruntukan portfolio kerana ini adalah metrik yang paling bermakna. Perubahan boleh disebabkan oleh perdagangan atau perubahan dalam harga saham.
| Sekuriti | Saham (MM) |
Nilai (MM$) |
Portfolio % | ΔPortfolio % |
|---|---|---|---|---|
| 0.00 | 0.54 | 1.6352 | 1.6352 | |
| 0.00 | 0.51 | 1.5373 | 1.5373 | |
| 0.01 | 0.37 | 1.1269 | 1.1269 | |
| 0.00 | 0.39 | 1.2000 | 0.9173 | |
| 0.00 | 0.35 | 1.0769 | 0.7819 | |
| 0.00 | 0.35 | 1.0705 | 0.7664 | |
| 0.00 | 0.29 | 0.8771 | 0.7125 | |
| 0.01 | 0.30 | 0.9011 | 0.6464 | |
| 0.01 | 0.20 | 0.6095 | 0.6095 | |
| 0.00 | 0.45 | 1.3712 | 0.5252 |
Penurunan Teratas Suku Tahun Ini
Kami menggunakan perubahan dalam peruntukan portfolio kerana ini adalah metrik yang paling bermakna. Perubahan boleh disebabkan oleh perdagangan atau perubahan dalam harga saham.
| Sekuriti | Saham (MM) |
Nilai (MM$) |
Portfolio % | ΔPortfolio % |
|---|---|---|---|---|
| 0.00 | 0.08 | 0.2377 | -1.1017 | |
| 0.03 | 0.03 | 0.0871 | -1.0578 | |
| 0.00 | 0.05 | 0.1539 | -0.9555 | |
| 0.00 | 0.03 | 0.1011 | -0.9219 | |
| 0.00 | 0.11 | 0.3246 | -0.9125 | |
| 0.00 | 0.17 | 0.5278 | -0.6367 | |
| 0.00 | 0.08 | 0.2527 | -0.6128 | |
| 0.00 | 0.06 | 0.1709 | -0.6062 | |
| 0.00 | 0.04 | 0.1152 | -0.5380 | |
| 0.00 | 0.09 | 0.2642 | -0.5297 |
13F dan Pemfailan Dana
Borang ini telah difailkan pada 2025-02-28 untuk tempoh pelaporan 2024-12-31. Klik ikon pautan untuk melihat sejarah transaksi penuh.
Tingkatkan untuk membuka data premium dan eksport ke Excel ![]() .
.
| Sekuriti | Jenis | Purata Harga Saham | Saham (MM) |
ΔSaham (%) |
ΔSaham (%) |
Nilai ($MM) |
Portfolio (%) |
ΔPortfolio (%) |
|
|---|---|---|---|---|---|---|---|---|---|
| BRK.B / Berkshire Hathaway Inc. | 0.00 | -13.12 | 1.44 | -14.41 | 4.3935 | 0.0715 | |||
| JPM / JPMorgan Chase & Co. | 0.00 | -13.97 | 1.18 | -2.23 | 3.6041 | 0.5024 | |||
| WMT / Walmart Inc. | 0.01 | -20.42 | 0.85 | -10.97 | 2.5945 | 0.1419 | |||
| JNJ / Johnson & Johnson | 0.01 | -9.63 | 0.80 | -19.35 | 2.4245 | -0.1059 | |||
| XOM / Exxon Mobil Corporation | 0.01 | -16.41 | 0.69 | -23.25 | 2.1013 | -0.2044 | |||
| BLK / BlackRock, Inc. | 0.00 | 0.54 | 1.6352 | 1.6352 | |||||
| CMCSA / Comcast Corporation | 0.01 | -8.06 | 0.52 | -17.38 | 1.5943 | -0.0301 | |||
| SPGI / S&P Global Inc. | 0.00 | 0.51 | 1.5373 | 1.5373 | |||||
| ETN / Eaton Corporation plc | 0.00 | 11.30 | 0.49 | 11.36 | 1.4932 | 0.3654 | |||
| UNH / UnitedHealth Group Incorporated | 0.00 | -13.89 | 0.49 | -25.46 | 1.4799 | -0.1920 | |||
| CME / CME Group Inc. | 0.00 | -17.32 | 0.45 | -12.93 | 1.3736 | 0.0450 | |||
| SYK / Stryker Corporation | 0.00 | 36.87 | 0.45 | 36.36 | 1.3712 | 0.5252 | |||
| DIS / The Walt Disney Company | 0.00 | 14.20 | 0.44 | 32.04 | 1.3444 | 0.4884 | |||
| PG / The Procter & Gamble Company | 0.00 | -7.30 | 0.43 | -10.08 | 1.3030 | 0.0808 | |||
| MCD / McDonald's Corporation | 0.00 | -15.68 | 0.40 | -19.60 | 1.2240 | -0.0595 | |||
| BK / The Bank of New York Mellon Corporation | 0.01 | -25.36 | 0.40 | -20.28 | 1.2228 | -0.0668 | |||
| GD / General Dynamics Corporation | 0.00 | 309.86 | 0.39 | 258.18 | 1.2000 | 0.9173 | |||
| APH / Amphenol Corporation | 0.01 | 0.37 | 1.1269 | 1.1269 | |||||
| MAA / Mid-America Apartment Communities, Inc. | 0.00 | -12.69 | 0.36 | -15.09 | 1.0973 | 0.0099 | |||
| ROP / Roper Technologies, Inc. | 0.00 | -12.21 | 0.36 | -18.08 | 1.0919 | -0.0287 | |||
| PEP / PepsiCo, Inc. | 0.00 | 1.03 | 0.36 | -9.60 | 1.0901 | 0.0745 | |||
| IBM / International Business Machines Corporation | 0.00 | -3.10 | 0.36 | -3.77 | 1.0888 | 0.1377 | |||
| PGR / The Progressive Corporation | 0.00 | -5.70 | 0.36 | -10.75 | 1.0868 | 0.0595 | |||
| JAZZ / Jazz Pharmaceuticals plc | 0.00 | -14.85 | 0.36 | -5.82 | 1.0853 | 0.1148 | |||
| SNA / Snap-on Incorporated | 0.00 | -2.15 | 0.36 | 14.89 | 1.0810 | 0.2875 | |||
| GL / Globe Life Inc. | 0.00 | 191.81 | 0.35 | 206.96 | 1.0769 | 0.7819 | |||
| PKG / Packaging Corporation of America | 0.00 | 183.48 | 0.35 | 197.46 | 1.0705 | 0.7664 | |||
| O / Realty Income Corporation | 0.01 | -15.78 | 0.35 | -29.15 | 1.0674 | -0.1992 | |||
| BRO / Brown & Brown, Inc. | 0.00 | -17.51 | 0.35 | -18.84 | 1.0653 | -0.0385 | |||
| TROW / T. Rowe Price Group, Inc. | 0.00 | -10.47 | 0.35 | -6.97 | 1.0569 | 0.0999 | |||
| PPG / PPG Industries, Inc. | 0.00 | -9.28 | 0.35 | -18.20 | 1.0553 | -0.0305 | |||
| NFG / National Fuel Gas Company | 0.01 | 26.62 | 0.35 | 26.74 | 1.0551 | 0.3546 | |||
| EME / EMCOR Group, Inc. | 0.00 | -26.10 | 0.34 | -22.05 | 1.0446 | -0.0839 | |||
| JHG / Janus Henderson Group plc | 0.01 | 41.64 | 0.34 | 58.41 | 1.0327 | 0.4834 | |||
| ADC / Agree Realty Corporation | 0.00 | -20.20 | 0.33 | -25.40 | 1.0033 | -0.1282 | |||
| CW / Curtiss-Wright Corporation | 0.00 | -10.43 | 0.33 | -3.53 | 1.0014 | 0.1298 | |||
| GILD / Gilead Sciences, Inc. | 0.00 | -6.26 | 0.32 | 3.21 | 0.9811 | 0.1815 | |||
| STAG / STAG Industrial, Inc. | 0.01 | 13.63 | 0.30 | -1.63 | 0.9183 | 0.1321 | |||
| OVV / Ovintiv Inc. | 0.01 | 181.66 | 0.30 | 198.99 | 0.9011 | 0.6464 | |||
| BAC / Bank of America Corporation | 0.01 | -13.58 | 0.29 | -4.25 | 0.8931 | 0.1078 | |||
| STT / State Street Corporation | 0.00 | -15.62 | 0.29 | -6.13 | 0.8859 | 0.0894 | |||
| LDOS / Leidos Holdings, Inc. | 0.00 | 407.61 | 0.29 | 350.00 | 0.8771 | 0.7125 | |||
| UTHR / United Therapeutics Corporation | 0.00 | -6.41 | 0.28 | -7.82 | 0.8625 | 0.0747 | |||
| AMGN / Amgen Inc. | 0.00 | 5.37 | 0.28 | -14.81 | 0.8410 | 0.0105 | |||
| KHC / The Kraft Heinz Company | 0.01 | 41.65 | 0.28 | 24.32 | 0.8409 | 0.2697 | |||
| BRBR / BellRing Brands, Inc. | 0.00 | -11.62 | 0.28 | 9.56 | 0.8394 | 0.1952 | |||
| MTG / MGIC Investment Corporation | 0.01 | 94.28 | 0.27 | 80.54 | 0.8194 | 0.4361 | |||
| INCY / Incyte Corporation | 0.00 | 22.41 | 0.27 | 28.23 | 0.8165 | 0.2792 | |||
| MU / Micron Technology, Inc. | 0.00 | 19.39 | 0.27 | -2.93 | 0.8078 | 0.1060 | |||
| GM / General Motors Company | 0.00 | 13.68 | 0.26 | 35.05 | 0.7979 | 0.3006 | |||
| CTSH / Cognizant Technology Solutions Corporation | 0.00 | 6.64 | 0.26 | 6.25 | 0.7784 | 0.1618 | |||
| AMAT / Applied Materials, Inc. | 0.00 | -9.20 | 0.23 | -26.87 | 0.7134 | -0.1082 | |||
| SNX / TD SYNNEX Corporation | 0.00 | -14.24 | 0.23 | -16.19 | 0.7098 | -0.0034 | |||
| KIM / Kimco Realty Corporation | 0.01 | 27.85 | 0.23 | 29.44 | 0.7096 | 0.2466 | |||
| EXEL / Exelixis, Inc. | 0.01 | -38.58 | 0.23 | -21.23 | 0.7015 | -0.0476 | |||
| NVR / NVR, Inc. | 0.00 | -15.15 | 0.23 | -29.10 | 0.6972 | -0.1325 | |||
| NEM / Newmont Corporation | 0.01 | 67.67 | 0.23 | 16.92 | 0.6957 | 0.1942 | |||
| RTX / RTX Corporation | 0.00 | -11.34 | 0.23 | -15.24 | 0.6943 | 0.0042 | |||
| FOXA / Fox Corporation | 0.00 | -56.93 | 0.23 | -50.55 | 0.6884 | -0.4839 | |||
| EMR / Emerson Electric Co. | 0.00 | -13.45 | 0.22 | -2.21 | 0.6749 | 0.0957 | |||
| ACN / Accenture plc | 0.00 | 12.82 | 0.22 | 12.31 | 0.6693 | 0.1676 | |||
| DELL / Dell Technologies Inc. | 0.00 | 100.00 | 0.22 | 95.50 | 0.6609 | 0.3748 | |||
| BRX / Brixmor Property Group Inc. | 0.01 | 23.20 | 0.21 | 23.08 | 0.6350 | 0.2009 | |||
| WDC / Western Digital Corporation | 0.00 | 74.71 | 0.21 | 52.21 | 0.6321 | 0.2834 | |||
| AXP / American Express Company | 0.00 | -72.10 | 0.21 | -55.72 | 0.6252 | 0.0862 | |||
| PM / Philip Morris International Inc. | 0.00 | 70.35 | 0.20 | 69.17 | 0.6210 | 0.3115 | |||
| HPQ / HP Inc. | 0.01 | -8.48 | 0.20 | -16.94 | 0.6142 | -0.0067 | |||
| ACI / Albertsons Companies, Inc. | 0.01 | 0.20 | 0.6095 | 0.6095 | |||||
| OMC / Omnicom Group Inc. | 0.00 | 13.34 | 0.20 | -5.77 | 0.5988 | 0.0644 | |||
| PPC / Pilgrim's Pride Corporation | 0.00 | 74.60 | 0.19 | 73.21 | 0.5918 | 0.3024 | |||
| MTDR / Matador Resources Company | 0.00 | 42.01 | 0.19 | 62.18 | 0.5888 | 0.2823 | |||
| TT / Trane Technologies plc | 0.00 | 110.08 | 0.19 | 159.46 | 0.5858 | 0.4166 | |||
| RPM / RPM International Inc. | 0.00 | -3.65 | 0.19 | -2.05 | 0.5840 | 0.0824 | |||
| SYF / Synchrony Financial | 0.00 | -16.55 | 0.19 | 9.14 | 0.5817 | 0.1315 | |||
| HON / Honeywell International Inc. | 0.00 | 93.76 | 0.19 | 112.36 | 0.5769 | 0.3476 | |||
| AYI / Acuity Inc. | 0.00 | 224.62 | 0.19 | 248.15 | 0.5745 | 0.4341 | |||
| KMB / Kimberly-Clark Corporation | 0.00 | 32.57 | 0.18 | 22.30 | 0.5521 | 0.1715 | |||
| ILMN / Illumina, Inc. | 0.00 | -30.49 | 0.18 | -28.57 | 0.5333 | -0.0969 | |||
| TDG / TransDigm Group Incorporated | 0.00 | 22.12 | 0.17 | 8.07 | 0.5324 | 0.1192 | |||
| ANTM / Anthem Inc | 0.00 | -46.22 | 0.17 | -61.89 | 0.5278 | -0.6367 | |||
| ATR / AptarGroup, Inc. | 0.00 | -13.31 | 0.17 | -15.27 | 0.5265 | 0.0053 | |||
| GPC / Genuine Parts Company | 0.00 | -19.60 | 0.15 | -33.03 | 0.4535 | -0.1144 | |||
| DOX / Amdocs Limited | 0.00 | -13.65 | 0.15 | -15.91 | 0.4525 | -0.0007 | |||
| ALSN / Allison Transmission Holdings, Inc. | 0.00 | 1.59 | 0.14 | 15.00 | 0.4204 | 0.1107 | |||
| CXT / Crane NXT, Co. | 0.00 | 0.14 | 0.4202 | 0.4202 | |||||
| MDT / Medtronic plc | 0.00 | -54.39 | 0.14 | -59.64 | 0.4156 | -0.4488 | |||
| PARA / Paramount Global | 0.01 | 67.82 | 0.14 | 64.63 | 0.4133 | 0.2029 | |||
| PHM / PulteGroup, Inc. | 0.00 | -49.18 | 0.14 | -61.54 | 0.4124 | -0.4879 | |||
| WAB / Westinghouse Air Brake Technologies Corporation | 0.00 | 184.07 | 0.12 | 195.12 | 0.3705 | 0.2653 | |||
| BHF / Brighthouse Financial, Inc. | 0.00 | -10.45 | 0.12 | -0.85 | 0.3571 | 0.0516 | |||
| UHS / Universal Health Services, Inc. | 0.00 | 0.12 | 0.3539 | 0.3539 | |||||
| NTRS / Northern Trust Corporation | 0.00 | 0.12 | 0.3520 | 0.3520 | |||||
| BLD / TopBuild Corp. | 0.00 | -40.97 | 0.11 | -55.14 | 0.3346 | -0.2887 | |||
| GMED / Globus Medical, Inc. | 0.00 | 61.74 | 0.11 | 87.93 | 0.3331 | 0.1832 | |||
| HAL / Halliburton Company | 0.00 | 0.11 | 0.3285 | 0.3285 | |||||
| FNF / Fidelity National Financial, Inc. | 0.00 | 0.11 | 0.3259 | 0.3259 | |||||
| MO / Altria Group, Inc. | 0.00 | -88.98 | 0.11 | -86.36 | 0.3246 | -0.9125 | |||
| STLD / Steel Dynamics, Inc. | 0.00 | 163.74 | 0.11 | 140.91 | 0.3233 | 0.2093 | |||
| FFIV / F5, Inc. | 0.00 | 20.06 | 0.11 | 38.16 | 0.3208 | 0.1239 | |||
| APTV / Aptiv PLC | 0.00 | 25.31 | 0.10 | 5.10 | 0.3163 | 0.0634 | |||
| CPB / The Campbell's Company | 0.00 | -13.64 | 0.10 | -26.28 | 0.3099 | -0.0429 | |||
| CL / Colgate-Palmolive Company | 0.00 | -10.98 | 0.10 | -22.22 | 0.3005 | -0.0239 | |||
| AMG / Affiliated Managers Group, Inc. | 0.00 | -49.43 | 0.10 | -47.57 | 0.2972 | -0.1784 | |||
| CHRW / C.H. Robinson Worldwide, Inc. | 0.00 | 0.09 | 0.2730 | 0.2730 | |||||
| NRG / NRG Energy, Inc. | 0.00 | -81.36 | 0.09 | -75.36 | 0.2642 | -0.5297 | |||
| APA / APA Corporation | 0.00 | 51.15 | 0.08 | 43.10 | 0.2530 | 0.1038 | |||
| CEG / Constellation Energy Corporation | 0.00 | -71.44 | 0.08 | -75.67 | 0.2527 | -0.6128 | |||
| WU / The Western Union Company | 0.01 | 55.55 | 0.08 | 37.29 | 0.2489 | 0.0973 | |||
| CHK / Chesapeake Energy Corporation | 0.00 | 0.08 | 0.2482 | 0.2482 | |||||
| MCK / McKesson Corporation | 0.00 | 64.37 | 0.08 | 88.37 | 0.2481 | 0.1379 | |||
| YETI / YETI Holdings, Inc. | 0.00 | 72.57 | 0.08 | 61.22 | 0.2434 | 0.1169 | |||
| AFL / Aflac Incorporated | 0.00 | -83.85 | 0.08 | -85.06 | 0.2377 | -1.1017 | |||
| CAH / Cardinal Health, Inc. | 0.00 | 59.95 | 0.08 | 72.73 | 0.2344 | 0.1191 | |||
| WFC / Wells Fargo & Company | 0.00 | -14.79 | 0.08 | 7.04 | 0.2316 | 0.0476 | |||
| MOH / Molina Healthcare, Inc. | 0.00 | -16.16 | 0.07 | -29.41 | 0.2206 | -0.0416 | |||
| XYZ / Block, Inc. | 0.00 | -31.19 | 0.07 | -13.58 | 0.2158 | 0.0073 | |||
| AIZ / Assurant, Inc. | 0.00 | -11.60 | 0.07 | -4.23 | 0.2077 | 0.0233 | |||
| TW / Tradeweb Markets Inc. | 0.00 | 44.44 | 0.07 | 53.49 | 0.2021 | 0.0908 | |||
| M / Macy's, Inc. | 0.00 | 71.35 | 0.07 | 46.67 | 0.2019 | 0.0980 | |||
| VIRT / Virtu Financial, Inc. | 0.00 | -81.36 | 0.07 | -61.40 | 0.2013 | -0.0717 | |||
| FLO / Flowers Foods, Inc. | 0.00 | 65.32 | 0.06 | 39.13 | 0.1975 | 0.1406 | |||
| GIS / General Mills, Inc. | 0.00 | -14.09 | 0.06 | -25.58 | 0.1953 | -0.0263 | |||
| CMI / Cummins Inc. | 0.00 | -28.11 | 0.06 | -22.50 | 0.1900 | -0.0166 | |||
| LYB / LyondellBasell Industries N.V. | 0.00 | -15.76 | 0.06 | -35.11 | 0.1886 | -0.0547 | |||
| OKE / ONEOK, Inc. | 0.00 | -42.76 | 0.06 | -36.67 | 0.1739 | -0.0582 | |||
| HUBB / Hubbell Incorporated | 0.00 | -81.07 | 0.06 | -81.52 | 0.1709 | -0.6062 | |||
| BWA / BorgWarner Inc. | 0.00 | 53.58 | 0.05 | 35.00 | 0.1662 | 0.0622 | |||
| ZM / Zoom Communications Inc. | 0.00 | -26.59 | 0.05 | -14.52 | 0.1632 | 0.0033 | |||
| HWM / Howmet Aerospace Inc. | 0.00 | 0.05 | 0.1562 | 0.1562 | |||||
| CVX / Chevron Corporation | 0.00 | -88.13 | 0.05 | -88.43 | 0.1539 | -0.9555 | |||
| IBKR / Interactive Brokers Group, Inc. | 0.00 | -39.75 | 0.05 | -23.08 | 0.1533 | -0.0156 | |||
| MSA / MSA Safety Incorporated | 0.00 | -14.49 | 0.05 | -20.97 | 0.1519 | -0.0080 | |||
| CHD / Church & Dwight Co., Inc. | 0.00 | -11.32 | 0.05 | -10.91 | 0.1498 | 0.0076 | |||
| GPN / Global Payments Inc. | 0.00 | -41.67 | 0.05 | -36.62 | 0.1385 | -0.0441 | |||
| EWBC / East West Bancorp, Inc. | 0.00 | -65.27 | 0.05 | -59.82 | 0.1376 | -0.1505 | |||
| MRNA / Moderna, Inc. | 0.00 | 0.04 | 0.1362 | 0.1362 | |||||
| F / Ford Motor Company | 0.00 | -29.64 | 0.04 | -33.33 | 0.1283 | -0.0354 | |||
| HRL / Hormel Foods Corporation | 0.00 | 0.04 | 0.1233 | 0.1233 | |||||
| HOLX / Hologic, Inc. | 0.00 | -14.26 | 0.04 | -23.53 | 0.1200 | -0.0131 | |||
| SN / SharkNinja, Inc. | 0.00 | 0.04 | 0.1200 | 0.1200 | |||||
| OHI / Omega Healthcare Investors, Inc. | 0.00 | -12.28 | 0.04 | -17.39 | 0.1160 | -0.0037 | |||
| HPE / Hewlett Packard Enterprise Company | 0.00 | -85.78 | 0.04 | -85.43 | 0.1152 | -0.5380 | |||
| C / Citigroup Inc. | 0.00 | -57.55 | 0.04 | -53.16 | 0.1151 | -0.0878 | |||
| OGN / Organon & Co. | 0.00 | 31.66 | 0.03 | 3.03 | 0.1037 | 0.0187 | |||
| WBD / Warner Bros. Discovery, Inc. | 0.00 | -76.48 | 0.03 | -70.27 | 0.1026 | -0.1840 | |||
| AJG / Arthur J. Gallagher & Co. | 0.00 | -91.75 | 0.03 | -91.73 | 0.1011 | -0.9219 | |||
| ROKU / Roku, Inc. | 0.00 | -21.45 | 0.03 | -23.81 | 0.1003 | -0.0076 | |||
| GNTX / Gentex Corporation | 0.00 | 8.02 | 0.03 | 3.23 | 0.0989 | 0.0193 | |||
| ARW / Arrow Electronics, Inc. | 0.00 | -5.08 | 0.03 | -20.51 | 0.0964 | -0.0040 | |||
| IAC / IAC Inc. | 0.00 | -87.61 | 0.03 | -89.51 | 0.0926 | -0.3633 | |||
| US6389959106 / Prime Portfolio | 0.03 | -93.60 | 0.03 | -93.72 | 0.0871 | -1.0578 | |||
| GRAL / GRAIL, Inc. | 0.00 | 0.03 | 0.0860 | 0.0860 | |||||
| COIN / Coinbase Global, Inc. | 0.00 | -28.48 | 0.03 | 0.00 | 0.0816 | 0.0127 | |||
| US4039491000 / HF Sinclair Corp. | 0.00 | -100.00 | 0.00 | -100.00 | -0.0763 | ||||
| VLO / Valero Energy Corporation | 0.00 | -100.00 | 0.00 | -100.00 | -0.3283 | ||||
| WPC / W. P. Carey Inc. | 0.00 | -100.00 | 0.00 | -100.00 | -0.1030 | ||||
| COO / The Cooper Companies, Inc. | 0.00 | -100.00 | 0.00 | -100.00 | -0.4065 |