Statistik Asas
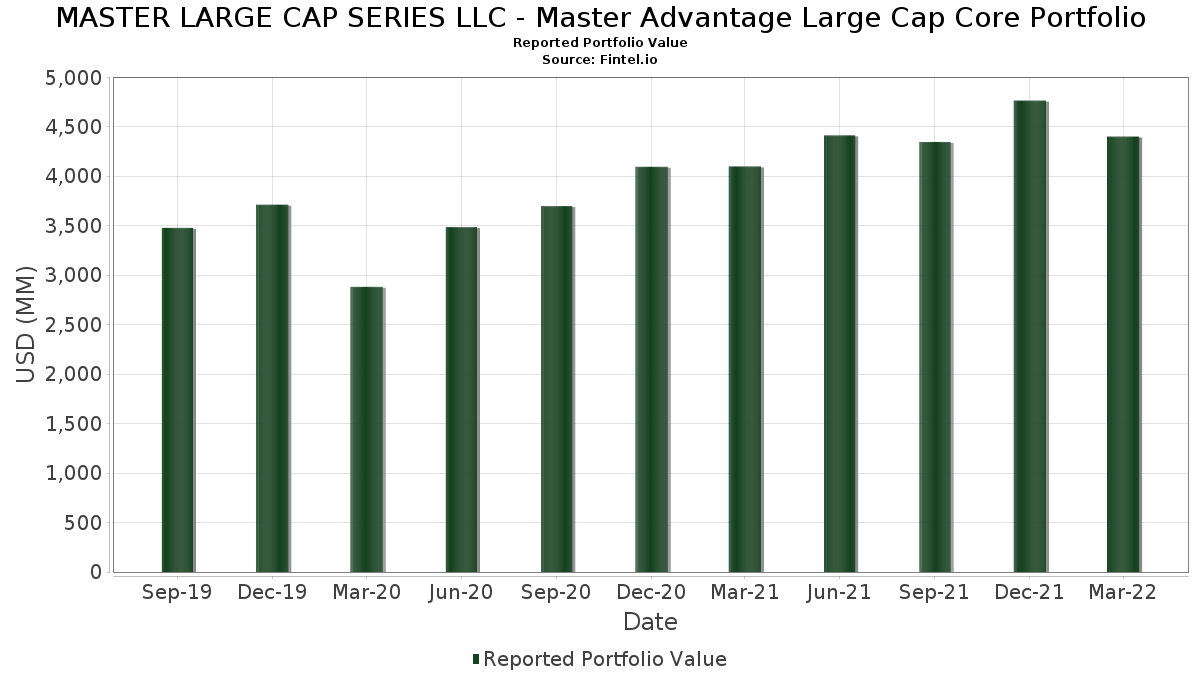
| Nilai Portfolio | $ 4,400,692,104 |
| Kedudukan Semasa | 242 |
Pegangan Terkini, Prestasi, AUM (dari 13F, 13D)
MASTER LARGE CAP SERIES LLC - Master Advantage Large Cap Core Portfolio telah mendedahkan 242 jumlah pegangan dalam pemfailan SEC terkini mereka. Nilai portfolio terkini dikira sebagai $ 4,400,692,104 USD. Aset Sebenar Di Bawah Pengurusan (AUM) ialah nilai ini ditambah dengan tunai (yang tidak didedahkan). Pegangan teratas MASTER LARGE CAP SERIES LLC - Master Advantage Large Cap Core Portfolio ialah Apple Inc. (US:AAPL) , Microsoft Corporation (US:MSFT) , Amazon.com, Inc. (US:AMZN) , Alphabet Inc. (US:GOOGL) , and Tesla, Inc. (US:TSLA) . Kedudukan baharu MASTER LARGE CAP SERIES LLC - Master Advantage Large Cap Core Portfolio termasuk General Dynamics Corporation (US:GD) , Eaton Corporation plc (US:ETN) , Crown Castle Inc. (US:CCI) , Liberty Broadband Corporation (US:LBRDA) , and Monolithic Power Systems, Inc. (US:MPWR) .
Kenaikan Teratas Suku Tahun Ini
Kami menggunakan perubahan dalam peruntukan portfolio kerana ini adalah metrik yang paling bermakna. Perubahan boleh disebabkan oleh perdagangan atau perubahan dalam harga saham.
| Sekuriti | Saham (MM) |
Nilai (MM$) |
Portfolio % | ΔPortfolio % |
|---|---|---|---|---|
| 0.74 | 61.00 | 1.3885 | 1.3885 | |
| 0.19 | 45.19 | 1.0286 | 1.0286 | |
| 0.84 | 258.27 | 5.8791 | 1.0284 | |
| 1.22 | 50.34 | 1.1460 | 1.0181 | |
| 0.31 | 41.89 | 0.9536 | 0.7295 | |
| 0.27 | 31.86 | 0.7252 | 0.7142 | |
| 0.08 | 91.13 | 2.0745 | 0.5623 | |
| 0.13 | 24.08 | 0.5481 | 0.5481 | |
| 0.52 | 23.07 | 0.5251 | 0.5251 | |
| 0.05 | 27.67 | 0.6299 | 0.5207 |
Penurunan Teratas Suku Tahun Ini
Kami menggunakan perubahan dalam peruntukan portfolio kerana ini adalah metrik yang paling bermakna. Perubahan boleh disebabkan oleh perdagangan atau perubahan dalam harga saham.
| Sekuriti | Saham (MM) |
Nilai (MM$) |
Portfolio % | ΔPortfolio % |
|---|---|---|---|---|
| 0.07 | 12.09 | 0.2752 | -0.8444 | |
| 0.02 | 1.78 | 0.0406 | -0.8251 | |
| 0.06 | 27.48 | 0.6255 | -0.7385 | |
| 0.17 | 13.32 | 0.3031 | -0.7031 | |
| 0.00 | 0.00 | -0.6244 | ||
| 0.06 | 7.55 | 0.1718 | -0.6062 | |
| 0.04 | 101.81 | 2.3174 | -0.6039 | |
| 0.04 | 11.86 | 0.2700 | -0.5578 | |
| 0.15 | 11.62 | 0.2644 | -0.5117 | |
| 0.02 | 1.72 | 0.0392 | -0.4895 |
13F dan Pemfailan Dana
Borang ini telah difailkan pada 2022-05-26 untuk tempoh pelaporan 2022-03-31. Klik ikon pautan untuk melihat sejarah transaksi penuh.
Tingkatkan untuk membuka data premium dan eksport ke Excel ![]() .
.
| Sekuriti | Jenis | Purata Harga Saham | Saham (MM) |
ΔSaham (%) |
ΔSaham (%) |
Nilai ($MM) |
Portfolio (%) |
ΔPortfolio (%) |
|
|---|---|---|---|---|---|---|---|---|---|
| AAPL / Apple Inc. | 1.56 | 0.86 | 271.65 | -0.83 | 6.1837 | 0.4007 | |||
| MSFT / Microsoft Corporation | 0.84 | 22.63 | 258.27 | 12.41 | 5.8791 | 1.0284 | |||
| AMZN / Amazon.com, Inc. | 0.05 | -6.72 | 154.61 | -8.81 | 3.5194 | -0.0600 | |||
| GOOGL / Alphabet Inc. | 0.04 | -23.36 | 101.81 | -26.42 | 2.3174 | -0.6039 | |||
| TSLA / Tesla, Inc. | 0.08 | 24.78 | 91.13 | 27.23 | 2.0745 | 0.5623 | |||
| JNJ / Johnson & Johnson | 0.50 | -12.21 | 87.83 | -9.05 | 1.9993 | -0.0394 | |||
| GOOG / Alphabet Inc. | 0.03 | -2.54 | 79.72 | -5.92 | 1.8148 | 0.0256 | |||
| V / Visa Inc. | 0.35 | -16.03 | 77.14 | -14.06 | 1.7559 | -0.1392 | |||
| PLD / Prologis, Inc. | 0.38 | -3.09 | 61.77 | -7.05 | 1.4061 | 0.0030 | |||
| XOM / Exxon Mobil Corporation | 0.74 | 61.00 | 1.3885 | 1.3885 | |||||
| NVDA / NVIDIA Corporation | 0.22 | -16.75 | 60.08 | -22.77 | 1.3675 | -0.2747 | |||
| CL / Colgate-Palmolive Company | 0.74 | 7.12 | 55.74 | -4.82 | 1.2687 | 0.0325 | |||
| MET / MetLife, Inc. | 0.76 | -7.87 | 53.42 | 3.61 | 1.2160 | 0.1275 | |||
| A / Agilent Technologies, Inc. | 0.39 | 10.93 | 51.34 | -8.05 | 1.1686 | -0.0102 | |||
| ZTS / Zoetis Inc. | 0.27 | 6.68 | 51.12 | -17.56 | 1.1637 | -0.1454 | |||
| ITW / Illinois Tool Works Inc. | 0.24 | 11.66 | 51.05 | -5.26 | 1.1622 | 0.0244 | |||
| BAC / Bank of America Corporation | 1.22 | 797.15 | 50.34 | 731.27 | 1.1460 | 1.0181 | |||
| ECL / Ecolab Inc. | 0.27 | 123.63 | 48.06 | 68.31 | 1.0941 | 0.4912 | |||
| EOG / EOG Resources, Inc. | 0.39 | -40.58 | 46.30 | -20.25 | 1.0539 | -0.1717 | |||
| GD / General Dynamics Corporation | 0.19 | 45.19 | 1.0286 | 1.0286 | |||||
| VOYA / Voya Financial, Inc. | 0.68 | -15.75 | 44.96 | -15.70 | 1.0235 | -0.1026 | |||
| INTC / Intel Corporation | 0.90 | 1.46 | 44.60 | -2.37 | 1.0152 | 0.0508 | |||
| META / Meta Platforms, Inc. | 0.20 | 29.33 | 44.22 | -14.50 | 1.0067 | -0.0854 | |||
| MMC / Marsh & McLennan Companies, Inc. | 0.26 | -29.98 | 43.70 | -31.35 | 0.9948 | -0.3491 | |||
| US09248U7182 / BlackRock Liquidity Funds: T-Fund, Institutional Shares | 43.57 | -21.64 | 43.57 | -21.64 | 0.9917 | -0.1821 | |||
| DHR / Danaher Corporation | 0.15 | 0.00 | 43.12 | -10.84 | 0.9815 | -0.0396 | |||
| JPM / JPMorgan Chase & Co. | 0.31 | 358.60 | 41.89 | 294.82 | 0.9536 | 0.7295 | |||
| NOW / ServiceNow, Inc. | 0.08 | -5.78 | 41.77 | -19.17 | 0.9508 | -0.1402 | |||
| CMCSA / Comcast Corporation | 0.89 | 98.54 | 41.49 | 84.70 | 0.9445 | 0.4702 | |||
| ADBE / Adobe Inc. | 0.09 | -17.97 | 40.47 | -34.09 | 0.9212 | -0.3751 | |||
| ANTM / Anthem Inc | 0.08 | 27.66 | 39.93 | 35.28 | 0.9090 | 0.2858 | |||
| IDXX / IDEXX Laboratories, Inc. | 0.07 | -15.98 | 39.23 | -30.19 | 0.8930 | -0.2935 | |||
| HD / The Home Depot, Inc. | 0.13 | 138.76 | 38.46 | 72.21 | 0.8756 | 0.4040 | |||
| WDAY / Workday, Inc. | 0.16 | -8.47 | 37.89 | -19.76 | 0.8626 | -0.1345 | |||
| AMGN / Amgen Inc. | 0.16 | 5.56 | 37.84 | 13.46 | 0.8613 | 0.1572 | |||
| COST / Costco Wholesale Corporation | 0.07 | -37.43 | 37.56 | -36.53 | 0.8549 | -0.3943 | |||
| AMD / Advanced Micro Devices, Inc. | 0.34 | 30.89 | 37.54 | -0.54 | 0.8546 | 0.0576 | |||
| TGT / Target Corporation | 0.18 | -15.01 | 37.29 | -22.06 | 0.8488 | -0.1613 | |||
| SPGI / S&P Global Inc. | 0.09 | 34.53 | 36.23 | 16.93 | 0.8248 | 0.1706 | |||
| DELL / Dell Technologies Inc. | 0.72 | -19.14 | 35.98 | -27.75 | 0.8191 | -0.2324 | |||
| ALLY / Ally Financial Inc. | 0.79 | -4.13 | 34.35 | -12.45 | 0.7819 | -0.0464 | |||
| FIS / Fidelity National Information Services, Inc. | 0.33 | 4.49 | 32.92 | -3.87 | 0.7494 | 0.0264 | |||
| MRK / Merck & Co., Inc. | 0.39 | 190.43 | 32.34 | 210.95 | 0.7362 | 0.5166 | |||
| ETR / Entergy Corporation | 0.27 | 5,783.55 | 31.86 | 6,003.07 | 0.7252 | 0.7142 | |||
| CUBE / CubeSmart | 0.57 | 32.58 | 29.63 | 21.21 | 0.6745 | 0.1584 | |||
| FOXA / Fox Corporation | 0.73 | 261.54 | 28.88 | 286.56 | 0.6575 | 0.4997 | |||
| OGE / OGE Energy Corp. | 0.71 | -21.60 | 28.82 | -16.70 | 0.6561 | -0.0744 | |||
| TMO / Thermo Fisher Scientific Inc. | 0.05 | 504.48 | 27.67 | 435.10 | 0.6299 | 0.5207 | |||
| INTU / Intuit Inc. | 0.06 | -43.10 | 27.48 | -57.47 | 0.6255 | -0.7385 | |||
| LMT / Lockheed Martin Corporation | 0.06 | -23.80 | 27.14 | -5.37 | 0.6178 | 0.0123 | |||
| PYPL / PayPal Holdings, Inc. | 0.23 | 117.42 | 26.89 | 33.34 | 0.6120 | 0.1863 | |||
| TRV / The Travelers Companies, Inc. | 0.14 | 0.00 | 26.45 | 16.81 | 0.6021 | 0.1240 | |||
| DTE / DTE Energy Company | 0.20 | -19.14 | 26.30 | -10.57 | 0.5986 | -0.0222 | |||
| AXP / American Express Company | 0.14 | -10.43 | 26.30 | 2.37 | 0.5986 | 0.0563 | |||
| QCOM / QUALCOMM Incorporated | 0.17 | 58.36 | 26.17 | 32.35 | 0.5958 | 0.1782 | |||
| UPS / United Parcel Service, Inc. | 0.12 | 248.95 | 26.00 | 249.17 | 0.5919 | 0.4347 | |||
| BA / The Boeing Company | 0.13 | 24.08 | 0.5481 | 0.5481 | |||||
| CRM / Salesforce, Inc. | 0.11 | 47.45 | 23.89 | 23.19 | 0.5437 | 0.1344 | |||
| BSX / Boston Scientific Corporation | 0.52 | 23.07 | 0.5251 | 0.5251 | |||||
| HPE / Hewlett Packard Enterprise Company | 1.38 | -54.57 | 23.00 | -51.86 | 0.5234 | -0.4851 | |||
| C / Citigroup Inc. | 0.43 | 0.00 | 22.90 | -11.57 | 0.5212 | -0.0255 | |||
| SYNH / Syneos Health Inc - Class A | 0.28 | 849.02 | 22.79 | 648.37 | 0.5187 | 0.4544 | |||
| PFE / Pfizer Inc. | 0.43 | 24.95 | 22.43 | 9.54 | 0.5105 | 0.0783 | |||
| LSI / Life Storage Inc - Registered Shares | 0.16 | 0.00 | 21.83 | -8.32 | 0.4969 | -0.0058 | |||
| MRO / Marathon Oil Corporation | 0.87 | 21.74 | 0.4949 | 0.4949 | |||||
| RS / Reliance, Inc. | 0.12 | 50.12 | 21.37 | 69.67 | 0.4865 | 0.2206 | |||
| SLB / Schlumberger Limited | 0.52 | -63.88 | 21.37 | -50.19 | 0.4863 | -0.4192 | |||
| HPQ / HP Inc. | 0.57 | 20.75 | 0.4724 | 0.4724 | |||||
| TDOC / Teladoc Health, Inc. | 0.28 | 316.21 | 19.97 | 226.99 | 0.4545 | 0.3256 | |||
| WMT / Walmart Inc. | 0.13 | 3.56 | 19.64 | 6.59 | 0.4470 | 0.0580 | |||
| KEYS / Keysight Technologies, Inc. | 0.12 | 47.96 | 19.60 | 13.18 | 0.4461 | 0.0805 | |||
| RF / Regions Financial Corporation | 0.87 | 73.14 | 19.36 | 76.80 | 0.4406 | 0.2095 | |||
| BWA / BorgWarner Inc. | 0.49 | -26.99 | 19.14 | -36.99 | 0.4356 | -0.2055 | |||
| HEI.A / HEICO Corporation | 0.15 | 18.70 | 0.4257 | 0.4257 | |||||
| SITE / SiteOne Landscape Supply, Inc. | 0.11 | 114.02 | 18.31 | 42.82 | 0.4169 | 0.1462 | |||
| ETN / Eaton Corporation plc | 0.12 | 18.26 | 0.4156 | 0.4156 | |||||
| BRK.B / Berkshire Hathaway Inc. | 0.05 | 185.50 | 18.03 | 237.01 | 0.4104 | 0.2975 | |||
| MCK / McKesson Corporation | 0.06 | -51.56 | 17.21 | -40.34 | 0.3917 | -0.2172 | |||
| TNL / Travel + Leisure Co. | 0.29 | 430.97 | 16.64 | 456.66 | 0.3789 | 0.3157 | |||
| LSTR / Landstar System, Inc. | 0.11 | 4.39 | 16.05 | -12.05 | 0.3653 | -0.0199 | |||
| UNH / UnitedHealth Group Incorporated | 0.03 | -22.18 | 15.59 | -20.97 | 0.3548 | -0.0616 | |||
| NEE / NextEra Energy, Inc. | 0.18 | 43.41 | 15.58 | 30.13 | 0.3545 | 0.1018 | |||
| KDP / Keurig Dr Pepper Inc. | 0.41 | 38.99 | 15.46 | 42.91 | 0.3520 | 0.1236 | |||
| PG / The Procter & Gamble Company | 0.10 | 0.00 | 15.40 | -6.59 | 0.3507 | 0.0025 | |||
| BF.B / Brown-Forman Corporation | 0.22 | 14.72 | 0.3352 | 0.3352 | |||||
| WHR / Whirlpool Corporation | 0.08 | -3.37 | 14.67 | -28.86 | 0.3339 | -0.1014 | |||
| CDNS / Cadence Design Systems, Inc. | 0.09 | 9.68 | 14.14 | -3.20 | 0.3219 | 0.0135 | |||
| EXR / Extra Space Storage Inc. | 0.07 | 33.57 | 13.76 | 21.13 | 0.3131 | 0.0733 | |||
| HON / Honeywell International Inc. | 0.07 | 16.66 | 13.69 | 8.86 | 0.3115 | 0.0461 | |||
| PSX / Phillips 66 | 0.16 | 9.71 | 13.52 | 30.80 | 0.3077 | 0.0895 | |||
| OTIS / Otis Worldwide Corporation | 0.17 | -68.38 | 13.32 | -72.06 | 0.3031 | -0.7031 | |||
| HRB / H&R Block, Inc. | 0.50 | -5.23 | 13.11 | 4.75 | 0.2984 | 0.0342 | |||
| MKC / McCormick & Company, Incorporated | 0.13 | 0.00 | 13.10 | 3.30 | 0.2982 | 0.0305 | |||
| PEP / PepsiCo, Inc. | 0.08 | 113.46 | 12.88 | 105.69 | 0.2932 | 0.1610 | |||
| MCD / McDonald's Corporation | 0.05 | 0.00 | 12.45 | -7.76 | 0.2834 | -0.0015 | |||
| ADP / Automatic Data Processing, Inc. | 0.05 | -54.24 | 12.40 | -57.78 | 0.2822 | -0.3377 | |||
| CVS / CVS Health Corporation | 0.12 | 217.79 | 12.21 | 211.80 | 0.2779 | 0.1952 | |||
| FRC / First Republic Bank | 0.07 | -70.95 | 12.09 | -77.20 | 0.2752 | -0.8444 | |||
| SLAB / Silicon Laboratories Inc. | 0.08 | 276.83 | 11.97 | 174.19 | 0.2726 | 0.1804 | |||
| EL / The Estée Lauder Companies Inc. | 0.04 | -58.88 | 11.86 | -69.75 | 0.2700 | -0.5578 | |||
| EFX / Equifax Inc. | 0.05 | -57.69 | 11.85 | -65.74 | 0.2698 | -0.4605 | |||
| MA / Mastercard Incorporated | 0.03 | 21.97 | 11.72 | 21.31 | 0.2669 | 0.0628 | |||
| R / Ryder System, Inc. | 0.15 | -67.16 | 11.62 | -68.40 | 0.2644 | -0.5117 | |||
| MTD / Mettler-Toledo International Inc. | 0.01 | 10.79 | 0.2457 | 0.2457 | |||||
| FLEX / Flex Ltd. | 0.57 | 0.00 | 10.65 | 1.20 | 0.2425 | 0.0203 | |||
| CCI / Crown Castle Inc. | 0.06 | 10.59 | 0.2412 | 0.2412 | |||||
| CAT / Caterpillar Inc. | 0.05 | -8.34 | 10.43 | -1.22 | 0.2373 | 0.0145 | |||
| SF / Stifel Financial Corp. | 0.15 | 0.00 | 10.36 | -3.58 | 0.2358 | 0.0090 | |||
| LBRDA / Liberty Broadband Corporation | 0.02 | 10.22 | 0.2326 | 0.2326 | |||||
| ROP / Roper Technologies, Inc. | 0.02 | 0.00 | 10.11 | -3.99 | 0.2301 | 0.0078 | |||
| PNC / The PNC Financial Services Group, Inc. | 0.05 | 19.81 | 10.01 | 10.21 | 0.2279 | 0.0361 | |||
| GM / General Motors Company | 0.23 | 9.96 | 0.2266 | 0.2266 | |||||
| ACN / Accenture plc | 0.03 | -15.84 | 9.89 | -31.54 | 0.2250 | -0.0798 | |||
| FCX / Freeport-McMoRan Inc. | 0.20 | 9.86 | 0.2245 | 0.2245 | |||||
| ALGN / Align Technology, Inc. | 0.02 | -7.55 | 9.74 | -38.67 | 0.2218 | -0.1136 | |||
| FDS / FactSet Research Systems Inc. | 0.02 | 0.00 | 9.25 | -10.67 | 0.2106 | -0.0081 | |||
| DVN / Devon Energy Corporation | 0.16 | 1,140.65 | 9.21 | 1,566.00 | 0.2097 | 0.1980 | |||
| HAL / Halliburton Company | 0.24 | 9.13 | 0.2077 | 0.2077 | |||||
| JNPR / Juniper Networks, Inc. | 0.25 | 0.00 | 9.12 | 4.06 | 0.2077 | 0.0226 | |||
| SCI / Service Corporation International | 0.14 | 0.00 | 9.06 | -7.29 | 0.2062 | -0.0001 | |||
| BIIB / Biogen Inc. | 0.04 | 335.70 | 8.92 | 282.42 | 0.2030 | 0.1538 | |||
| MPWR / Monolithic Power Systems, Inc. | 0.02 | 8.90 | 0.2026 | 0.2026 | |||||
| COF / Capital One Financial Corporation | 0.07 | 6.35 | 8.81 | -3.77 | 0.2006 | 0.0073 | |||
| LLY / Eli Lilly and Company | 0.03 | -68.39 | 8.79 | -67.23 | 0.2000 | -0.3661 | |||
| CRUS / Cirrus Logic, Inc. | 0.10 | 0.00 | 8.71 | -7.86 | 0.1983 | -0.0013 | |||
| MCO / Moody's Corporation | 0.03 | 513.22 | 8.53 | 429.89 | 0.1941 | 0.1601 | |||
| LIN / Linedata Services S.A. | 0.03 | 8.49 | 0.1933 | 0.1933 | |||||
| AME / AMETEK, Inc. | 0.06 | 33.76 | 8.33 | 21.14 | 0.1895 | 0.0444 | |||
| CI / The Cigna Group | 0.03 | -0.95 | 8.13 | 3.36 | 0.1851 | 0.0190 | |||
| MONEY MARKET SERIES LLC / STIV (000000000) | 7.95 | 4,935.33 | 7.95 | -23.85 | 0.1809 | -0.1190 | |||
| AMH / American Homes 4 Rent | 0.20 | 0.00 | 7.91 | -8.21 | 0.1801 | -0.0019 | |||
| RL / Ralph Lauren Corporation | 0.07 | 0.00 | 7.78 | -4.55 | 0.1771 | 0.0050 | |||
| LRCX / Lam Research Corporation | 0.01 | 0.00 | 7.72 | -25.24 | 0.1757 | -0.0423 | |||
| AMAT / Applied Materials, Inc. | 0.06 | -75.55 | 7.55 | -79.52 | 0.1718 | -0.6062 | |||
| SPOT / Spotify Technology S.A. | 0.05 | 6.47 | 7.47 | -31.30 | 0.1701 | -0.0595 | |||
| AEO / American Eagle Outfitters, Inc. | 0.41 | 0.00 | 6.96 | -33.65 | 0.1585 | -0.0631 | |||
| TU / TELUS Corporation | 0.29 | 6.96 | 0.1584 | 0.1584 | |||||
| CCEP / Coca-Cola Europacific Partners PLC | 0.14 | 0.00 | 6.81 | -13.08 | 0.1550 | -0.0104 | |||
| BRX / Brixmor Property Group Inc. | 0.26 | -7.80 | 6.69 | -6.35 | 0.1524 | 0.0015 | |||
| ROKU / Roku, Inc. | 0.05 | -16.24 | 6.62 | -54.02 | 0.1507 | -0.1533 | |||
| CW / Curtiss-Wright Corporation | 0.04 | 6.46 | 0.1470 | 0.1470 | |||||
| PNFP / Pinnacle Financial Partners, Inc. | 0.07 | 0.00 | 6.16 | -3.58 | 0.1402 | 0.0053 | |||
| CBRE / CBRE Group, Inc. | 0.07 | 0.00 | 6.06 | -15.65 | 0.1380 | -0.0138 | |||
| YUM / Yum! Brands, Inc. | 0.05 | 6.03 | 0.1373 | 0.1373 | |||||
| SQ / Block, Inc. | 0.04 | -41.55 | 5.96 | 27.95 | 0.1356 | 0.0018 | |||
| NOC / Northrop Grumman Corporation | 0.01 | 333.85 | 5.92 | 401.27 | 0.1347 | 0.1097 | |||
| TXN / Texas Instruments Incorporated | 0.03 | 0.00 | 5.84 | -2.65 | 0.1330 | 0.0063 | |||
| RGA / Reinsurance Group of America, Incorporated | 0.05 | 0.00 | 5.39 | -0.04 | 0.1228 | 0.0089 | |||
| CSX / CSX Corporation | 0.14 | 5.36 | 0.1221 | 0.1221 | |||||
| LEVI / Levi Strauss & Co. | 0.27 | -42.76 | 5.26 | -54.82 | 0.1198 | -0.1261 | |||
| VMC / Vulcan Materials Company | 0.03 | -28.70 | 5.21 | -36.90 | 0.1186 | -0.0557 | |||
| LII / Lennox International Inc. | 0.02 | 0.00 | 5.12 | -20.51 | 0.1165 | -0.0194 | |||
| MOH / Molina Healthcare, Inc. | 0.01 | 4.84 | 0.1102 | 0.1102 | |||||
| ATUS / Altice USA, Inc. | 0.39 | 157.47 | 4.83 | 98.64 | 0.1100 | 0.0586 | |||
| GS / The Goldman Sachs Group, Inc. | 0.01 | 307.27 | 4.62 | 251.63 | 0.1053 | 0.0775 | |||
| MDT / Medtronic plc | 0.04 | 399.18 | 4.58 | 435.32 | 0.1042 | 0.0861 | |||
| GPN / Global Payments Inc. | 0.03 | 0.00 | 4.55 | 1.22 | 0.1035 | 0.0087 | |||
| KLAC / KLA Corporation | 0.01 | 0.00 | 4.44 | -14.88 | 0.1011 | -0.0091 | |||
| K / Kellanova | 0.07 | 11.70 | 4.32 | 11.82 | 0.0984 | 0.0168 | |||
| VLO / Valero Energy Corporation | 0.04 | 4.29 | 0.0977 | 0.0977 | |||||
| ETSY / Etsy, Inc. | 0.03 | -2.94 | 4.28 | -42.00 | 0.0974 | -0.0725 | |||
| AMT / American Tower Corporation | 0.02 | 4.16 | 0.0946 | 0.0946 | |||||
| WDC / Western Digital Corporation | 0.08 | 13.43 | 4.06 | -13.62 | 0.0925 | -0.0068 | |||
| CMI / Cummins Inc. | 0.02 | 3.98 | 0.0905 | 0.0905 | |||||
| HEI / HEICO Corporation | 0.03 | 79.14 | 3.90 | 97.32 | 0.0889 | 0.0439 | |||
| CME E-Mini Standard & Poor's 500 Index / DE (000000000) | 3.74 | -64.16 | 0.0852 | -0.2148 | |||||
| USM / United States Cellular Corporation | 0.12 | -0.71 | 3.72 | -4.78 | 0.0848 | 0.0022 | |||
| LOW / Lowe's Companies, Inc. | 0.02 | 0.00 | 3.57 | -21.78 | 0.0813 | -0.0151 | |||
| BBY / Best Buy Co., Inc. | 0.04 | 3.55 | 0.0808 | 0.0808 | |||||
| ABBV / AbbVie Inc. | 0.02 | -83.60 | 3.41 | -80.36 | 0.0775 | -0.2886 | |||
| ABT / Abbott Laboratories | 0.03 | 0.00 | 3.34 | -15.92 | 0.0761 | -0.0078 | |||
| JWN / Nordstrom, Inc. | 0.12 | -65.65 | 3.28 | -58.84 | 0.0746 | -0.0935 | |||
| BG / Bunge Global SA | 0.03 | 3.08 | 0.0701 | 0.0701 | |||||
| WU / The Western Union Company | 0.16 | 3.06 | 0.0697 | 0.0697 | |||||
| ODFL / Old Dominion Freight Line, Inc. | 0.01 | 46.25 | 3.05 | 21.88 | 0.0694 | 0.0166 | |||
| HCC / Warrior Met Coal, Inc. | 0.01 | 3.01 | 0.0686 | 0.0686 | |||||
| MOS / The Mosaic Company | 0.05 | 59.98 | 3.01 | 170.68 | 0.0685 | 0.0451 | |||
| AAP / Advance Auto Parts, Inc. | 0.01 | -51.48 | 2.95 | -58.15 | 0.0671 | -0.0816 | |||
| CERN / Cerner Corp. | 0.03 | -0.39 | 2.87 | 0.35 | 0.0653 | 0.0050 | |||
| RDN / Radian Group Inc. | 0.12 | 0.00 | 2.76 | 5.10 | 0.0628 | 0.0074 | |||
| PM / Philip Morris International Inc. | 0.03 | 2.75 | 0.0626 | 0.0626 | |||||
| HUBS / HubSpot, Inc. | 0.01 | -5.71 | 2.69 | -32.08 | 0.0613 | -0.0224 | |||
| CIEN / Ciena Corporation | 0.04 | -54.38 | 2.62 | -48.94 | 0.0597 | -0.0885 | |||
| OVV / Ovintiv Inc. | 0.05 | 2.53 | 0.0577 | 0.0577 | |||||
| ELS / Equity LifeStyle Properties, Inc. | 0.03 | 2.53 | 0.0576 | 0.0576 | |||||
| RBLX / Roblox Corporation | 0.05 | 2.53 | 0.0576 | 0.0576 | |||||
| TPR / Tapestry, Inc. | 0.06 | -82.22 | 2.36 | -83.74 | 0.0536 | -0.2521 | |||
| CHD / Church & Dwight Co., Inc. | 0.02 | 2.20 | 0.0501 | 0.0501 | |||||
| COR / Cencora, Inc. | 0.01 | 0.00 | 2.11 | 16.42 | 0.0481 | 0.0098 | |||
| STLD / Steel Dynamics, Inc. | 0.02 | 2.07 | 0.0472 | 0.0472 | |||||
| WFC / Wells Fargo & Company | 0.04 | 2.01 | 0.0458 | 0.0458 | |||||
| TEL / TE Connectivity plc | 0.01 | 1.95 | 0.0444 | 0.0444 | |||||
| CTVA / Corteva, Inc. | 0.03 | 267.75 | 1.94 | 346.90 | 0.0443 | 0.0351 | |||
| EXPD / Expeditors International of Washington, Inc. | 0.02 | -94.34 | 1.78 | -95.65 | 0.0406 | -0.8251 | |||
| AGCO / AGCO Corporation | 0.01 | -50.17 | 1.78 | -2.03 | 0.0406 | -0.0088 | |||
| GRMN / Garmin Ltd. | 0.02 | 1.78 | 0.0405 | 0.0405 | |||||
| BRKR / Bruker Corporation | 0.03 | 0.00 | 1.75 | -23.35 | 0.0397 | -0.0084 | |||
| DFS / Discover Financial Services | 0.02 | 1.72 | 0.0392 | 0.0392 | |||||
| CHRW / C.H. Robinson Worldwide, Inc. | 0.02 | -93.13 | 1.72 | -93.13 | 0.0392 | -0.4895 | |||
| SNDR / Schneider National, Inc. | 0.07 | 0.00 | 1.70 | -5.23 | 0.0388 | 0.0008 | |||
| DPZ / Domino's Pizza, Inc. | 0.00 | -84.62 | 1.70 | -86.88 | 0.0387 | -0.2597 | |||
| EPAM / EPAM Systems, Inc. | 0.01 | 207.84 | 1.64 | 36.64 | 0.0374 | 0.0120 | |||
| CMS / CMS Energy Corporation | 0.02 | 0.00 | 1.57 | 7.55 | 0.0357 | 0.0049 | |||
| POR / Portland General Electric Company | 0.03 | 0.00 | 1.57 | 4.19 | 0.0356 | 0.0039 | |||
| BLDR / Builders FirstSource, Inc. | 0.02 | 108.13 | 1.49 | 56.72 | 0.0340 | 0.0139 | |||
| HBAN / Huntington Bancshares Incorporated | 0.10 | 0.00 | 1.48 | -5.18 | 0.0338 | 0.0007 | |||
| OC / Owens Corning | 0.02 | 0.00 | 1.40 | 1.09 | 0.0318 | 0.0026 | |||
| PAG / Penske Automotive Group, Inc. | 0.01 | -41.17 | 1.40 | -48.60 | 0.0318 | -0.0256 | |||
| TFC / Truist Financial Corporation | 0.02 | -92.84 | 1.33 | -93.08 | 0.0302 | -0.4111 | |||
| NKE / NIKE, Inc. | 0.01 | 1.24 | 0.0281 | 0.0281 | |||||
| NSC / Norfolk Southern Corporation | 0.00 | 1.20 | 0.0273 | 0.0273 | |||||
| IGT / International Game Technology PLC | 0.05 | 0.00 | 1.19 | -14.62 | 0.0271 | -0.0023 | |||
| AXON / Axon Enterprise, Inc. | 0.01 | 0.00 | 1.14 | -12.25 | 0.0259 | -0.0015 | |||
| NXPI / NXP Semiconductors N.V. | 0.01 | 1.10 | 0.0251 | 0.0251 | |||||
| ZNGA / Zynga Inc - Class A | 0.11 | -93.76 | 0.98 | -90.99 | 0.0222 | -0.2065 | |||
| KR / The Kroger Co. | 0.02 | 0.96 | 0.0218 | 0.0218 | |||||
| WMB / The Williams Companies, Inc. | 0.03 | -89.56 | 0.93 | -86.61 | 0.0211 | -0.1249 | |||
| BK / The Bank of New York Mellon Corporation | 0.02 | -93.71 | 0.88 | -93.98 | 0.0201 | -0.3175 | |||
| DISCK / Warner Bros.Discovery Inc - Series C | 0.03 | -0.40 | 0.83 | 8.62 | 0.0189 | 0.0028 | |||
| TEAM / Atlassian Corporation | 0.00 | 0.00 | 0.80 | -22.91 | 0.0183 | -0.0037 | |||
| TRGP / Targa Resources Corp. | 0.01 | -7.60 | 0.80 | 33.44 | 0.0183 | 0.0056 | |||
| ALL / The Allstate Corporation | 0.01 | 0.00 | 0.72 | 17.78 | 0.0164 | 0.0035 | |||
| MRCY / Mercury Systems, Inc. | 0.01 | -3.71 | 0.70 | 12.72 | 0.0159 | 0.0028 | |||
| CRL / Charles River Laboratories International, Inc. | 0.00 | 0.65 | 0.0148 | 0.0148 | |||||
| BMY / Bristol-Myers Squibb Company | 0.01 | -95.53 | 0.65 | -94.77 | 0.0147 | -0.2459 | |||
| EXPE / Expedia Group, Inc. | 0.00 | 0.63 | 0.0144 | 0.0144 | |||||
| CHH / Choice Hotels International, Inc. | 0.00 | 0.62 | 0.0142 | 0.0142 | |||||
| FANG / Diamondback Energy, Inc. | 0.00 | 0.61 | 0.0139 | 0.0139 | |||||
| SUI / Sun Communities, Inc. | 0.00 | 0.00 | 0.59 | -16.53 | 0.0135 | -0.0015 | |||
| FOX / Fox Corporation | 0.02 | 0.00 | 0.57 | 5.93 | 0.0130 | 0.0016 | |||
| SYK / Stryker Corporation | 0.00 | -80.66 | 0.54 | -80.68 | 0.0123 | -0.0467 | |||
| BOH / Bank of Hawaii Corporation | 0.01 | -74.80 | 0.52 | -74.77 | 0.0118 | -0.0317 | |||
| TER / Teradyne, Inc. | 0.00 | 0.52 | 0.0118 | 0.0118 | |||||
| PANW / Palo Alto Networks, Inc. | 0.00 | 0.51 | 0.0115 | 0.0115 | |||||
| NOVA / Sunnova Energy International Inc. | 0.02 | 0.00 | 0.48 | -17.39 | 0.0108 | -0.0013 | |||
| DKNG / DraftKings Inc. | 0.02 | 0.47 | 0.0107 | 0.0107 | |||||
| SCHW / The Charles Schwab Corporation | 0.01 | 0.45 | 0.0103 | 0.0103 | |||||
| BX / Blackstone Inc. | 0.00 | 0.44 | 0.0099 | 0.0099 | |||||
| RNG / RingCentral, Inc. | 0.00 | 23.68 | 0.42 | -61.80 | 0.0096 | -0.0177 | |||
| GT / The Goodyear Tire & Rubber Company | 0.02 | 0.27 | 0.0061 | 0.0061 | |||||
| RLJ / RLJ Lodging Trust | 0.00 | 0.00 | 0.00 | 0.00 | 0.0000 | 0.0000 | |||
| IDCC / InterDigital, Inc. | 0.00 | 0.00 | 0.00 | 0.0000 | -0.0000 | ||||
| DIS / The Walt Disney Company | 0.00 | -100.00 | 0.00 | -100.00 | -0.6244 | ||||
| ATH / Athene Holding Ltd - Class A | 0.00 | -100.00 | 0.00 | -100.00 | -0.0211 | ||||
| INFO / Harbor ETF Trust - Harbor PanAgora Dynamic Large Cap Core ETF | 0.00 | -100.00 | 0.00 | -100.00 | -0.1094 | ||||
| KSS / Kohl's Corporation | 0.00 | -100.00 | 0.00 | -100.00 | -0.0804 | ||||
| LYFT / Lyft, Inc. | 0.00 | -100.00 | 0.00 | -100.00 | -0.0076 | ||||
| OKTA / Okta, Inc. | 0.00 | -100.00 | 0.00 | -100.00 | -0.3071 | ||||
| MRNA / Moderna, Inc. | 0.00 | -100.00 | 0.00 | -100.00 | -0.0179 | ||||
| DKS / DICK'S Sporting Goods, Inc. | 0.00 | -100.00 | 0.00 | -100.00 | -0.0182 | ||||
| APO / Apollo Global Management, Inc. | 0.00 | -100.00 | 0.00 | -100.00 | -0.0944 | ||||
| CRWD / CrowdStrike Holdings, Inc. | 0.00 | -100.00 | 0.00 | -100.00 | -0.0204 | ||||
| ZI / ZoomInfo Technologies Inc. | 0.00 | -100.00 | 0.00 | -100.00 | -0.0345 | ||||
| CVX / Chevron Corporation | 0.00 | -100.00 | 0.00 | -100.00 | -0.1479 | ||||
| MQ / Marqeta, Inc. | 0.00 | -100.00 | 0.00 | -100.00 | -0.0070 | ||||
| VZ / Verizon Communications Inc. | 0.00 | -100.00 | 0.00 | -100.00 | -0.0265 | ||||
| RIVN / Rivian Automotive, Inc. | 0.00 | -100.00 | 0.00 | -100.00 | -0.1428 | ||||
| SBNY / Signature Bank | 0.00 | -100.00 | 0.00 | -100.00 | -0.1771 | ||||
| EG / Everest Group, Ltd. | 0.00 | -100.00 | 0.00 | -100.00 | -0.0300 |