Statistik Asas
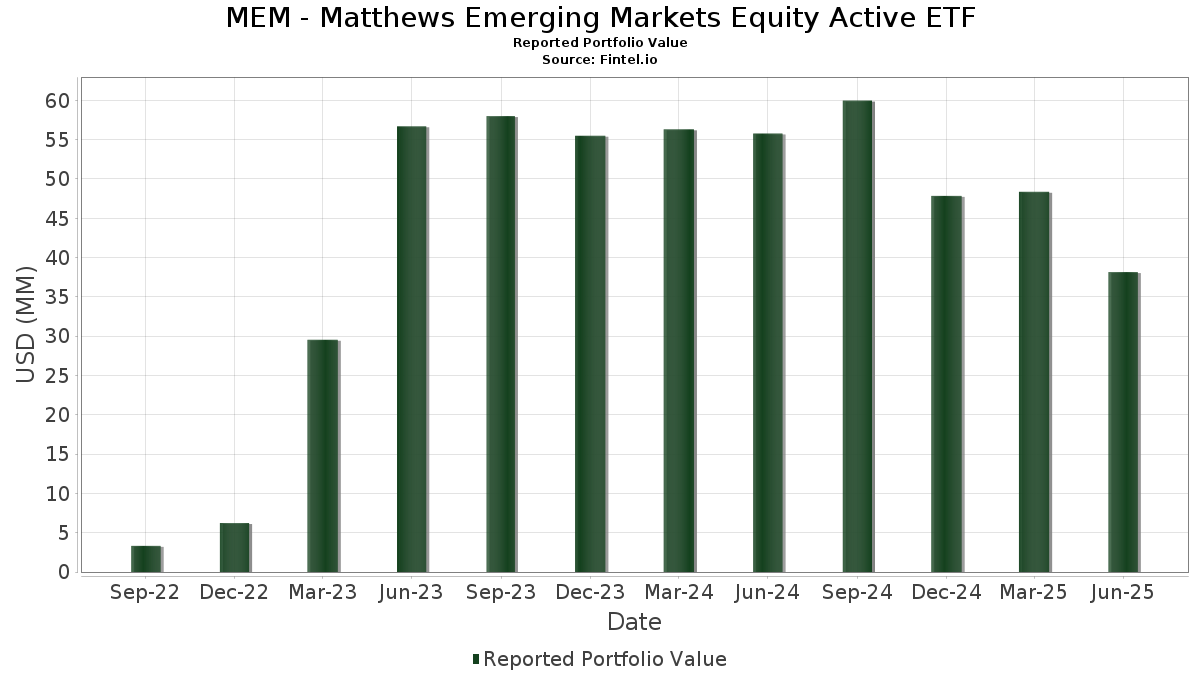
| Nilai Portfolio | $ 38,151,699 |
| Kedudukan Semasa | 70 |
Pegangan Terkini, Prestasi, AUM (dari 13F, 13D)
MEM - Matthews Emerging Markets Equity Active ETF telah mendedahkan 70 jumlah pegangan dalam pemfailan SEC terkini mereka. Nilai portfolio terkini dikira sebagai $ 38,151,699 USD. Aset Sebenar Di Bawah Pengurusan (AUM) ialah nilai ini ditambah dengan tunai (yang tidak didedahkan). Pegangan teratas MEM - Matthews Emerging Markets Equity Active ETF ialah Taiwan Semiconductor Manufacturing Company Limited (TW:2330) , Tencent Holdings Limited (DE:NNND) , HDFC Bank Limited - Depositary Receipt (Common Stock) (US:HDB) , NetEase, Inc. - Depositary Receipt (Common Stock) (US:NTES) , and Itaú Unibanco Holding S.A. - Depositary Receipt (Common Stock) (US:ITUB) . Kedudukan baharu MEM - Matthews Emerging Markets Equity Active ETF termasuk NetEase, Inc. - Depositary Receipt (Common Stock) (US:NTES) , Shriram Finance Limited (IN:511218) , B3 S.A. - Brasil, Bolsa, Balcão (BR:B3SA3) , Eicher Motors Ltd (IN:INE066A01021) , and Fomento Económico Mexicano, S.A.B. de C.V. - Depositary Receipt (Common Stock) (US:FMX) .
Kenaikan Teratas Suku Tahun Ini
Kami menggunakan perubahan dalam peruntukan portfolio kerana ini adalah metrik yang paling bermakna. Perubahan boleh disebabkan oleh perdagangan atau perubahan dalam harga saham.
| Sekuriti | Saham (MM) |
Nilai (MM$) |
Portfolio % | ΔPortfolio % |
|---|---|---|---|---|
| 2.80 | 2.80 | 7.0718 | 7.0718 | |
| 0.11 | 4.03 | 10.1895 | 3.0122 | |
| 0.01 | 0.99 | 2.4990 | 2.4990 | |
| 0.09 | 0.75 | 1.9018 | 1.9018 | |
| 0.01 | 0.54 | 1.3747 | 1.3747 | |
| 0.01 | 0.84 | 2.1269 | 1.1156 | |
| 0.16 | 0.44 | 1.1056 | 1.1056 | |
| 0.01 | 0.41 | 1.0424 | 1.0424 | |
| 0.02 | 0.41 | 1.0308 | 1.0308 | |
| 0.06 | 0.39 | 0.9800 | 0.9248 |
Penurunan Teratas Suku Tahun Ini
Kami menggunakan perubahan dalam peruntukan portfolio kerana ini adalah metrik yang paling bermakna. Perubahan boleh disebabkan oleh perdagangan atau perubahan dalam harga saham.
| Sekuriti | Saham (MM) |
Nilai (MM$) |
Portfolio % | ΔPortfolio % |
|---|---|---|---|---|
| 0.02 | 0.71 | 1.8010 | -1.3758 | |
| 0.00 | 0.00 | -1.3150 | ||
| 0.06 | 0.85 | 2.1514 | -1.1833 | |
| 0.00 | 0.00 | -1.0851 | ||
| 0.00 | 0.00 | -0.9730 | ||
| 0.00 | 0.00 | -0.8632 | ||
| 0.01 | 0.39 | 0.9904 | -0.5060 | |
| 0.01 | 0.18 | 0.4516 | -0.4509 | |
| 0.03 | 0.51 | 1.3028 | -0.4149 | |
| 0.01 | 0.40 | 1.0192 | -0.4042 |
13F dan Pemfailan Dana
Borang ini telah difailkan pada 2025-08-25 untuk tempoh pelaporan 2025-06-30. Klik ikon pautan untuk melihat sejarah transaksi penuh.
Tingkatkan untuk membuka data premium dan eksport ke Excel ![]() .
.
| Sekuriti | Jenis | Purata Harga Saham | Saham (MM) |
ΔSaham (%) |
ΔSaham (%) |
Nilai ($MM) |
Portfolio (%) |
ΔPortfolio (%) |
|
|---|---|---|---|---|---|---|---|---|---|
| 2330 / Taiwan Semiconductor Manufacturing Company Limited | 0.11 | -12.60 | 4.03 | 15.72 | 10.1895 | 3.0122 | |||
| JP MORGAN US GOVT CAPITAL / EC (000000000) | 2.80 | 2.80 | 7.0718 | 7.0718 | |||||
| NNND / Tencent Holdings Limited | 0.03 | -17.48 | 2.18 | -17.22 | 5.5114 | 0.0846 | |||
| HDB / HDFC Bank Limited - Depositary Receipt (Common Stock) | 0.02 | -34.36 | 1.18 | -24.28 | 2.9926 | -0.2274 | |||
| NTES / NetEase, Inc. - Depositary Receipt (Common Stock) | 0.01 | 0.99 | 2.4990 | 2.4990 | |||||
| ITUB / Itaú Unibanco Holding S.A. - Depositary Receipt (Common Stock) | 0.13 | -26.50 | 0.91 | -9.24 | 2.3108 | 0.2350 | |||
| 005930 / Samsung Electronics Co., Ltd. | 0.02 | -26.49 | 0.90 | -17.01 | 2.2721 | 0.0403 | |||
| 2RR / Alibaba Group Holding Limited | 0.06 | -38.15 | 0.85 | -47.43 | 2.1514 | -1.1833 | |||
| 086790 / Hana Financial Group Inc. | 0.01 | 8.51 | 0.84 | 71.43 | 2.1269 | 1.1156 | |||
| 511218 / Shriram Finance Limited | 0.09 | 0.75 | 1.9018 | 1.9018 | |||||
| IBN / ICICI Bank Limited - Depositary Receipt (Common Stock) | 0.02 | -56.70 | 0.71 | -53.83 | 1.8010 | -1.3758 | |||
| BHARTIARTL / Bharti Airtel Limited | 0.03 | -26.53 | 0.68 | -15.18 | 1.7121 | 0.0683 | |||
| 000660 / SK hynix Inc. | 0.00 | 9.91 | 0.64 | 83.53 | 1.6081 | 0.8943 | |||
| 2383 / Elite Material Co., Ltd. | 0.02 | -39.39 | 0.60 | 11.46 | 1.5277 | 0.4107 | |||
| DIDIY / DiDi Global Inc. - Depositary Receipt (Common Stock) | 0.12 | -26.51 | 0.60 | -25.62 | 1.5076 | -0.1440 | |||
| 105560 / KB Financial Group Inc. | 0.01 | 0.54 | 1.3747 | 1.3747 | |||||
| 939 / China Construction Bank Corporation | 0.53 | -27.24 | 0.53 | -16.98 | 1.3502 | 0.0246 | |||
| 9618 / JD.com, Inc. | 0.03 | 33.13 | 0.53 | 4.95 | 1.3416 | 0.2997 | |||
| 500271 / Max Financial Services Limited | 0.03 | -26.49 | 0.53 | 5.18 | 1.3376 | 0.3006 | |||
| 857 / PetroChina Company Limited | 0.60 | -26.83 | 0.52 | -22.21 | 1.3052 | -0.0618 | |||
| BY6 / BYD Company Limited | 0.03 | 100.00 | 0.51 | -38.30 | 1.3028 | -0.4149 | |||
| 600036 / China Merchants Bank Co., Ltd. | 0.08 | -25.93 | 0.48 | -20.30 | 1.2236 | -0.0270 | |||
| 035420 / NAVER Corporation | 0.00 | -26.77 | 0.48 | 9.86 | 1.2139 | 0.3128 | |||
| MELI / MercadoLibre, Inc. | 0.00 | 45.97 | 0.47 | 96.27 | 1.1968 | 0.6980 | |||
| 000810 / Samsung Fire & Marine Insurance Co., Ltd. | 0.00 | -26.91 | 0.46 | -3.15 | 1.1666 | 0.1844 | |||
| 1336 / New China Life Insurance Company Ltd. | 0.08 | 2.69 | 0.46 | 46.47 | 1.1586 | 0.5151 | |||
| 532343 / TVS Motor Company Limited | 0.01 | -26.53 | 0.44 | -11.80 | 1.1168 | 0.0858 | |||
| B3SA3 / B3 S.A. - Brasil, Bolsa, Balcão | 0.16 | 0.44 | 1.1056 | 1.1056 | |||||
| M&M / Mahindra & Mahindra Limited | 0.01 | -49.81 | 0.43 | -40.25 | 1.0785 | -0.3931 | |||
| 4FN / Grupo Financiero Banorte, S.A.B. de C.V. | 0.05 | 11.04 | 0.42 | 45.21 | 1.0737 | 0.4715 | |||
| AXISBANK / Axis Bank Limited | 0.03 | -26.51 | 0.42 | -20.30 | 1.0638 | -0.0240 | |||
| INE066A01021 / Eicher Motors Ltd | 0.01 | 0.41 | 1.0424 | 1.0424 | |||||
| RELIANCE / Reliance Industries Limited | 0.02 | 0.41 | 1.0308 | 1.0308 | |||||
| JD / JD.com, Inc. - Depositary Receipt (Common Stock) | 0.01 | -26.47 | 0.40 | -41.74 | 1.0192 | -0.4042 | |||
| BAF / Bajaj Finance Ltd | 0.04 | 633.09 | 0.40 | -23.57 | 1.0183 | -0.0668 | |||
| BPI / Bank of the Philippine Islands | 0.17 | -26.50 | 0.39 | -26.50 | 0.9906 | -0.1073 | |||
| YUMC / Yum China Holdings, Inc. | 0.01 | -56.63 | 0.39 | -56.94 | 0.9904 | -0.5060 | |||
| PZX / Ping An Insurance (Group) Company of China, Ltd. | 0.06 | 1,255.56 | 0.39 | 1,388.46 | 0.9800 | 0.9248 | |||
| HY7 / Shoprite Holdings Ltd | 0.02 | -26.48 | 0.39 | -22.80 | 0.9779 | -0.0536 | |||
| SKMTF / SK Telecom Co., Ltd. | 0.01 | -32.50 | 0.38 | -24.41 | 0.9725 | -0.0812 | |||
| 2308 / Delta Electronics, Inc. | 0.03 | -44.90 | 0.38 | -28.25 | 0.9657 | -0.1298 | |||
| BEKE / KE Holdings Inc. - Depositary Receipt (Common Stock) | 0.02 | -26.51 | 0.38 | -35.11 | 0.9553 | -0.2446 | |||
| 2669 / China Overseas Property Holdings Limited | 0.54 | -28.95 | 0.38 | -27.97 | 0.9537 | -0.1239 | |||
| YMM / Full Truck Alliance Co. Ltd. - Depositary Receipt (Common Stock) | 0.03 | -26.51 | 0.37 | -32.04 | 0.9349 | -0.1862 | |||
| LUPIN / Lupin Limited | 0.02 | -26.52 | 0.37 | -29.98 | 0.9337 | -0.1538 | |||
| FMX / Fomento Económico Mexicano, S.A.B. de C.V. - Depositary Receipt (Common Stock) | 0.00 | 0.36 | 0.9100 | 0.9100 | |||||
| 2891 / CTBC Financial Holding Co., Ltd. | 0.24 | -26.91 | 0.36 | -7.99 | 0.9045 | 0.1033 | |||
| M4B / China Merchants Bank Co., Ltd. | 0.05 | -30.77 | 0.35 | -18.05 | 0.8750 | 0.0052 | |||
| Horizon Robotics / EC (KYG4602S1057) | 0.41 | 0.34 | 0.8621 | 0.8621 | |||||
| MARICO / Marico Limited | 0.04 | 0.34 | 0.8595 | 0.8595 | |||||
| TCOM / Trip.com Group Limited - Depositary Receipt (Common Stock) | 0.01 | -26.42 | 0.33 | -32.11 | 0.8454 | -0.1699 | |||
| 051910 / LG Chem, Ltd. | 0.00 | -26.23 | 0.33 | -30.59 | 0.8341 | -0.1443 | |||
| CPI / Capitec Bank Holdings Limited | 0.00 | -26.75 | 0.31 | -13.33 | 0.7916 | 0.0479 | |||
| ZOMATO / Eternal Limited | 0.10 | 0.31 | 0.7799 | 0.7799 | |||||
| SIT4 / Singapore Telecommunications Limited | 0.10 | -51.98 | 0.29 | -43.57 | 0.7451 | -0.3310 | |||
| 214150 / CLASSYS Inc. | 0.01 | -26.45 | 0.27 | -10.82 | 0.6903 | 0.0596 | |||
| 2379 / Realtek Semiconductor Corp. | 0.01 | 0.00 | 0.27 | 23.18 | 0.6874 | 0.2327 | |||
| CPALL.F / FOREIGN SH. THB1.0 A | 0.19 | -26.82 | 0.26 | -32.11 | 0.6578 | -0.1320 | |||
| BYRA / PT Bank Rakyat Indonesia (Persero) Tbk | 1.12 | -26.53 | 0.26 | -30.83 | 0.6535 | -0.1161 | |||
| 3690 / Meituan | 0.02 | -30.28 | 0.24 | -44.50 | 0.6138 | -0.2864 | |||
| PBCRY / PT Bank Central Asia Tbk - Depositary Receipt (Common Stock) | 0.45 | -26.45 | 0.24 | -23.47 | 0.6036 | -0.0390 | |||
| MBB / Military Commercial Joint Stock Bank | 0.24 | -26.61 | 0.23 | -23.36 | 0.5914 | -0.0358 | |||
| 27 / Galaxy Entertainment Group Limited | 0.05 | -58.12 | 0.22 | -52.52 | 0.5503 | -0.3923 | |||
| 3661 / Alchip Technologies, Limited | 0.00 | 0.00 | 0.21 | 27.88 | 0.5361 | 0.1957 | |||
| RAIL3 / Rumo S.A. | 0.06 | -25.45 | 0.20 | -10.91 | 0.4982 | 0.0439 | |||
| KOTAKBANK / Kotak Mahindra Bank Limited | 0.01 | -69.60 | 0.18 | -64.61 | 0.4516 | -0.4509 | |||
| TATAGLOBAL / Tata Consumer Products Ltd | 0.01 | 0.18 | 0.4498 | 0.4498 | |||||
| INE935N01020 / Dixon Technologies India Ltd | 0.00 | 0.16 | 0.3934 | 0.3934 | |||||
| 2317 / Hon Hai Precision Industry Co., Ltd. | 0.02 | -50.00 | 0.12 | -37.31 | 0.3067 | -0.0922 | |||
| 000333 / Midea Group Co., Ltd. | 0.00 | 0.00 | 0.03 | -7.14 | 0.0663 | 0.0084 | |||
| 2882 / Cathay Financial Holding Co., Ltd. | 0.00 | -100.00 | 0.00 | -100.00 | -0.9730 | ||||
| BAF / Bajaj Finance Ltd | 0.00 | -100.00 | 0.00 | -100.00 | -1.0851 | ||||
| TCS / Tata Consultancy Services Limited | 0.00 | -100.00 | 0.00 | -100.00 | -1.3150 | ||||
| 2454 / MediaTek Inc. | 0.00 | -100.00 | 0.00 | -100.00 | -0.8632 |