Statistik Asas
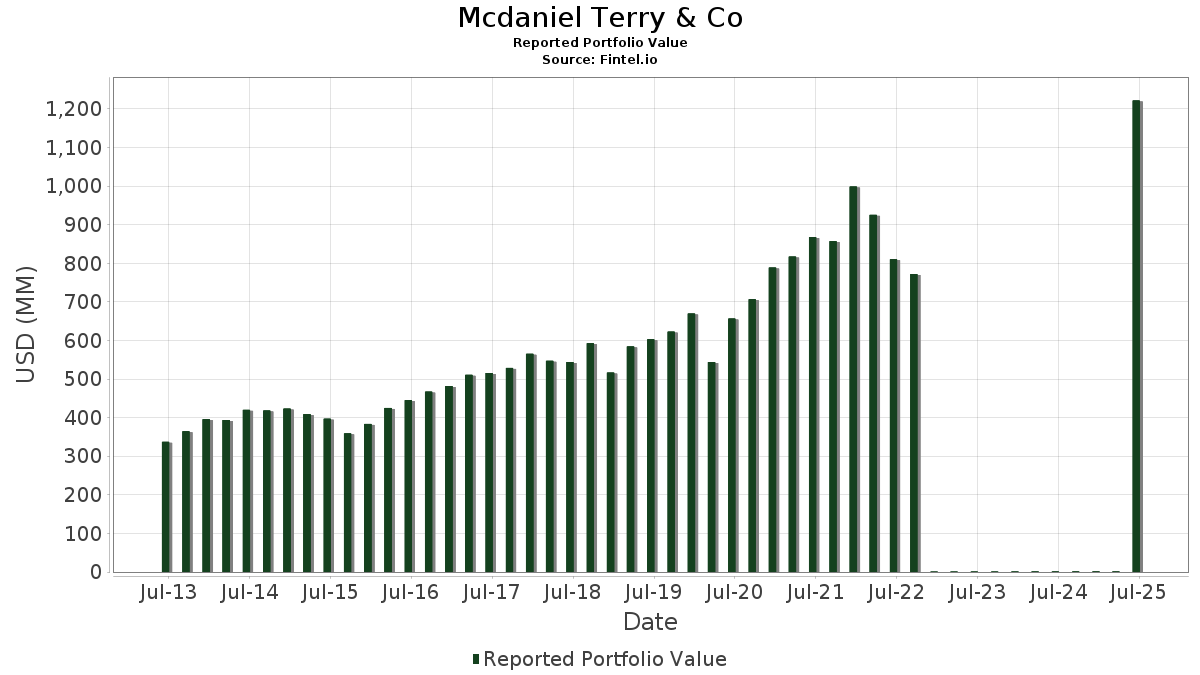
| Nilai Portfolio | $ 1,221,467,697 |
| Kedudukan Semasa | 91 |
Pegangan Terkini, Prestasi, AUM (dari 13F, 13D)
Mcdaniel Terry & Co telah mendedahkan 91 jumlah pegangan dalam pemfailan SEC terkini mereka. Nilai portfolio terkini dikira sebagai $ 1,221,467,697 USD. Aset Sebenar Di Bawah Pengurusan (AUM) ialah nilai ini ditambah dengan tunai (yang tidak didedahkan). Pegangan teratas Mcdaniel Terry & Co ialah Microsoft Corporation (US:MSFT) , Apple Inc. (US:AAPL) , Taiwan Semiconductor Manufacturing Company Limited - Depositary Receipt (Common Stock) (US:TSM) , Automatic Data Processing, Inc. (US:ADP) , and Nordson Corporation (US:NDSN) . Kedudukan baharu Mcdaniel Terry & Co termasuk Oracle Corporation (US:ORCL) , Micron Technology, Inc. (US:MU) , .
Kenaikan Teratas Suku Tahun Ini
Kami menggunakan perubahan dalam peruntukan portfolio kerana ini adalah metrik yang paling bermakna. Perubahan boleh disebabkan oleh perdagangan atau perubahan dalam harga saham.
| Sekuriti | Saham (MM) |
Nilai (MM$) |
Portfolio % | ΔPortfolio % |
|---|---|---|---|---|
| 0.31 | 155.31 | 12.7150 | 2.3478 | |
| 0.29 | 65.05 | 5.3260 | 1.1244 | |
| 0.41 | 40.31 | 3.3001 | 0.9504 | |
| 0.05 | 17.35 | 1.4200 | 0.4893 | |
| 0.29 | 38.16 | 3.1239 | 0.3750 | |
| 0.04 | 30.93 | 2.5324 | 0.3463 | |
| 0.09 | 18.51 | 1.5156 | 0.1299 | |
| 0.04 | 12.78 | 1.0461 | 0.1205 | |
| 0.12 | 26.49 | 2.1688 | 0.1175 | |
| 0.07 | 38.02 | 3.1125 | 0.0835 |
Penurunan Teratas Suku Tahun Ini
Kami menggunakan perubahan dalam peruntukan portfolio kerana ini adalah metrik yang paling bermakna. Perubahan boleh disebabkan oleh perdagangan atau perubahan dalam harga saham.
| Sekuriti | Saham (MM) |
Nilai (MM$) |
Portfolio % | ΔPortfolio % |
|---|---|---|---|---|
| 0.36 | 73.68 | 6.0317 | -0.9576 | |
| 0.09 | 15.02 | 1.2297 | -0.5322 | |
| 0.22 | 34.72 | 2.8428 | -0.4162 | |
| 0.01 | 1.77 | 0.1445 | -0.4110 | |
| 0.19 | 29.28 | 2.3969 | -0.3958 | |
| 0.02 | 2.92 | 0.2391 | -0.3549 | |
| 0.40 | 38.18 | 3.1254 | -0.2968 | |
| 0.19 | 59.83 | 4.8980 | -0.2883 | |
| 0.03 | 12.81 | 1.0489 | -0.2865 | |
| 0.19 | 46.06 | 3.7705 | -0.2812 |
13F dan Pemfailan Dana
Borang ini telah difailkan pada 2025-07-31 untuk tempoh pelaporan 2025-06-30. Klik ikon pautan untuk melihat sejarah transaksi penuh.
Tingkatkan untuk membuka data premium dan eksport ke Excel ![]() .
.
| Sekuriti | Jenis | Purata Harga Saham | Saham (MM) |
ΔSaham (%) |
ΔSaham (%) |
Nilai ($MM) |
Portfolio (%) |
ΔPortfolio (%) |
|
|---|---|---|---|---|---|---|---|---|---|
| MSFT / Microsoft Corporation | 0.31 | -1.08 | 155.31 | 131,518.64 | 12.7150 | 2.3478 | |||
| AAPL / Apple Inc. | 0.36 | -0.15 | 73.68 | 93,159.49 | 6.0317 | -0.9576 | |||
| TSM / Taiwan Semiconductor Manufacturing Company Limited - Depositary Receipt (Common Stock) | 0.29 | -0.71 | 65.05 | 135,429.17 | 5.3260 | 1.1244 | |||
| ADP / Automatic Data Processing, Inc. | 0.19 | -0.01 | 59.83 | 101,301.69 | 4.8980 | -0.2883 | |||
| NDSN / Nordson Corporation | 0.23 | -0.07 | 50.37 | 107,068.09 | 4.1237 | -0.0261 | |||
| ITW / Illinois Tool Works Inc. | 0.19 | -0.24 | 46.06 | 100,019.57 | 3.7705 | -0.2812 | |||
| ECL / Ecolab Inc. | 0.17 | -0.40 | 45.22 | 107,576.19 | 3.7025 | -0.0354 | |||
| APH / Amphenol Corporation | 0.41 | -0.31 | 40.31 | 154,934.62 | 3.3001 | 0.9504 | |||
| DOV / Dover Corporation | 0.22 | -0.23 | 40.28 | 105,902.63 | 3.2978 | -0.0892 | |||
| CTAS / Cintas Corporation | 0.18 | -0.20 | 40.27 | 108,745.95 | 3.2972 | 0.0410 | |||
| DCI / Donaldson Company, Inc. | 0.56 | -0.64 | 38.59 | 104,194.59 | 3.1593 | -0.1266 | |||
| PCAR / PACCAR Inc | 0.40 | -0.03 | 38.18 | 97,784.62 | 3.1254 | -0.2968 | |||
| EMR / Emerson Electric Co. | 0.29 | -0.13 | 38.16 | 122,983.87 | 3.1239 | 0.3750 | |||
| ISRG / Intuitive Surgical, Inc. | 0.07 | 0.09 | 38.02 | 111,717.65 | 3.1125 | 0.0835 | |||
| PG / The Procter & Gamble Company | 0.22 | -0.28 | 34.72 | 93,745.95 | 2.8428 | -0.4162 | |||
| KO / The Coca-Cola Company | 0.45 | -0.56 | 31.50 | 98,350.00 | 2.5792 | -0.2266 | |||
| HON / Honeywell International Inc. | 0.13 | -2.05 | 31.42 | 108,255.17 | 2.5726 | 0.0204 | |||
| INTU / Intuit Inc. | 0.04 | -3.49 | 30.93 | 128,783.33 | 2.5324 | 0.3463 | |||
| JNJ / Johnson & Johnson | 0.19 | -0.42 | 29.28 | 94,341.94 | 2.3969 | -0.3958 | |||
| AMZN / Amazon.com, Inc. | 0.12 | -2.01 | 26.49 | 115,073.91 | 2.1688 | 0.1175 | |||
| SYK / Stryker Corporation | 0.06 | -2.45 | 25.68 | 106,895.83 | 2.1023 | -0.0648 | |||
| ALC / Alcon Inc. | 0.25 | 0.02 | 21.65 | 94,043.48 | 1.7727 | -0.2640 | |||
| MKC / McCormick & Company, Incorporated | 0.25 | -0.51 | 18.95 | 94,655.00 | 1.5515 | -0.2577 | |||
| TXN / Texas Instruments Incorporated | 0.09 | 1.17 | 18.51 | 123,313.33 | 1.5156 | 0.1299 | |||
| APD / Air Products and Chemicals, Inc. | 0.06 | -0.31 | 18.13 | 95,326.32 | 1.4844 | -0.1794 | |||
| ETN / Eaton Corporation plc | 0.05 | 24.15 | 17.35 | 173,350.00 | 1.4200 | 0.4893 | |||
| ZBRA / Zebra Technologies Corporation | 0.05 | 2.55 | 15.93 | 113,700.00 | 1.3044 | 0.0588 | |||
| ADBE / Adobe Inc. | 0.04 | 2.85 | 15.28 | 109,071.43 | 1.2513 | -0.0377 | |||
| BDX / Becton, Dickinson and Company | 0.09 | -0.81 | 15.02 | 74,995.00 | 1.2297 | -0.5322 | |||
| TMO / Thermo Fisher Scientific Inc. | 0.03 | 3.01 | 12.81 | 85,306.67 | 1.0489 | -0.2865 | |||
| ACN / Accenture plc | 0.04 | 26.09 | 12.78 | 127,670.00 | 1.0461 | 0.1205 | |||
| BRK.B / Berkshire Hathaway Inc. | 0.03 | -0.69 | 12.21 | 93,784.62 | 0.9992 | -0.1796 | |||
| XOM / Exxon Mobil Corporation | 0.06 | 0.00 | 6.37 | 90,871.43 | 0.5214 | -0.0933 | |||
| NVDA / NVIDIA Corporation | 0.02 | -7.49 | 3.92 | 195,800.00 | 0.3208 | 0.0665 | |||
| SPY / SPDR S&P 500 ETF | 0.01 | 0.00 | 3.21 | 160,600.00 | 0.2632 | 0.0085 | |||
| PEP / PepsiCo, Inc. | 0.02 | -51.15 | 2.92 | 48,566.67 | 0.2391 | -0.3549 | |||
| ABBV / AbbVie Inc. | 0.01 | -0.62 | 2.65 | 88,233.33 | 0.2170 | -0.0464 | |||
| ABT / Abbott Laboratories | 0.02 | 0.29 | 2.48 | 123,700.00 | 0.2027 | -0.0080 | |||
| GOOGL / Alphabet Inc. | 0.01 | -8.18 | 2.43 | 121,300.00 | 0.1988 | -0.0043 | |||
| MA / Mastercard Incorporated | 0.00 | -0.12 | 2.27 | 113,250.00 | 0.1856 | -0.0081 | |||
| UPS / United Parcel Service, Inc. | 0.02 | -3.60 | 1.91 | 95,200.00 | 0.1561 | -0.0325 | |||
| GWW / W.W. Grainger, Inc. | 0.00 | 0.00 | 1.90 | 190,200.00 | 0.1558 | -0.0023 | |||
| SJT / San Juan Basin Royalty Trust | 0.32 | 0.00 | 1.90 | 190,100.00 | 0.1557 | 0.0018 | |||
| CVX / Chevron Corporation | 0.01 | 0.03 | 1.84 | 91,800.00 | 0.1505 | -0.0373 | |||
| FDX / FedEx Corporation | 0.01 | -70.18 | 1.77 | 29,316.67 | 0.1445 | -0.4110 | |||
| JPM / JPMorgan Chase & Co. | 0.01 | -6.83 | 1.67 | 166,400.00 | 0.1364 | 0.0040 | |||
| BSM / Black Stone Minerals, L.P. - Limited Partnership | 0.12 | 0.00 | 1.57 | 156,800.00 | 0.1285 | -0.0318 | |||
| DMLP / Dorchester Minerals, L.P. - Limited Partnership | 0.05 | 0.00 | 1.46 | 145,900.00 | 0.1196 | -0.0184 | |||
| WM / Waste Management, Inc. | 0.01 | 0.00 | 1.44 | 143,400.00 | 0.1176 | -0.0096 | |||
| NFLX / Netflix, Inc. | 0.00 | -0.99 | 1.34 | 0.1096 | 0.0272 | ||||
| LRCX / Lam Research Corporation | 0.01 | -4.86 | 1.31 | 131,300.00 | 0.1076 | 0.0173 | |||
| STEL / Stellar Bancorp, Inc. | 0.05 | 0.00 | 1.30 | 129,700.00 | 0.1063 | -0.0060 | |||
| AVGO / Broadcom Inc. | 0.00 | -1.56 | 1.15 | 0.0938 | 0.0319 | ||||
| META / Meta Platforms, Inc. | 0.00 | -27.54 | 0.95 | 95,200.00 | 0.0781 | -0.0119 | |||
| SBR / Sabine Royalty Trust | 0.01 | 0.00 | 0.93 | 0.0764 | -0.0065 | ||||
| IBM / International Business Machines Corporation | 0.00 | -0.50 | 0.88 | 0.0720 | 0.0068 | ||||
| MDT / Medtronic plc | 0.01 | -1.40 | 0.74 | 0.0603 | -0.0071 | ||||
| DUK / Duke Energy Corporation | 0.01 | -0.39 | 0.72 | 0.0589 | -0.0064 | ||||
| SYY / Sysco Corporation | 0.01 | -0.08 | 0.70 | 0.0573 | -0.0034 | ||||
| MCD / McDonald's Corporation | 0.00 | -1.93 | 0.62 | 0.0510 | -0.0084 | ||||
| LLY / Eli Lilly and Company | 0.00 | -4.38 | 0.58 | 0.0474 | -0.0088 | ||||
| GOOG / Alphabet Inc. | 0.00 | 0.00 | 0.56 | 0.0458 | 0.0027 | ||||
| NOW / ServiceNow, Inc. | 0.00 | -0.38 | 0.53 | 0.0438 | 0.0074 | ||||
| COP / ConocoPhillips | 0.01 | 0.00 | 0.52 | 0.0429 | -0.0107 | ||||
| WMT / Walmart Inc. | 0.01 | -4.19 | 0.51 | 0.0421 | -0.0000 | ||||
| LOW / Lowe's Companies, Inc. | 0.00 | -0.50 | 0.48 | 0.0397 | -0.0051 | ||||
| VEA / Vanguard Tax-Managed Funds - Vanguard FTSE Developed Markets ETF | 0.01 | 0.00 | 0.48 | 0.0390 | 0.0019 | ||||
| XLU / The Select Sector SPDR Trust - The Utilities Select Sector SPDR Fund | 0.01 | 0.00 | 0.47 | 0.0384 | -0.0012 | ||||
| NVS / Novartis AG - Depositary Receipt (Common Stock) | 0.00 | -10.14 | 0.42 | 0.0347 | -0.0033 | ||||
| NEE / NextEra Energy, Inc. | 0.01 | 0.03 | 0.42 | 0.0346 | -0.0032 | ||||
| MMM / 3M Company | 0.00 | -0.26 | 0.40 | 0.0330 | -0.0011 | ||||
| IJH / iShares Trust - iShares Core S&P Mid-Cap ETF | 0.01 | 0.00 | 0.40 | 0.0327 | -0.0002 | ||||
| BMY / Bristol-Myers Squibb Company | 0.01 | -1.95 | 0.40 | 0.0324 | -0.0141 | ||||
| BX / Blackstone Inc. | 0.00 | 0.00 | 0.37 | 0.0306 | 0.0001 | ||||
| HD / The Home Depot, Inc. | 0.00 | -4.95 | 0.37 | 0.0299 | -0.0037 | ||||
| CRM / Salesforce, Inc. | 0.00 | -48.02 | 0.34 | 0.0281 | -0.0287 | ||||
| KRE / SPDR Series Trust - SPDR S&P Regional Banking ETF | 0.01 | 0.00 | 0.33 | 0.0274 | -0.0007 | ||||
| IYT / iShares Trust - iShares U.S. Transportation ETF | 0.00 | 0.00 | 0.33 | 0.0272 | 0.0000 | ||||
| PSX / Phillips 66 | 0.00 | 0.00 | 0.33 | 0.0267 | -0.0028 | ||||
| VNQ / Vanguard Specialized Funds - Vanguard Real Estate ETF | 0.00 | -33.06 | 0.31 | 0.0253 | -0.0158 | ||||
| GLD / SPDR Gold Trust | 0.00 | 0.00 | 0.29 | 0.0234 | -0.0003 | ||||
| AMGN / Amgen Inc. | 0.00 | -0.78 | 0.29 | 0.0234 | -0.0048 | ||||
| BLK / BlackRock, Inc. | 0.00 | 0.00 | 0.28 | 0.0228 | 0.0008 | ||||
| SPGI / S&P Global Inc. | 0.00 | 0.00 | 0.27 | 0.0222 | -0.0007 | ||||
| FFIN / First Financial Bankshares, Inc. | 0.01 | 0.00 | 0.26 | 0.0216 | -0.0015 | ||||
| ORCL / Oracle Corporation | 0.00 | 0.25 | 0.0207 | 0.0207 | |||||
| MU / Micron Technology, Inc. | 0.00 | 0.24 | 0.0194 | 0.0194 | |||||
| EPD / Enterprise Products Partners L.P. - Limited Partnership | 0.01 | 0.00 | 0.22 | 0.0178 | -0.0032 | ||||
| INTC / Intel Corporation | 0.01 | 0.00 | 0.21 | 0.0169 | -0.0014 | ||||
| VERSX / Vanguard Emerging Markets Stock Index Fund | 0.00 | 0.20 | 0.0165 | 0.0165 | |||||
| NOK / Nokia Oyj - Depositary Receipt (Common Stock) | 0.02 | 0.00 | 0.08 | 0.0065 | -0.0006 | ||||
| DHR / Danaher Corporation | 0.00 | -100.00 | 0.00 | 0.0000 | |||||
| MLM / Martin Marietta Materials, Inc. | 0.00 | -100.00 | 0.00 | 0.0000 | |||||
| PANW / Palo Alto Networks, Inc. | 0.00 | -100.00 | 0.00 | 0.0000 | -0.0223 | ||||
| Parent Cap Corp F / (69945R103) | 0.00 | -100.00 | 0.00 | 0.0000 | |||||
| VEEV / Veeva Systems Inc. | 0.00 | -100.00 | 0.00 | 0.0000 | |||||
| TLNE / Talen Energy Corporation | 0.00 | -100.00 | 0.00 | 0.0000 | |||||
| TMUS / T-Mobile US, Inc. | 0.00 | -100.00 | 0.00 | 0.0000 | |||||
| SAP / SAP SE - Depositary Receipt (Common Stock) | 0.00 | -100.00 | 0.00 | 0.0000 | |||||
| UNH / UnitedHealth Group Incorporated | 0.00 | -100.00 | 0.00 | 0.0000 | |||||
| MDLZ / Mondelez International, Inc. | 0.00 | -100.00 | 0.00 | 0.0000 | |||||
| CSGP / CoStar Group, Inc. | 0.00 | -100.00 | 0.00 | 0.0000 |