Statistik Asas
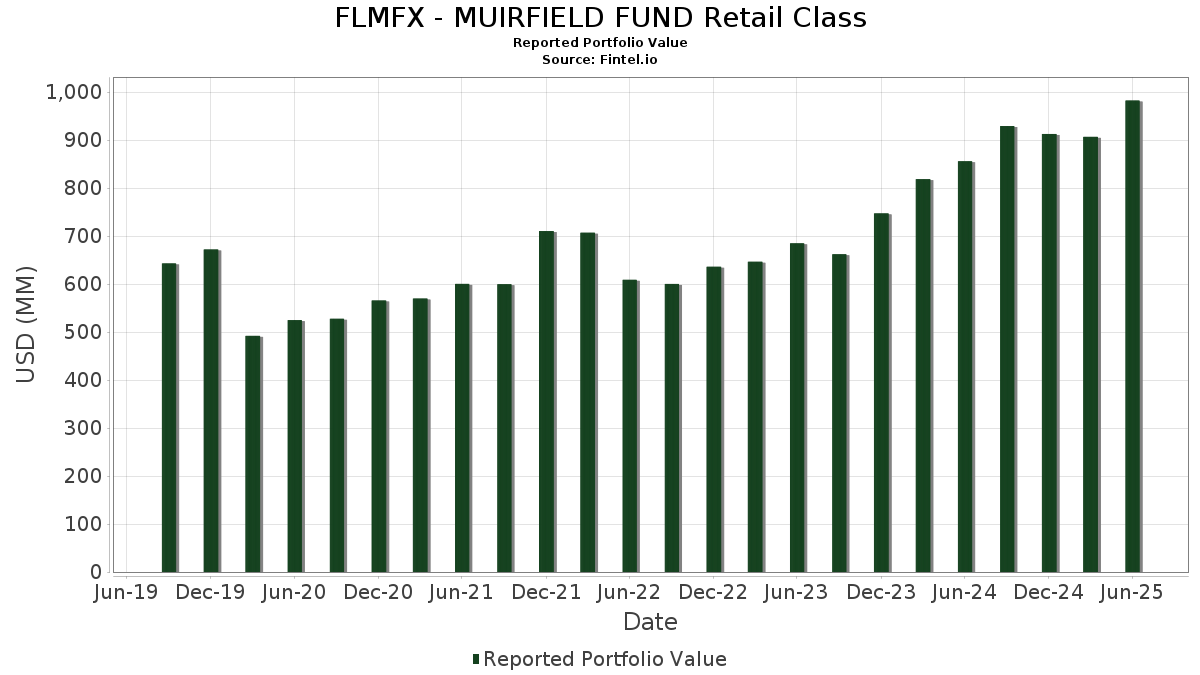
| Nilai Portfolio | $ 982,343,955 |
| Kedudukan Semasa | 180 |
Pegangan Terkini, Prestasi, AUM (dari 13F, 13D)
FLMFX - MUIRFIELD FUND Retail Class telah mendedahkan 180 jumlah pegangan dalam pemfailan SEC terkini mereka. Nilai portfolio terkini dikira sebagai $ 982,343,955 USD. Aset Sebenar Di Bawah Pengurusan (AUM) ialah nilai ini ditambah dengan tunai (yang tidak didedahkan). Pegangan teratas FLMFX - MUIRFIELD FUND Retail Class ialah Microsoft Corporation (US:MSFT) , Berkshire Hathaway Inc. (US:BRK.B) , NVIDIA Corporation (US:NVDA) , Amazon.com, Inc. (US:AMZN) , and Meta Platforms, Inc. (US:META) . Kedudukan baharu FLMFX - MUIRFIELD FUND Retail Class termasuk Morningstar, Inc. (US:MORN) , Crown Holdings, Inc. (US:CCK) , VeriSign, Inc. (US:VRSN) , Kodiak Gas Services, Inc. (US:KGS) , and Jack Henry & Associates, Inc. (US:JKHY) .
Kenaikan Teratas Suku Tahun Ini
Kami menggunakan perubahan dalam peruntukan portfolio kerana ini adalah metrik yang paling bermakna. Perubahan boleh disebabkan oleh perdagangan atau perubahan dalam harga saham.
| Sekuriti | Saham (MM) |
Nilai (MM$) |
Portfolio % | ΔPortfolio % |
|---|---|---|---|---|
| 0.29 | 45.28 | 4.5244 | 1.1937 | |
| 0.04 | 7.57 | 0.7560 | 0.7560 | |
| 0.13 | 64.17 | 6.4113 | 0.7197 | |
| 0.02 | 6.51 | 0.6500 | 0.6500 | |
| 0.02 | 5.99 | 0.5985 | 0.5985 | |
| 0.02 | 5.49 | 0.5489 | 0.5489 | |
| 0.01 | 11.39 | 1.1377 | 0.5278 | |
| 0.01 | 4.57 | 0.4566 | 0.4517 | |
| 0.01 | 4.68 | 0.4679 | 0.4456 | |
| 0.01 | 3.99 | 0.3987 | 0.3965 |
Penurunan Teratas Suku Tahun Ini
Kami menggunakan perubahan dalam peruntukan portfolio kerana ini adalah metrik yang paling bermakna. Perubahan boleh disebabkan oleh perdagangan atau perubahan dalam harga saham.
| Sekuriti | Saham (MM) |
Nilai (MM$) |
Portfolio % | ΔPortfolio % |
|---|---|---|---|---|
| 0.09 | 17.66 | 1.7649 | -2.5466 | |
| 299.94 | 29.9677 | -2.1295 | ||
| 0.10 | 49.39 | 4.9350 | -1.7449 | |
| 0.01 | 4.01 | 0.4005 | -1.2472 | |
| 0.00 | 0.36 | 0.0359 | -0.6785 | |
| 0.01 | 1.09 | 0.1089 | -0.5455 | |
| 0.00 | 0.09 | 0.0085 | -0.4664 | |
| 0.02 | 1.71 | 0.1706 | -0.4526 | |
| 0.00 | 0.12 | 0.0117 | -0.4410 | |
| 0.01 | 2.90 | 0.2902 | -0.4316 |
13F dan Pemfailan Dana
Borang ini telah difailkan pada 2025-08-13 untuk tempoh pelaporan 2025-06-30. Klik ikon pautan untuk melihat sejarah transaksi penuh.
Tingkatkan untuk membuka data premium dan eksport ke Excel ![]() .
.
| Sekuriti | Jenis | Purata Harga Saham | Saham (MM) |
ΔSaham (%) |
ΔSaham (%) |
Nilai ($MM) |
Portfolio (%) |
ΔPortfolio (%) |
|
|---|---|---|---|---|---|---|---|---|---|
| Meeder Government / (58510R614) | 299.94 | 1.01 | 29.9677 | -2.1295 | |||||
| MSFT / Microsoft Corporation | 0.13 | -8.03 | 64.17 | 21.87 | 6.4113 | 0.7197 | |||
| BRK.B / Berkshire Hathaway Inc. | 0.10 | -12.37 | 49.39 | -20.07 | 4.9350 | -1.7449 | |||
| NVDA / NVIDIA Corporation | 0.29 | 0.81 | 45.28 | 46.96 | 4.5244 | 1.1937 | |||
| AMZN / Amazon.com, Inc. | 0.18 | 0.00 | 39.22 | 15.31 | 3.9182 | 0.2420 | |||
| META / Meta Platforms, Inc. | 0.03 | -21.92 | 23.43 | -0.01 | 2.3410 | -0.1919 | |||
| GOOG / Alphabet Inc. | 0.13 | -8.81 | 22.25 | 3.54 | 2.2233 | -0.0999 | |||
| COST / Costco Wholesale Corporation | 0.02 | -0.34 | 21.38 | 4.31 | 2.1360 | -0.0793 | |||
| AAPL / Apple Inc. | 0.09 | -52.05 | 17.66 | -55.71 | 1.7649 | -2.5466 | |||
| MA / Mastercard Incorporated | 0.03 | 0.66 | 17.22 | 3.20 | 1.7201 | -0.0831 | |||
| WMT / Walmart Inc. | 0.15 | 0.00 | 14.98 | 11.38 | 1.4966 | 0.0429 | |||
| SPG / Simon Property Group, Inc. | 0.09 | 0.00 | 14.41 | -3.20 | 1.4401 | -0.1695 | |||
| BK / The Bank of New York Mellon Corporation | 0.15 | 0.00 | 14.07 | 8.63 | 1.4061 | 0.0057 | |||
| NFLX / Netflix, Inc. | 0.01 | 40.55 | 11.39 | 101.84 | 1.1377 | 0.5278 | |||
| STT / State Street Corporation | 0.09 | 0.00 | 9.97 | 18.78 | 0.9962 | 0.0888 | |||
| ORCL / Oracle Corporation | 0.05 | 8.64 | 9.85 | 69.91 | 0.9838 | 0.3573 | |||
| GILD / Gilead Sciences, Inc. | 0.08 | 0.00 | 8.91 | -1.04 | 0.8899 | -0.0831 | |||
| ECL / Ecolab Inc. | 0.03 | -19.05 | 8.23 | -13.96 | 0.8225 | -0.2118 | |||
| TXN / Texas Instruments Incorporated | 0.04 | 37.63 | 7.80 | 59.03 | 0.7791 | 0.2490 | |||
| EOG / EOG Resources, Inc. | 0.06 | 0.60 | 7.71 | -6.16 | 0.7707 | -0.1179 | |||
| DIS / The Walt Disney Company | 0.06 | 29.11 | 7.68 | 62.22 | 0.7675 | 0.2556 | |||
| LLY / Eli Lilly and Company | 0.01 | -11.58 | 7.62 | -16.55 | 0.7617 | -0.2258 | |||
| AME / AMETEK, Inc. | 0.04 | 7.57 | 0.7560 | 0.7560 | |||||
| PM / Philip Morris International Inc. | 0.04 | 34.25 | 7.40 | 54.06 | 0.7395 | 0.2201 | |||
| ABBV / AbbVie Inc. | 0.04 | 64.65 | 6.89 | 45.87 | 0.6883 | 0.1778 | |||
| COF / Capital One Financial Corporation | 0.03 | 48.39 | 6.87 | 110.84 | 0.6862 | 0.3405 | |||
| GD / General Dynamics Corporation | 0.02 | 6.51 | 0.6500 | 0.6500 | |||||
| AVGO / Broadcom Inc. | 0.02 | -15.06 | 6.34 | 39.83 | 0.6339 | 0.1435 | |||
| BLD / TopBuild Corp. | 0.02 | 14.46 | 6.25 | 21.52 | 0.6241 | 0.0684 | |||
| MORN / Morningstar, Inc. | 0.02 | 5.99 | 0.5985 | 0.5985 | |||||
| YUM / Yum! Brands, Inc. | 0.04 | 33.70 | 5.97 | 25.91 | 0.5963 | 0.0839 | |||
| BPOP / Popular, Inc. | 0.05 | 97.82 | 5.67 | 136.03 | 0.5663 | 0.3067 | |||
| STE / STERIS plc | 0.02 | 5.49 | 0.5489 | 0.5489 | |||||
| AMGN / Amgen Inc. | 0.02 | 0.60 | 5.49 | -9.84 | 0.5486 | -0.1097 | |||
| NFG / National Fuel Gas Company | 0.06 | 2.37 | 5.49 | 9.50 | 0.5483 | 0.0066 | |||
| EHC / Encompass Health Corporation | 0.04 | 0.00 | 5.39 | 21.07 | 0.5386 | 0.0573 | |||
| PLTR / Palantir Technologies Inc. | 0.04 | 4.41 | 5.17 | 88.21 | 0.5168 | 0.2244 | |||
| MPWR / Monolithic Power Systems, Inc. | 0.01 | 164.56 | 5.15 | 185.70 | 0.5150 | 0.2974 | |||
| VZ / Verizon Communications Inc. | 0.12 | 0.00 | 5.12 | -4.62 | 0.5119 | -0.0687 | |||
| MU / Micron Technology, Inc. | 0.04 | 152.95 | 4.79 | 270.59 | 0.4784 | 0.3409 | |||
| NOC / Northrop Grumman Corporation | 0.01 | 2,218.56 | 4.68 | 2,173.30 | 0.4679 | 0.4456 | |||
| LMT / Lockheed Martin Corporation | 0.01 | 9,573.53 | 4.57 | 10,053.33 | 0.4566 | 0.4517 | |||
| SYF / Synchrony Financial | 0.07 | 154.96 | 4.41 | 221.53 | 0.4402 | 0.2920 | |||
| UAL / United Airlines Holdings, Inc. | 0.05 | 2.30 | 4.08 | 17.97 | 0.4081 | 0.0338 | |||
| ADBE / Adobe Inc. | 0.01 | -49.89 | 4.01 | -67.50 | 0.4005 | -1.2472 | |||
| ETN / Eaton Corporation plc | 0.01 | 14,050.63 | 3.99 | 26,500.00 | 0.3987 | 0.3965 | |||
| HUBB / Hubbell Incorporated | 0.01 | 1,111.94 | 3.86 | 1,405.86 | 0.3852 | 0.3510 | |||
| DAL / Delta Air Lines, Inc. | 0.08 | 0.00 | 3.83 | 12.79 | 0.3823 | 0.0156 | |||
| EA / Electronic Arts Inc. | 0.02 | 1,234.97 | 3.35 | 1,377.09 | 0.3351 | 0.3105 | |||
| CCK / Crown Holdings, Inc. | 0.03 | 3.16 | 0.3162 | 0.3162 | |||||
| CAH / Cardinal Health, Inc. | 0.02 | 5.96 | 3.08 | 29.20 | 0.3082 | 0.0501 | |||
| PLAB / Photronics, Inc. | 0.16 | 255.65 | 3.01 | 222.77 | 0.3002 | 0.1996 | |||
| UNP / Union Pacific Corporation | 0.01 | -48.15 | 2.90 | -51.49 | 0.2902 | -0.4316 | |||
| BCC / Boise Cascade Company | 0.03 | 47.64 | 2.82 | 30.68 | 0.2818 | 0.0485 | |||
| Mini MSCI EAFE / DE (MFSU50000) | 2.80 | 0.2795 | 0.2795 | ||||||
| NEM / Newmont Corporation | 0.05 | 21.69 | 2.79 | 46.84 | 0.2788 | 0.0734 | |||
| CSCO / Cisco Systems, Inc. | 0.04 | 13.86 | 2.78 | 56.45 | 0.2775 | 0.0402 | |||
| MOH / Molina Healthcare, Inc. | 0.01 | 0.00 | 2.70 | -9.54 | 0.2701 | -0.0530 | |||
| SWKS / Skyworks Solutions, Inc. | 0.04 | 663.50 | 2.69 | 542.34 | 0.2683 | 0.2238 | |||
| CUBI / Customers Bancorp, Inc. | 0.04 | 11,301.80 | 2.61 | 37,114.29 | 0.2603 | 0.2592 | |||
| JNJ / Johnson & Johnson | 0.02 | -44.15 | 2.47 | -48.56 | 0.2471 | -0.2726 | |||
| PSA / Public Storage | 0.01 | 11,889.39 | 2.32 | 12,115.79 | 0.2320 | 0.2298 | |||
| TPR / Tapestry, Inc. | 0.02 | 465.53 | 2.18 | 607.14 | 0.2176 | 0.1842 | |||
| MCK / McKesson Corporation | 0.00 | -67.72 | 1.98 | -58.51 | 0.1978 | -0.3097 | |||
| LOPE / Grand Canyon Education, Inc. | 0.01 | 40.28 | 1.96 | 53.21 | 0.1957 | 0.0575 | |||
| CASH / Pathward Financial, Inc. | 0.02 | 127.07 | 1.92 | 146.34 | 0.1918 | 0.1076 | |||
| TSLA / Tesla, Inc. | 0.01 | -8.94 | 1.90 | 11.61 | 0.1902 | 0.0058 | |||
| BKH / Black Hills Corporation | 0.03 | -0.68 | 1.85 | -8.11 | 0.1846 | -0.0328 | |||
| IESC / IES Holdings, Inc. | 0.01 | 90.09 | 1.81 | 241.43 | 0.1812 | 0.1237 | |||
| VRSN / VeriSign, Inc. | 0.01 | 1.81 | 0.1804 | 0.1804 | |||||
| RCL / Royal Caribbean Cruises Ltd. | 0.01 | 0.00 | 1.72 | 52.44 | 0.1717 | 0.0498 | |||
| XOM / Exxon Mobil Corporation | 0.02 | -67.33 | 1.71 | -70.39 | 0.1706 | -0.4526 | |||
| ALLE / Allegion plc | 0.01 | 0.00 | 1.68 | 10.52 | 0.1680 | 0.0035 | |||
| KR / The Kroger Co. | 0.02 | 0.00 | 1.64 | 6.03 | 0.1635 | -0.0034 | |||
| KGS / Kodiak Gas Services, Inc. | 0.05 | 1.57 | 0.1572 | 0.1572 | |||||
| AIN / Albany International Corp. | 0.02 | 231.22 | 1.57 | 236.77 | 0.1565 | 0.1062 | |||
| PRIM / Primoris Services Corporation | 0.02 | 1.53 | 0.1530 | 0.1530 | |||||
| CMCSA / Comcast Corporation | 0.04 | 0.00 | 1.51 | -3.26 | 0.1513 | -0.0179 | |||
| FAF / First American Financial Corporation | 0.02 | 35.44 | 1.49 | 26.72 | 0.1493 | 0.0218 | |||
| AXS / AXIS Capital Holdings Limited | 0.01 | 35.43 | 1.46 | 40.31 | 0.1462 | 0.0334 | |||
| AIG / American International Group, Inc. | 0.02 | 441.12 | 1.42 | 537.84 | 0.1416 | 0.1179 | |||
| BWXT / BWX Technologies, Inc. | 0.01 | -56.82 | 1.41 | -36.94 | 0.1411 | -0.1010 | |||
| JBL / Jabil Inc. | 0.01 | 168.27 | 1.39 | 307.62 | 0.1389 | 0.1025 | |||
| REGN / Regeneron Pharmaceuticals, Inc. | 0.00 | 1.38 | 0.1377 | 0.1377 | |||||
| TRGP / Targa Resources Corp. | 0.01 | -58.61 | 1.34 | -64.06 | 0.1342 | -0.2698 | |||
| EAT / Brinker International, Inc. | 0.01 | 367.82 | 1.32 | 467.24 | 0.1315 | 0.1064 | |||
| DVN / Devon Energy Corporation | 0.04 | 0.00 | 1.28 | -14.94 | 0.1280 | -0.0348 | |||
| PLXS / Plexus Corp. | 0.01 | 1,997.55 | 1.27 | 4,009.68 | 0.1273 | 0.1215 | |||
| MMS / Maximus, Inc. | 0.02 | 0.00 | 1.23 | 2.93 | 0.1229 | -0.0063 | |||
| CIVI / Civitas Resources, Inc. | 0.04 | 3,448.17 | 1.23 | 1,846.03 | 0.1225 | 0.1158 | |||
| BFAM / Bright Horizons Family Solutions Inc. | 0.01 | 247.20 | 1.14 | 237.87 | 0.1142 | 0.0776 | |||
| FIX / Comfort Systems USA, Inc. | 0.00 | 1.12 | 0.1121 | 0.1121 | |||||
| HEI / HEICO Corporation | 0.00 | 149.03 | 1.09 | 518.08 | 0.1094 | 0.0786 | |||
| NTRS / Northern Trust Corporation | 0.01 | -85.67 | 1.09 | -82.28 | 0.1089 | -0.5455 | |||
| FCFS / FirstCash Holdings, Inc. | 0.01 | 387.95 | 1.09 | 450.00 | 0.1088 | 0.0874 | |||
| JCI / Johnson Controls International plc | 0.01 | 0.00 | 1.00 | 31.93 | 0.0999 | 0.0179 | |||
| Mini MSCI Emg Mkt / DE (MESU50000) | 1.00 | 0.0998 | 0.0998 | ||||||
| FCX / Freeport-McMoRan Inc. | 0.02 | 0.95 | 0.0945 | 0.0945 | |||||
| ANET / Arista Networks Inc | 0.01 | 0.92 | 0.0921 | 0.0921 | |||||
| BBY / Best Buy Co., Inc. | 0.01 | 16.35 | 0.91 | -24.42 | 0.0907 | -0.0367 | |||
| ALLY / Ally Financial Inc. | 0.02 | -46.80 | 0.87 | -43.25 | 0.0870 | -0.0787 | |||
| TXRH / Texas Roadhouse, Inc. | 0.00 | 0.73 | 0.85 | 13.35 | 0.0849 | 0.0038 | |||
| UI / Ubiquiti Inc. | 0.00 | 0.00 | 0.82 | 32.74 | 0.0815 | 0.0151 | |||
| AMAT / Applied Materials, Inc. | 0.00 | -41.94 | 0.80 | -34.64 | 0.0799 | -0.0503 | |||
| TOST / Toast, Inc. | 0.02 | 1,133.67 | 0.76 | 1,556.52 | 0.0762 | 0.0712 | |||
| JKHY / Jack Henry & Associates, Inc. | 0.00 | 0.73 | 0.0732 | 0.0732 | |||||
| S&P Mid Cap Futures / DE (FAU500000) | 0.73 | 0.0731 | 0.0731 | ||||||
| S&P 500 Mini Futures / DE (ESU500000) | 0.72 | 0.0723 | 0.0723 | ||||||
| URI / United Rentals, Inc. | 0.00 | 0.71 | 0.0714 | 0.0714 | |||||
| ASAN / Asana, Inc. | 0.05 | 72.32 | 0.68 | 59.72 | 0.0681 | 0.0220 | |||
| CNC / Centene Corporation | 0.01 | 0.00 | 0.67 | -10.58 | 0.0668 | -0.0140 | |||
| QCOM / QUALCOMM Incorporated | 0.00 | -27.05 | 0.61 | -24.34 | 0.0606 | -0.0261 | |||
| COP / ConocoPhillips | 0.01 | 0.00 | 0.60 | -14.49 | 0.0602 | -0.0160 | |||
| CW / Curtiss-Wright Corporation | 0.00 | 36.27 | 0.57 | 617.50 | 0.0574 | 0.0426 | |||
| DRS / Leonardo DRS, Inc. | 0.01 | 0.56 | 0.0555 | 0.0555 | |||||
| Russell 2000 Futures / DE (RTYU50000) | 0.55 | 0.0548 | 0.0548 | ||||||
| SM / SM Energy Company | 0.02 | 1,056.03 | 0.54 | 625.33 | 0.0544 | 0.0433 | |||
| SFM / Sprouts Farmers Market, Inc. | 0.00 | 0.48 | 0.51 | 8.47 | 0.0512 | 0.0001 | |||
| MYRG / MYR Group Inc. | 0.00 | 2,157.38 | 0.50 | 4,890.00 | 0.0499 | 0.0482 | |||
| FLR / Fluor Corporation | 0.01 | -18.47 | 0.46 | 16.67 | 0.0462 | 0.0034 | |||
| BJ / BJ's Wholesale Club Holdings, Inc. | 0.00 | 14,010.00 | 0.46 | 22,700.00 | 0.0456 | 0.0453 | |||
| DAVE / Dave Inc. | 0.00 | 0.45 | 0.0447 | 0.0447 | |||||
| WWD / Woodward, Inc. | 0.00 | 0.44 | 0.0437 | 0.0437 | |||||
| AGX / Argan, Inc. | 0.00 | 3.30 | 0.44 | 74.00 | 0.0435 | 0.0164 | |||
| LPLA / LPL Financial Holdings Inc. | 0.00 | 109.67 | 0.42 | 141.14 | 0.0423 | 0.0236 | |||
| ROKU / Roku, Inc. | 0.00 | 135.35 | 0.40 | 193.33 | 0.0396 | 0.0250 | |||
| SEZL / Sezzle Inc. | 0.00 | 173.81 | 0.39 | 1,348.15 | 0.0391 | 0.0361 | |||
| PEN / Penumbra, Inc. | 0.00 | 317.96 | 0.39 | 304.17 | 0.0388 | 0.0283 | |||
| ATKR / Atkore Inc. | 0.01 | 1,310.54 | 0.37 | 1,126.67 | 0.0368 | 0.0335 | |||
| IBM / International Business Machines Corporation | 0.00 | -96.12 | 0.36 | -91.77 | 0.0359 | -0.6785 | |||
| UHS / Universal Health Services, Inc. | 0.00 | 166.94 | 0.36 | 157.97 | 0.0357 | 0.0207 | |||
| MLI / Mueller Industries, Inc. | 0.00 | 0.35 | 0.0353 | 0.0353 | |||||
| L / Loews Corporation | 0.00 | -28.19 | 0.34 | -28.54 | 0.0344 | -0.0175 | |||
| LLYV.K / Liberty Live Group | 0.00 | 0.32 | 0.0316 | 0.0316 | |||||
| VST / Vistra Corp. | 0.00 | -83.61 | 0.31 | -73.00 | 0.0311 | -0.0934 | |||
| VMI / Valmont Industries, Inc. | 0.00 | 417.88 | 0.30 | 492.16 | 0.0302 | 0.0247 | |||
| CVCO / Cavco Industries, Inc. | 0.00 | -1.50 | 0.29 | -17.87 | 0.0286 | -0.0090 | |||
| WBS / Webster Financial Corporation | 0.01 | 0.28 | 0.0276 | 0.0276 | |||||
| AMKR / Amkor Technology, Inc. | 0.01 | 82.87 | 0.26 | 49.43 | 0.0264 | 0.0076 | |||
| GLW / Corning Incorporated | 0.00 | -75.48 | 0.24 | -71.89 | 0.0235 | -0.0669 | |||
| RUSHA / Rush Enterprises, Inc. | 0.00 | 411.10 | 0.23 | 427.27 | 0.0232 | 0.0169 | |||
| AEVA / Aeva Technologies, Inc. | 0.01 | 0.22 | 0.0225 | 0.0225 | |||||
| PRG / PROG Holdings, Inc. | 0.01 | 0.00 | 0.21 | 10.11 | 0.0208 | 0.0004 | |||
| QCRH / QCR Holdings, Inc. | 0.00 | 0.00 | 0.21 | -4.65 | 0.0205 | -0.0028 | |||
| RL / Ralph Lauren Corporation | 0.00 | 0.20 | 0.0198 | 0.0198 | |||||
| NTRA / Natera, Inc. | 0.00 | -79.99 | 0.19 | -76.15 | 0.0191 | -0.0675 | |||
| WMB / The Williams Companies, Inc. | 0.00 | -90.70 | 0.18 | -90.27 | 0.0176 | -0.1769 | |||
| SKYW / SkyWest, Inc. | 0.00 | -41.70 | 0.16 | -31.22 | 0.0163 | -0.0094 | |||
| TDY / Teledyne Technologies Incorporated | 0.00 | 0.16 | 0.0162 | 0.0162 | |||||
| HII / Huntington Ingalls Industries, Inc. | 0.00 | -94.89 | 0.16 | -95.36 | 0.0157 | -0.3411 | |||
| AVT / Avnet, Inc. | 0.00 | -64.52 | 0.16 | -62.68 | 0.0156 | -0.0444 | |||
| PKG / Packaging Corporation of America | 0.00 | 0.15 | 0.0146 | 0.0146 | |||||
| GPOR / Gulfport Energy Corporation | 0.00 | 0.00 | 0.15 | 9.77 | 0.0146 | 0.0001 | |||
| NUE / Nucor Corporation | 0.00 | 217.54 | 0.13 | 241.03 | 0.0134 | 0.0091 | |||
| INCY / Incyte Corporation | 0.00 | -54.65 | 0.12 | -59.59 | 0.0119 | -0.0336 | |||
| CSGP / CoStar Group, Inc. | 0.00 | -97.25 | 0.12 | -97.23 | 0.0117 | -0.4410 | |||
| REVG / REV Group, Inc. | 0.00 | -66.50 | 0.12 | -50.22 | 0.0116 | -0.0130 | |||
| CCSI / Consensus Cloud Solutions, Inc. | 0.00 | 0.00 | 0.11 | -0.88 | 0.0114 | -0.0009 | |||
| CATY / Cathay General Bancorp | 0.00 | 100.57 | 0.10 | 113.33 | 0.0097 | 0.0047 | |||
| PNRG / PrimeEnergy Resources Corporation | 0.00 | 0.00 | 0.09 | -35.86 | 0.0093 | -0.0064 | |||
| MHK / Mohawk Industries, Inc. | 0.00 | -97.83 | 0.09 | -98.10 | 0.0085 | -0.4664 | |||
| STC / Stewart Information Services Corporation | 0.00 | 21.54 | 0.08 | 10.00 | 0.0078 | 0.0002 | |||
| UTI / Universal Technical Institute, Inc. | 0.00 | 0.00 | 0.07 | 30.91 | 0.0073 | 0.0013 | |||
| WABC / Westamerica Bancorporation | 0.00 | 0.07 | 0.0073 | 0.0073 | |||||
| CALM / Cal-Maine Foods, Inc. | 0.00 | 0.07 | 0.0066 | 0.0066 | |||||
| WFRD / Weatherford International plc | 0.00 | 150.10 | 0.07 | 132.14 | 0.0066 | 0.0035 | |||
| LCII / LCI Industries | 0.00 | -54.94 | 0.05 | -69.54 | 0.0047 | -0.0210 | |||
| NRDS / NerdWallet, Inc. | 0.00 | -38.17 | 0.04 | -25.93 | 0.0041 | -0.0018 | |||
| HNI / HNI Corporation | 0.00 | 0.00 | 0.04 | 12.90 | 0.0035 | 0.0001 | |||
| BRY / Berry Corporation | 0.01 | 69.23 | 0.03 | 47.83 | 0.0034 | 0.0009 | |||
| NNE / NANO Nuclear Energy Inc. | 0.00 | 0.03 | 0.0033 | 0.0033 | |||||
| JILL / J.Jill, Inc. | 0.00 | 70.88 | 0.03 | 28.00 | 0.0033 | 0.0005 | |||
| PHIN / PHINIA Inc. | 0.00 | 0.03 | 0.0032 | 0.0032 | |||||
| MCRI / Monarch Casino & Resort, Inc. | 0.00 | 0.00 | 0.03 | 11.11 | 0.0031 | 0.0001 | |||
| TK / Teekay Corporation Ltd. | 0.00 | 0.00 | 0.03 | 26.09 | 0.0030 | 0.0004 | |||
| PWP / Perella Weinberg Partners | 0.00 | 0.00 | 0.03 | 7.69 | 0.0028 | -0.0001 | |||
| ZUMZ / Zumiez Inc. | 0.00 | 0.00 | 0.03 | -13.33 | 0.0027 | -0.0006 | |||
| MCS / The Marcus Corporation | 0.00 | 0.00 | 0.03 | 0.00 | 0.0026 | -0.0002 | |||
| MCY / Mercury General Corporation | 0.00 | 0.02 | 0.0023 | 0.0023 | |||||
| AR / Antero Resources Corporation | 0.00 | -89.00 | 0.02 | -89.44 | 0.0020 | -0.0176 | |||
| MDLM / Medley Management Inc. | 0.00 | -100.00 | 0.00 | 0.0000 | |||||
| AVA / Avista Corporation | 0.00 | -100.00 | 0.00 | -100.00 | -0.0345 | ||||
| CRVL / CorVel Corporation | 0.00 | -100.00 | 0.00 | -100.00 | -0.0023 | ||||
| ATGE / Adtalem Global Education Inc. | 0.00 | -100.00 | 0.00 | -100.00 | -0.0725 | ||||
| SR / Spire Inc. | 0.00 | -100.00 | 0.00 | -100.00 | -0.2384 | ||||
| WLDN / Willdan Group, Inc. | 0.00 | -100.00 | 0.00 | -100.00 | -0.0127 | ||||
| PFBC / Preferred Bank | 0.00 | -100.00 | 0.00 | -100.00 | -0.0060 | ||||
| MDLM / Medley Management Inc. | 0.00 | -100.00 | 0.00 | 0.0000 | |||||
| CAVA / CAVA Group, Inc. | 0.00 | -100.00 | 0.00 | -100.00 | -0.0180 | ||||
| US15942R1418 / CHAPARRAL ENERGY INC SER B WT 10/01/25 | 0.00 | 0.00 | 0.00 | 0.0000 | 0.0000 | ||||
| US17888HAB96 / Civitas Resources Inc | 0.00 | 0.00 | 0.00 | 0.0000 | 0.0000 |