Statistik Asas
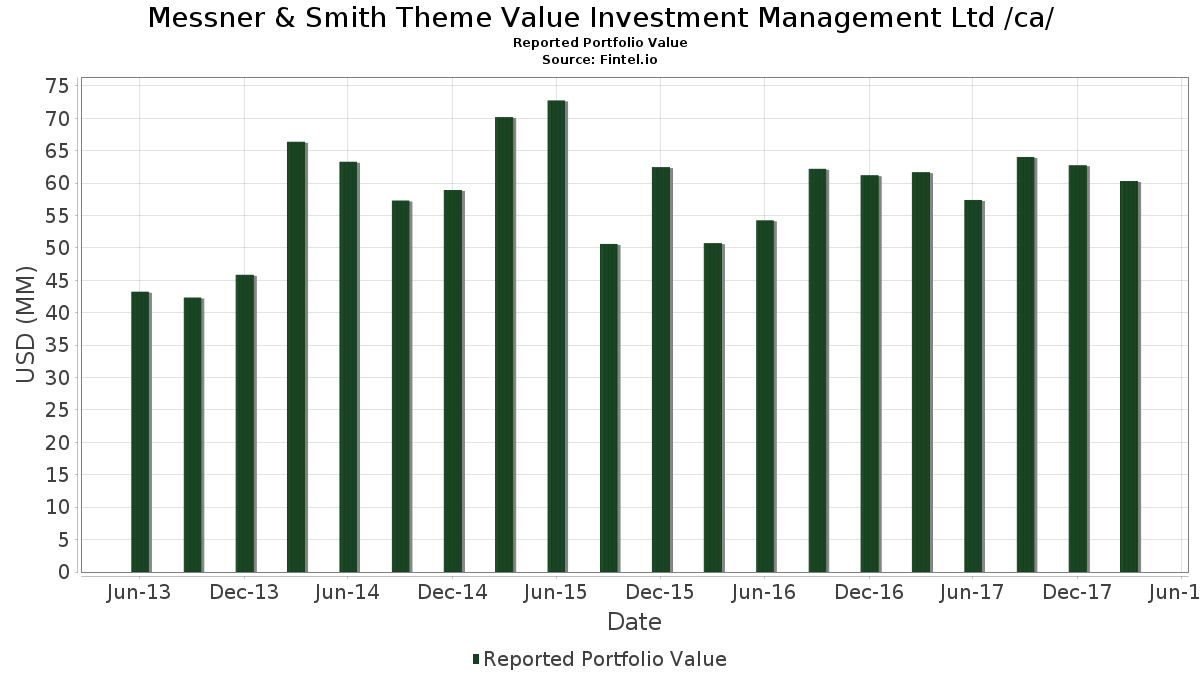
| Nilai Portfolio | $ 60,330,000 |
| Kedudukan Semasa | 111 |
Pegangan Terkini, Prestasi, AUM (dari 13F, 13D)
Messner & Smith Theme Value Investment Management Ltd /ca/ telah mendedahkan 111 jumlah pegangan dalam pemfailan SEC terkini mereka. Nilai portfolio terkini dikira sebagai $ 60,330,000 USD. Aset Sebenar Di Bawah Pengurusan (AUM) ialah nilai ini ditambah dengan tunai (yang tidak didedahkan). Pegangan teratas Messner & Smith Theme Value Investment Management Ltd /ca/ ialah GTT Communications Inc (US:GTTN) , Nutanix, Inc. (US:NTNX) , Summit Materials, Inc. (US:SUM) , Gentex Corporation (US:GNTX) , and Applied Materials, Inc. (US:AMAT) . Kedudukan baharu Messner & Smith Theme Value Investment Management Ltd /ca/ termasuk Atlas Financial Holdings, Inc. (US:AFHIF) , Lesaka Technologies Inc (US:UEPS) , Comstock Resources, Inc. Bond (US:205768AM6) , iShares Trust - iShares Short Treasury Bond ETF (US:SHV) , and The Campbell's Company (US:CPB) .
Kenaikan Teratas Suku Tahun Ini
Kami menggunakan perubahan dalam peruntukan portfolio kerana ini adalah metrik yang paling bermakna. Perubahan boleh disebabkan oleh perdagangan atau perubahan dalam harga saham.
| Sekuriti | Saham (MM) |
Nilai (MM$) |
Portfolio % | ΔPortfolio % |
|---|---|---|---|---|
| 0.07 | 3.90 | 6.4628 | 6.4628 | |
| 0.09 | 2.10 | 3.4726 | 3.4726 | |
| 0.04 | 1.99 | 3.3002 | 3.3002 | |
| 0.10 | 1.92 | 3.1792 | 3.1792 | |
| 0.04 | 1.91 | 3.1609 | 3.1609 | |
| 0.07 | 1.79 | 2.9637 | 2.9637 | |
| 0.06 | 1.75 | 2.8974 | 2.8974 | |
| 0.04 | 1.72 | 2.8444 | 2.8444 | |
| 0.08 | 1.69 | 2.7963 | 2.7963 | |
| 0.10 | 1.61 | 2.6687 | 2.6687 |
Penurunan Teratas Suku Tahun Ini
Kami menggunakan perubahan dalam peruntukan portfolio kerana ini adalah metrik yang paling bermakna. Perubahan boleh disebabkan oleh perdagangan atau perubahan dalam harga saham.
| Sekuriti | Saham (MM) |
Nilai (MM$) |
Portfolio % | ΔPortfolio % |
|---|---|---|---|---|
| 0.00 | 0.00 | -3.2733 | ||
| 0.01 | 0.19 | 0.3100 | -2.9920 | |
| 0.00 | 0.00 | -1.8565 | ||
| 0.00 | 0.00 | -1.8055 | ||
| 0.00 | 0.00 | -0.7793 | ||
| 0.25 | 1.08 | 1.7968 | -0.3004 | |
| 0.21 | 0.75 | 1.2398 | -0.2948 | |
| 0.01 | 0.88 | 1.4553 | -0.2944 | |
| 0.01 | 1.61 | 2.6637 | -0.1968 | |
| 0.01 | 1.22 | 2.0288 | -0.1241 |
13F dan Pemfailan Dana
Borang ini telah difailkan pada 2018-05-09 untuk tempoh pelaporan 2018-03-31. Klik ikon pautan untuk melihat sejarah transaksi penuh.
Tingkatkan untuk membuka data premium dan eksport ke Excel ![]() .
.
| Sekuriti | Jenis | Purata Harga Saham | Saham (MM) |
ΔSaham (%) |
ΔSaham (%) |
Nilai ($MM) |
Portfolio (%) |
ΔPortfolio (%) |
|
|---|---|---|---|---|---|---|---|---|---|
| GTTN / GTT Communications Inc | 0.07 | -2.78 | 3.90 | 17.37 | 6.4628 | 6.4628 | |||
| NTNX / Nutanix, Inc. | 0.07 | -3.43 | 3.58 | 34.40 | 5.9390 | 1.6905 | |||
| SUM / Summit Materials, Inc. | 0.07 | 8.34 | 2.10 | 4.37 | 3.4825 | 0.2746 | |||
| GNTX / Gentex Corporation | 0.09 | -1.62 | 2.10 | 8.10 | 3.4726 | 3.4726 | |||
| AMAT / Applied Materials, Inc. | 0.04 | 83.90 | 1.99 | 99.90 | 3.3002 | 3.3002 | |||
| US30224P2002 / Extended Stay America Inc | 0.10 | -3.29 | 1.92 | 0.63 | 3.1792 | 3.1792 | |||
| AMBA / Ambarella, Inc. | 0.04 | 1.91 | 3.1609 | 3.1609 | |||||
| BRKS / Brooks Automation, Inc. | 0.07 | -1.03 | 1.79 | 12.38 | 2.9637 | 2.9637 | |||
| MU / Micron Technology, Inc. | 0.03 | -0.66 | 1.77 | 25.89 | 2.9339 | 0.6933 | |||
| OLN / Olin Corporation | 0.06 | 92.75 | 1.75 | 64.60 | 2.8974 | 2.8974 | |||
| / Delphi Technologies PLC | 0.04 | 1.72 | 2.8444 | 2.8444 | |||||
| HTZZ / Hertz Global Holdings Inc. (New) | 0.08 | -5.51 | 1.69 | -15.14 | 2.7963 | 2.7963 | |||
| TROX / Tronox Holdings plc | 0.09 | 105.87 | 1.66 | 85.03 | 2.7449 | 1.3186 | |||
| FEYE / FireEye Inc | 0.10 | 1.61 | 2.6687 | 2.6687 | |||||
| ANAT / American National Group, Inc. | 0.01 | -1.80 | 1.61 | -10.47 | 2.6637 | -0.1968 | |||
| VEEV / Veeva Systems Inc. | 0.02 | 19.59 | 1.50 | 57.98 | 2.4930 | 2.4930 | |||
| LXFT / Luxoft Holding, Inc. | 0.04 | -0.06 | 1.47 | -26.48 | 2.4432 | 2.4432 | |||
| ABMD / Abiomed Inc. | 0.00 | -28.95 | 1.35 | 10.25 | 2.2460 | 0.2874 | |||
| CWEN / Clearway Energy, Inc. | 0.07 | -2.62 | 1.24 | -12.37 | 2.0554 | 2.0554 | |||
| MTOR / Meritor Inc | 0.06 | 1.60 | 1.23 | -10.93 | 2.0404 | 2.0404 | |||
| WDC / Western Digital Corporation | 0.01 | -21.95 | 1.22 | -9.40 | 2.0288 | -0.1241 | |||
| ERIE / Erie Indemnity Company | 0.01 | -2.26 | 1.09 | -5.61 | 1.8134 | -0.0336 | |||
| AFHIF / Atlas Financial Holdings, Inc. | 0.10 | 1.09 | 1.8001 | 1.8001 | |||||
| ESV / Ensco plc | 0.25 | 10.89 | 1.08 | -17.63 | 1.7968 | -0.3004 | |||
| CVX / Chevron Corporation | 0.01 | 2.20 | 0.91 | -6.84 | 1.5133 | -0.0484 | |||
| BA / The Boeing Company | 0.00 | -5.13 | 0.91 | 5.45 | 1.5084 | 0.1331 | |||
| CELG / Celgene Corp. | 0.01 | -6.37 | 0.88 | -20.04 | 1.4553 | -0.2944 | |||
| MZOR / Mazor Robotics Ltd. | 0.01 | -19.94 | 0.87 | -4.80 | 1.4454 | 1.4454 | |||
| UEPS / Lesaka Technologies Inc | 0.09 | 0.84 | 1.3990 | 1.3990 | |||||
| MCF / Contango Oil & Gas Company | 0.21 | 3.11 | 0.75 | -22.33 | 1.2398 | -0.2948 | |||
| MMM / 3M Company | 0.00 | 0.67 | 0.66 | -5.99 | 1.0923 | -0.0248 | |||
| US9220313079 / Vanguard GNMA Fund Investor Shares | 0.06 | 0.71 | 0.66 | -1.05 | 1.0890 | 0.0309 | |||
| ABT / Abbott Laboratories | 0.01 | 6.62 | 0.62 | 11.96 | 1.0244 | 0.1447 | |||
| UNIT / Unity Group LLC | 0.04 | -6.69 | 0.61 | -14.85 | 1.0078 | 1.0078 | |||
| T / AT&T Inc. | 0.01 | 0.00 | 0.52 | -8.39 | 0.8686 | -0.0430 | |||
| KCLI / Kansas City Life Insurance Company | 0.01 | -2.95 | 0.52 | -3.52 | 0.8636 | 0.8636 | |||
| XOM / Exxon Mobil Corporation | 0.01 | 0.00 | 0.50 | -10.79 | 0.8221 | -0.0639 | |||
| CDE / Coeur Mining, Inc. | 0.06 | -2.38 | 0.49 | 4.23 | 0.8172 | 0.0634 | |||
| MSFT / Microsoft Corporation | 0.01 | 4.80 | 0.48 | 11.94 | 0.7923 | 0.1118 | |||
| 205768AM6 / Comstock Resources, Inc. Bond | 0.47 | -0.63 | 0.0000 | ||||||
| DE / Deere & Company | 0.00 | 0.00 | 0.47 | -0.85 | 0.7724 | 0.0234 | |||
| WY / Weyerhaeuser Company | 0.01 | 1.79 | 0.46 | 1.10 | 0.7608 | 0.0373 | |||
| Y / Alleghany Corp. | 0.00 | 0.00 | 0.43 | 3.12 | 0.7127 | 0.0482 | |||
| PFE / Pfizer Inc. | 0.01 | 1.44 | 0.42 | -0.70 | 0.7045 | 0.0224 | |||
| NSC / Norfolk Southern Corporation | 0.00 | 0.00 | 0.42 | -6.24 | 0.6978 | -0.0177 | |||
| UNP / Union Pacific Corporation | 0.00 | 0.00 | 0.42 | 0.24 | 0.6912 | 0.0283 | |||
| SJW / SJW Group | 0.01 | -1.03 | 0.40 | -18.22 | 0.6697 | -0.1176 | |||
| QCOM / QUALCOMM Incorporated | 0.01 | 0.00 | 0.40 | -13.45 | 0.6614 | -0.0733 | |||
| VANGUARD FIXED INCOME SECS FIN / MUTUAL FUNDS (922031810) | 0.04 | 0.39 | 0.0000 | ||||||
| JNJ / Johnson & Johnson | 0.00 | 0.00 | 0.34 | -8.24 | 0.5719 | -0.0273 | |||
| DOW / Dow Inc. | 0.01 | 0.00 | 0.33 | -10.38 | 0.5437 | -0.0396 | |||
| BMY / Bristol-Myers Squibb Company | 0.01 | 0.00 | 0.32 | 3.18 | 0.5370 | 0.0367 | |||
| 904784709 / Unilever N.V. | 0.01 | 0.00 | 0.32 | 0.32 | 0.5238 | 0.0218 | |||
| GLW / Corning Incorporated | 0.01 | 0.00 | 0.25 | -12.85 | 0.4160 | -0.0429 | |||
| KO / The Coca-Cola Company | 0.01 | 0.00 | 0.25 | -5.34 | 0.4111 | -0.0065 | |||
| SNA / Snap-on Incorporated | 0.00 | 0.00 | 0.22 | -15.23 | 0.3597 | -0.0483 | |||
| MS / Morgan Stanley | 0.00 | 0.00 | 0.21 | 2.93 | 0.3497 | 0.3497 | |||
| FFRAX / Fidelity Advisor Series I - Fidelity Advisor Floating Rate High Income Class A | 0.02 | 0.57 | 0.19 | 0.53 | 0.3149 | 0.3149 | |||
| GE / General Electric Company | 0.01 | -88.29 | 0.19 | -90.97 | 0.3100 | -2.9920 | |||
| GLDI / ETRACS Gold Shares Covered Call ETNs due February 2, 2033 - Corporate Bond/Note | 0.01 | -17.75 | 0.14 | -17.18 | 0.2238 | -0.0360 | |||
| MITK / Mitek Systems, Inc. | 0.02 | -5.41 | 0.13 | -21.82 | 0.2138 | 0.2138 | |||
| VANGUARD FIXED INCOME SECS FIN / MUTUAL FUNDS (922031885) | 0.01 | 0.12 | 0.0000 | ||||||
| SHV / iShares Trust - iShares Short Treasury Bond ETF | 0.00 | 0.06 | 0.0945 | 0.0945 | |||||
| ONVO / Organovo Holdings, Inc. | 0.03 | -7.66 | 0.03 | -27.50 | 0.0481 | 0.0481 | |||
| CPB / The Campbell's Company | 0.00 | 0.03 | 0.0431 | 0.0431 | |||||
| BX / Blackstone Inc. | 0.00 | 0.02 | 0.0365 | 0.0365 | |||||
| BEP / Brookfield Renewable Partners L.P. - Limited Partnership | 0.00 | 0.02 | 0.0348 | 0.0348 | |||||
| LNG / Liquefied Natural Gas Ltd. | 0.05 | 0.02 | 0.0282 | 0.0282 | |||||
| BIP / Brookfield Infrastructure Partners L.P. - Limited Partnership | 0.00 | 0.02 | 0.0265 | 0.0265 | |||||
| KKR / KKR & Co. Inc. | 0.00 | 0.01 | 0.0249 | 0.0249 | |||||
| AVGO / Broadcom Inc. | 0.00 | 0.01 | 0.0249 | 0.0249 | |||||
| CELGZ / Celgene Corporation Series A Contingent Value Rights | 0.01 | 0.00 | 0.01 | 27.27 | 0.0232 | 0.0057 | |||
| BPR / Brookfield Property REIT Inc. | 0.00 | 0.01 | 0.0232 | 0.0232 | |||||
| ASTC / Astrotech Corporation | 0.00 | 0.00 | 0.01 | -20.00 | 0.0199 | -0.0040 | |||
| NEM / Newmont Corporation | 0.00 | 0.00 | 0.01 | 9.09 | 0.0199 | 0.0024 | |||
| BAMH / Brookfield Finance Inc - 4.625% NT REDEEM 16/10/2080 USD 25 | 0.00 | 0.01 | 0.0199 | 0.0199 | |||||
| CSCO / Cisco Systems, Inc. | 0.00 | 0.01 | 0.0182 | 0.0182 | |||||
| LULU / lululemon athletica inc. | 0.00 | 0.01 | 0.0182 | 0.0182 | |||||
| IPI / Intrepid Potash, Inc. | 0.00 | 0.00 | 0.01 | -21.43 | 0.0182 | -0.0041 | |||
| KLAC / KLA Corporation | 0.00 | 0.01 | 0.0149 | 0.0149 | |||||
| IAU / iShares Gold Trust | 0.00 | 0.00 | 0.01 | 0.00 | 0.0133 | 0.0005 | |||
| TROV / TrovaGene, Inc. | 0.02 | -4.19 | 0.01 | 14.29 | 0.0133 | 0.0021 | |||
| WDAY / Workday, Inc. | 0.00 | 0.01 | 0.0116 | 0.0116 | |||||
| CHKP / Check Point Software Technologies Ltd. | 0.00 | 0.01 | 0.0099 | 0.0099 | |||||
| CTGO / Contango Ore, Inc. | 0.00 | 0.00 | 0.01 | 20.00 | 0.0099 | 0.0099 | |||
| PII / Polaris Inc. | 0.00 | 0.01 | 0.0099 | 0.0099 | |||||
| MRK / Merck & Co., Inc. | 0.00 | 0.01 | 0.0099 | 0.0099 | |||||
| F / Ford Motor Company | 0.00 | 0.01 | 0.0099 | 0.0099 | |||||
| PYPL / PayPal Holdings, Inc. | 0.00 | 0.01 | 0.0099 | 0.0099 | |||||
| COST / Costco Wholesale Corporation | 0.00 | 0.01 | 0.0099 | 0.0099 | |||||
| AAPL / Apple Inc. | 0.00 | 0.01 | 0.0099 | 0.0099 | |||||
| ITW / Illinois Tool Works Inc. | 0.00 | 0.01 | 0.0099 | 0.0099 | |||||
| GM / General Motors Company | 0.00 | 0.01 | 0.0083 | 0.0083 | |||||
| BKNG / Booking Holdings Inc. | 0.00 | 0.00 | 0.0066 | 0.0066 | |||||
| / McDermott International, Inc. | 0.00 | 0.00 | 0.00 | 0.00 | 0.0066 | 0.0003 | |||
| LMT / Lockheed Martin Corporation | 0.00 | 0.00 | 0.0050 | 0.0050 | |||||
| MMTRS / Mills Music Trust | 0.00 | 0.00 | 0.00 | 50.00 | 0.0050 | 0.0018 | |||
| ROK / Rockwell Automation, Inc. | 0.00 | 0.00 | 0.0050 | 0.0050 | |||||
| TXN / Texas Instruments Incorporated | 0.00 | 0.00 | 0.0050 | 0.0050 | |||||
| MAN / ManpowerGroup Inc. | 0.00 | 0.00 | 0.0050 | 0.0050 | |||||
| WABC / Westamerica Bancorporation | 0.00 | 0.00 | 0.0050 | 0.0050 | |||||
| DAL / Delta Air Lines, Inc. | 0.00 | 0.00 | 0.0050 | 0.0050 | |||||
| USBI / United Security Bancshares, Inc. | 0.00 | 0.00 | 0.0050 | 0.0050 | |||||
| RHI / Robert Half Inc. | 0.00 | 0.00 | 0.0050 | 0.0050 | |||||
| KDUS / Cadus Corp. | 0.00 | 0.00 | 0.00 | 0.00 | 0.0050 | 0.0002 | |||
| FDX / FedEx Corporation | 0.00 | 0.00 | 0.0050 | 0.0050 | |||||
| UMPQ / Umpqua Holdings Corp | 0.00 | 0.00 | 0.0050 | 0.0050 | |||||
| MNST / Monster Beverage Corporation | 0.00 | 0.00 | 0.0050 | 0.0050 | |||||
| PPG / PPG Industries, Inc. | 0.00 | 0.00 | 0.0050 | 0.0050 | |||||
| HD / The Home Depot, Inc. | 0.00 | 0.00 | 0.0050 | 0.0050 | |||||
| GOOG / Alphabet Inc. | 0.00 | 0.00 | 0.0033 | 0.0033 | |||||
| CRC / California Resources Corporation | 0.00 | 0.00 | 0.00 | 0.0000 | 0.0000 | ||||
| IWS / iShares Trust - iShares Russell Mid-Cap Value ETF | 0.00 | -100.00 | 0.00 | -100.00 | -1.8055 | ||||
| PSEC / Prospect Capital Corporation | 0.00 | -100.00 | 0.00 | -100.00 | 0.0000 | ||||
| SNMX / Senomyx, Inc. | 0.00 | 0.00 | 0.00 | 0.0000 | 0.0000 | ||||
| HFC / HollyFrontier Corp | 0.00 | -100.00 | 0.00 | -100.00 | 0.0000 | ||||
| DIREXION DAILY GOLD MINERS INDEX / (001424958) | 0.00 | -100.00 | 0.00 | 0.0000 | |||||
| CRK / Comstock Resources, Inc. | 0.00 | 0.00 | 0.00 | 0.0000 | 0.0000 | ||||
| FNSR / Finisar Corporation | 0.00 | -100.00 | 0.00 | -100.00 | 0.0000 | ||||
| PCSV / PCS Edventures!, Inc. | 0.02 | 0.00 | 0.00 | 0.0000 | 0.0000 | ||||
| FLR / Fluor Corporation | 0.00 | -100.00 | 0.00 | -100.00 | -0.0335 | ||||
| SCOR / comScore, Inc. | 0.00 | -100.00 | 0.00 | -100.00 | 0.0000 | ||||
| KTOS / Kratos Defense & Security Solutions, Inc. | 0.00 | -100.00 | 0.00 | -100.00 | -1.8565 | ||||
| WELL / Welltower Inc. | 0.00 | -100.00 | 0.00 | -100.00 | -0.7793 | ||||
| APA / APA Corporation | 0.00 | -100.00 | 0.00 | -100.00 | 0.0000 | ||||
| OCLR / Oclaro, Inc | 0.00 | -100.00 | 0.00 | -100.00 | 0.0000 | ||||
| US5537771033 / MTS Systems Corporation | 0.00 | -100.00 | 0.00 | -100.00 | -3.2733 |