Statistik Asas
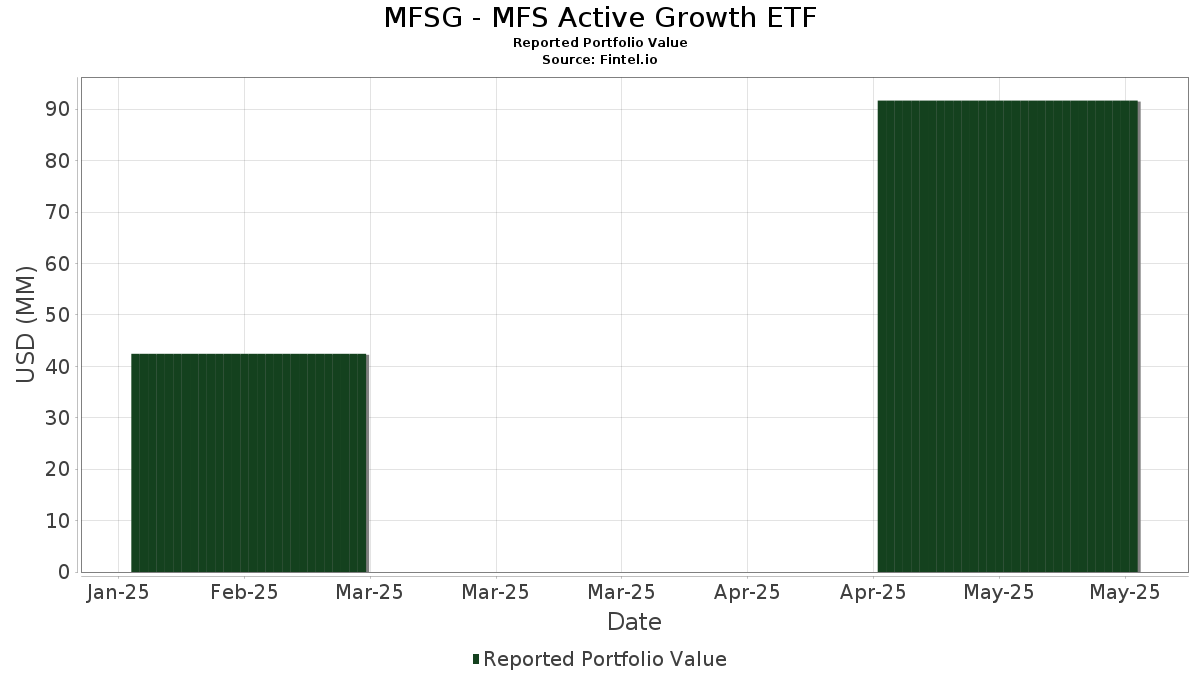
| Nilai Portfolio | $ 91,668,473 |
| Kedudukan Semasa | 53 |
Pegangan Terkini, Prestasi, AUM (dari 13F, 13D)
MFSG - MFS Active Growth ETF telah mendedahkan 53 jumlah pegangan dalam pemfailan SEC terkini mereka. Nilai portfolio terkini dikira sebagai $ 91,668,473 USD. Aset Sebenar Di Bawah Pengurusan (AUM) ialah nilai ini ditambah dengan tunai (yang tidak didedahkan). Pegangan teratas MFSG - MFS Active Growth ETF ialah Microsoft Corporation (US:MSFT) , Amazon.com, Inc. (US:AMZN) , NVIDIA Corporation (US:NVDA) , Meta Platforms, Inc. (US:META) , and Apple Inc. (US:AAPL) . Kedudukan baharu MFSG - MFS Active Growth ETF termasuk Abbott Laboratories (US:ABT) , Amphenol Corporation (US:APH) , Fiserv, Inc. (US:FI) , CRH plc (US:CRH) , and Roper Technologies, Inc. (US:ROP) .
Kenaikan Teratas Suku Tahun Ini
Kami menggunakan perubahan dalam peruntukan portfolio kerana ini adalah metrik yang paling bermakna. Perubahan boleh disebabkan oleh perdagangan atau perubahan dalam harga saham.
| Sekuriti | Saham (MM) |
Nilai (MM$) |
Portfolio % | ΔPortfolio % |
|---|---|---|---|---|
| 0.00 | 3.87 | 4.2227 | 1.8341 | |
| 0.03 | 12.40 | 13.5208 | 1.7758 | |
| 0.01 | 1.80 | 1.9600 | 1.3795 | |
| 0.01 | 1.06 | 1.1600 | 1.1600 | |
| 0.01 | 0.98 | 1.0632 | 1.0632 | |
| 0.01 | 1.31 | 1.4290 | 0.8658 | |
| 0.00 | 2.26 | 2.4651 | 0.7872 | |
| 0.00 | 0.63 | 0.6871 | 0.6871 | |
| 0.01 | 0.61 | 0.6623 | 0.6623 | |
| 0.00 | 0.59 | 0.6479 | 0.6479 |
Penurunan Teratas Suku Tahun Ini
Kami menggunakan perubahan dalam peruntukan portfolio kerana ini adalah metrik yang paling bermakna. Perubahan boleh disebabkan oleh perdagangan atau perubahan dalam harga saham.
| Sekuriti | Saham (MM) |
Nilai (MM$) |
Portfolio % | ΔPortfolio % |
|---|---|---|---|---|
| 0.00 | 0.32 | 0.3491 | -1.5964 | |
| 0.00 | 0.25 | 0.2719 | -1.4610 | |
| 0.00 | 0.46 | 0.5008 | -1.2930 | |
| 0.02 | 4.61 | 5.0238 | -1.0696 | |
| 0.03 | 4.45 | 4.8567 | -1.0114 | |
| 0.01 | 6.50 | 7.0854 | -0.8438 | |
| 0.00 | 0.43 | 0.4688 | -0.7890 | |
| 0.00 | 0.00 | -0.7859 | ||
| 0.00 | 0.00 | -0.5987 | ||
| 0.00 | 0.00 | -0.5113 |
13F dan Pemfailan Dana
Borang ini telah difailkan pada 2025-07-25 untuk tempoh pelaporan 2025-05-31. Klik ikon pautan untuk melihat sejarah transaksi penuh.
Tingkatkan untuk membuka data premium dan eksport ke Excel ![]() .
.
| Sekuriti | Jenis | Purata Harga Saham | Saham (MM) |
ΔSaham (%) |
ΔSaham (%) |
Nilai ($MM) |
Portfolio (%) |
ΔPortfolio (%) |
|
|---|---|---|---|---|---|---|---|---|---|
| MSFT / Microsoft Corporation | 0.03 | 114.49 | 12.40 | 148.75 | 13.5208 | 1.7758 | |||
| AMZN / Amazon.com, Inc. | 0.04 | 114.49 | 7.95 | 107.17 | 8.6678 | -0.3731 | |||
| NVDA / NVIDIA Corporation | 0.06 | 94.69 | 7.65 | 110.61 | 8.3364 | -0.2161 | |||
| META / Meta Platforms, Inc. | 0.01 | 99.25 | 6.50 | 93.11 | 7.0854 | -0.8438 | |||
| AAPL / Apple Inc. | 0.02 | 114.49 | 4.61 | 78.15 | 5.0238 | -1.0696 | |||
| GOOGL / Alphabet Inc. | 0.03 | 77.30 | 4.45 | 78.88 | 4.8567 | -1.0114 | |||
| NFLX / Netflix, Inc. | 0.00 | 210.25 | 3.87 | 282.23 | 4.2227 | 1.8341 | |||
| MA / Mastercard Incorporated | 0.01 | 137.70 | 3.64 | 141.64 | 3.9735 | 0.4190 | |||
| GEV / GE Vernova Inc. | 0.00 | 124.94 | 2.26 | 217.42 | 2.4651 | 0.7872 | |||
| V / Visa Inc. | 0.01 | 138.73 | 2.17 | 140.56 | 2.3613 | 0.2387 | |||
| PM / Philip Morris International Inc. | 0.01 | 527.22 | 1.80 | 630.49 | 1.9600 | 1.3795 | |||
| GE / General Electric Company | 0.01 | 128.14 | 1.66 | 171.01 | 1.8150 | 0.3682 | |||
| TT / Trane Technologies plc | 0.00 | 145.07 | 1.46 | 198.16 | 1.5867 | 0.4368 | |||
| COST / Costco Wholesale Corporation | 0.00 | 114.49 | 1.39 | 112.75 | 1.5107 | -0.0234 | |||
| ETN / Eaton Corporation plc | 0.00 | 170.70 | 1.38 | 195.70 | 1.4999 | 0.4032 | |||
| ICE / Intercontinental Exchange, Inc. | 0.01 | 428.19 | 1.31 | 448.12 | 1.4290 | 0.8658 | |||
| NOW / ServiceNow, Inc. | 0.00 | 76.52 | 1.23 | 92.04 | 1.3428 | -0.1686 | |||
| AVGO / Broadcom Inc. | 0.01 | 114.49 | 1.22 | 160.81 | 1.3282 | 0.2259 | |||
| KKR / KKR & Co. Inc. | 0.01 | 114.67 | 1.15 | 92.46 | 1.2535 | -0.1549 | |||
| MDT / Medtronic plc | 0.01 | 114.37 | 1.13 | 93.49 | 1.2326 | -0.1451 | |||
| GVMXX / State Street Institutional Investment Trust - State Street Institutional US Govt Money Market Fnd Premier Cls | 1.10 | 189.87 | 1.10 | 190.00 | 1.2024 | 0.3061 | |||
| TJX / The TJX Companies, Inc. | 0.01 | 237.60 | 1.09 | 243.71 | 1.1926 | 0.4422 | |||
| ABT / Abbott Laboratories | 0.01 | 1.06 | 1.1600 | 1.1600 | |||||
| APH / Amphenol Corporation | 0.01 | 0.98 | 1.0632 | 1.0632 | |||||
| CRM / Salesforce, Inc. | 0.00 | 112.59 | 0.95 | 89.62 | 1.0359 | -0.1458 | |||
| TSM / Taiwan Semiconductor Manufacturing Company Limited - Depositary Receipt (Common Stock) | 0.00 | 87.21 | 0.95 | 100.64 | 1.0308 | -0.0801 | |||
| ISRG / Intuitive Surgical, Inc. | 0.00 | 136.81 | 0.90 | 128.35 | 0.9841 | 0.0524 | |||
| CEG / Constellation Energy Corporation | 0.00 | 92.81 | 0.89 | 135.88 | 0.9757 | 0.0809 | |||
| KLAC / KLA Corporation | 0.00 | 171.50 | 0.85 | 190.10 | 0.9276 | 0.2363 | |||
| TEAM / Atlassian Corporation | 0.00 | 132.10 | 0.82 | 69.48 | 0.8970 | -0.2462 | |||
| TE Connectivity PLC / EC (IE000IVNQZ81) | 0.00 | 114.49 | 0.78 | 123.14 | 0.8524 | 0.0262 | |||
| ASML / ASML Holding N.V. - Depositary Receipt (Common Stock) | 0.00 | 183.77 | 0.72 | 195.49 | 0.7865 | 0.2102 | |||
| ADSK / Autodesk, Inc. | 0.00 | 114.49 | 0.70 | 132.12 | 0.7646 | 0.0514 | |||
| HESAY / Hermès International Société en commandite par actions - Depositary Receipt (Common Stock) | 0.00 | 114.49 | 0.69 | 108.73 | 0.7559 | -0.0266 | |||
| HLT / Hilton Worldwide Holdings Inc. | 0.00 | 211.04 | 0.69 | 192.41 | 0.7558 | 0.1959 | |||
| MCO / Moody's Corporation | 0.00 | 246.86 | 0.69 | 230.77 | 0.7505 | 0.2590 | |||
| AON / Aon plc | 0.00 | 114.49 | 0.66 | 95.27 | 0.7205 | -0.0775 | |||
| FI / Fiserv, Inc. | 0.00 | 0.63 | 0.6871 | 0.6871 | |||||
| APO / Apollo Global Management, Inc. | 0.00 | 114.49 | 0.62 | 87.84 | 0.6749 | -0.1016 | |||
| CRH / CRH plc | 0.01 | 0.61 | 0.6623 | 0.6623 | |||||
| ROP / Roper Technologies, Inc. | 0.00 | 0.59 | 0.6479 | 0.6479 | |||||
| TMO / Thermo Fisher Scientific Inc. | 0.00 | 117.38 | 0.59 | 65.92 | 0.6426 | -0.1961 | |||
| APD / Air Products and Chemicals, Inc. | 0.00 | 114.49 | 0.58 | 89.18 | 0.6301 | -0.0894 | |||
| CI / The Cigna Group | 0.00 | 0.55 | 0.6021 | 0.6021 | |||||
| SHOP / Shopify Inc. | 0.01 | 153.22 | 0.54 | 142.41 | 0.5924 | 0.0644 | |||
| BSX / Boston Scientific Corporation | 0.00 | 114.49 | 0.51 | 117.80 | 0.5605 | 0.0038 | |||
| MAR / Marriott International, Inc. | 0.00 | 114.49 | 0.47 | 101.72 | 0.5109 | -0.0362 | |||
| VRTX / Vertex Pharmaceuticals Incorporated | 0.00 | -34.53 | 0.46 | -39.68 | 0.5008 | -1.2930 | |||
| ACN / Accenture plc | 0.00 | -11.42 | 0.43 | -19.51 | 0.4688 | -0.7890 | |||
| DHR / Danaher Corporation | 0.00 | 84.51 | 0.39 | 68.56 | 0.4218 | -0.1186 | |||
| SBUX / Starbucks Corporation | 0.00 | 0.37 | 0.4014 | 0.4014 | |||||
| LLY / Eli Lilly and Company | 0.00 | -51.62 | 0.32 | -61.21 | 0.3491 | -1.5964 | |||
| ABBV / AbbVie Inc. | 0.00 | -61.92 | 0.25 | -66.12 | 0.2719 | -1.4610 | |||
| BX / Blackstone Inc. | 0.00 | -100.00 | 0.00 | -100.00 | -0.7859 | ||||
| INTU / Intuit Inc. | 0.00 | -100.00 | 0.00 | -100.00 | -0.5987 | ||||
| NDAQ / Nasdaq, Inc. | 0.00 | -100.00 | 0.00 | -100.00 | -0.5113 | ||||
| SHW / The Sherwin-Williams Company | 0.00 | -100.00 | 0.00 | -100.00 | -0.4711 |