Statistik Asas
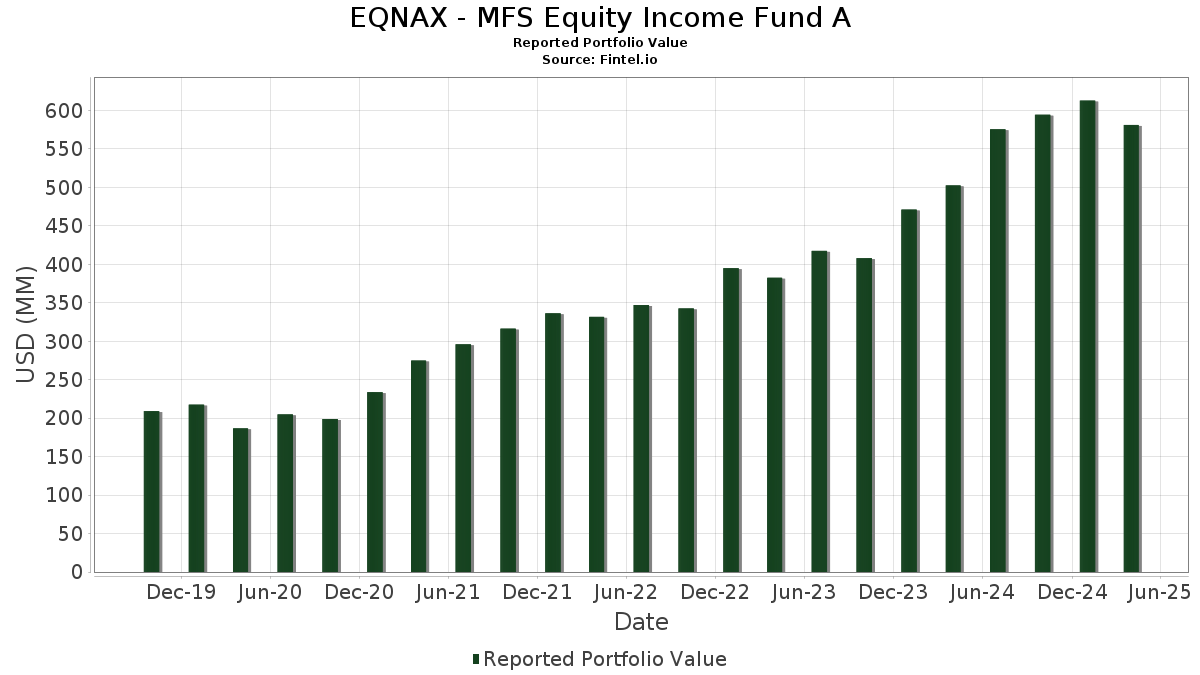
| Nilai Portfolio | $ 581,206,816 |
| Kedudukan Semasa | 98 |
Pegangan Terkini, Prestasi, AUM (dari 13F, 13D)
EQNAX - MFS Equity Income Fund A telah mendedahkan 98 jumlah pegangan dalam pemfailan SEC terkini mereka. Nilai portfolio terkini dikira sebagai $ 581,206,816 USD. Aset Sebenar Di Bawah Pengurusan (AUM) ialah nilai ini ditambah dengan tunai (yang tidak didedahkan). Pegangan teratas EQNAX - MFS Equity Income Fund A ialah Wells Fargo & Company (US:WFC) , AbbVie Inc. (US:ABBV) , JPMorgan Chase & Co. (US:JPM) , The Cigna Group (US:CI) , and Pfizer Inc. (US:PFE) . Kedudukan baharu EQNAX - MFS Equity Income Fund A termasuk Mastercard Incorporated (US:MA) , Lincoln National Corporation (US:LNC) , Humana Inc. (US:HUM) , Broadcom Inc. (US:AVGO) , and T-Mobile US, Inc. (US:TMUS) .
Kenaikan Teratas Suku Tahun Ini
Kami menggunakan perubahan dalam peruntukan portfolio kerana ini adalah metrik yang paling bermakna. Perubahan boleh disebabkan oleh perdagangan atau perubahan dalam harga saham.
| Sekuriti | Saham (MM) |
Nilai (MM$) |
Portfolio % | ΔPortfolio % |
|---|---|---|---|---|
| 0.17 | 8.98 | 1.5227 | 1.5227 | |
| 0.01 | 4.23 | 0.7168 | 0.7168 | |
| 0.12 | 3.77 | 0.6401 | 0.6401 | |
| 0.01 | 3.46 | 0.5863 | 0.5863 | |
| 0.15 | 7.62 | 1.2922 | 0.5520 | |
| 0.02 | 3.23 | 0.5485 | 0.5485 | |
| 0.01 | 3.13 | 0.5303 | 0.5303 | |
| 0.04 | 2.93 | 0.4970 | 0.4970 | |
| 0.32 | 8.99 | 1.5245 | 0.4417 | |
| 0.04 | 14.14 | 2.3989 | 0.4196 |
Penurunan Teratas Suku Tahun Ini
Kami menggunakan perubahan dalam peruntukan portfolio kerana ini adalah metrik yang paling bermakna. Perubahan boleh disebabkan oleh perdagangan atau perubahan dalam harga saham.
| Sekuriti | Saham (MM) |
Nilai (MM$) |
Portfolio % | ΔPortfolio % |
|---|---|---|---|---|
| 0.03 | 10.13 | 1.7191 | -1.3694 | |
| 0.03 | 6.00 | 1.0183 | -1.0955 | |
| 0.04 | 7.48 | 1.2694 | -0.5771 | |
| 0.06 | 14.57 | 2.4708 | -0.5298 | |
| 0.07 | 11.80 | 2.0018 | -0.4508 | |
| 0.07 | 6.49 | 1.1010 | -0.3964 | |
| 0.15 | 9.03 | 1.5326 | -0.3791 | |
| 0.05 | 9.48 | 1.6086 | -0.3684 | |
| 0.04 | 10.53 | 1.7870 | -0.2436 | |
| 0.30 | 1.44 | 0.2440 | -0.2409 |
13F dan Pemfailan Dana
Borang ini telah difailkan pada 2025-06-24 untuk tempoh pelaporan 2025-04-30. Klik ikon pautan untuk melihat sejarah transaksi penuh.
Tingkatkan untuk membuka data premium dan eksport ke Excel ![]() .
.
| Sekuriti | Jenis | Purata Harga Saham | Saham (MM) |
ΔSaham (%) |
ΔSaham (%) |
Nilai ($MM) |
Portfolio (%) |
ΔPortfolio (%) |
|
|---|---|---|---|---|---|---|---|---|---|
| WFC / Wells Fargo & Company | 0.25 | 0.00 | 17.58 | -9.89 | 2.9814 | -0.1736 | |||
| ABBV / AbbVie Inc. | 0.08 | 0.00 | 15.16 | 6.09 | 2.5717 | 0.2601 | |||
| JPM / JPMorgan Chase & Co. | 0.06 | -14.19 | 14.57 | -21.47 | 2.4708 | -0.5298 | |||
| CI / The Cigna Group | 0.04 | 0.00 | 14.14 | 15.58 | 2.3989 | 0.4196 | |||
| PFE / Pfizer Inc. | 0.51 | 0.00 | 12.40 | -7.95 | 2.1026 | -0.0758 | |||
| QCOM / QUALCOMM Incorporated | 0.08 | 0.00 | 11.91 | -14.15 | 2.0195 | -0.2238 | |||
| GOOGL / Alphabet Inc. | 0.07 | 0.00 | 11.80 | -22.17 | 2.0018 | -0.4508 | |||
| MCK / McKesson Corporation | 0.02 | -25.48 | 11.05 | -10.69 | 1.8745 | -0.1269 | |||
| HD / The Home Depot, Inc. | 0.03 | 0.00 | 10.67 | -12.50 | 1.8106 | -0.1626 | |||
| AMP / Ameriprise Financial, Inc. | 0.02 | 0.00 | 10.63 | -13.32 | 1.8035 | -0.1805 | |||
| AXP / American Express Company | 0.04 | 0.00 | 10.53 | -16.08 | 1.7870 | -0.2436 | |||
| BAC / Bank of America Corporation | 0.26 | 0.00 | 10.34 | -13.87 | 1.7545 | -0.1880 | |||
| MSFT / Microsoft Corporation | 0.03 | -44.26 | 10.13 | -46.92 | 1.7191 | -1.3694 | |||
| BPOP / Popular, Inc. | 0.10 | 0.00 | 9.84 | -7.30 | 1.6684 | -0.0480 | |||
| TT / Trane Technologies plc | 0.03 | 0.00 | 9.73 | 5.67 | 1.6506 | 0.1610 | |||
| MDT / Medtronic plc | 0.11 | 0.00 | 9.53 | -6.67 | 1.6161 | -0.0352 | |||
| AMZN / Amazon.com, Inc. | 0.05 | 0.00 | 9.48 | -22.40 | 1.6086 | -0.3684 | |||
| KMB / Kimberly-Clark Corporation | 0.07 | 0.00 | 9.46 | 1.39 | 1.6052 | 0.0955 | |||
| C / Citigroup Inc. | 0.14 | 0.00 | 9.24 | -16.03 | 1.5669 | -0.2125 | |||
| US21871X1090 / Corebridge Financial, Inc. | 0.31 | 0.00 | 9.19 | -12.24 | 1.5595 | -0.1350 | |||
| MAS / Masco Corporation | 0.15 | 0.00 | 9.03 | -23.55 | 1.5326 | -0.3791 | |||
| FINGF / Finning International Inc. | 0.32 | 18.78 | 8.99 | 34.27 | 1.5245 | 0.4417 | |||
| SYF / Synchrony Financial | 0.17 | 8.98 | 1.5227 | 1.5227 | |||||
| WPC / W. P. Carey Inc. | 0.14 | 0.00 | 8.96 | 11.68 | 1.5201 | 0.2221 | |||
| NTRS / Northern Trust Corporation | 0.09 | 0.00 | 8.91 | -16.30 | 1.5113 | -0.2107 | |||
| JNJ / Johnson & Johnson | 0.05 | 0.00 | 8.08 | 2.73 | 1.3709 | 0.0984 | |||
| RTPPF / Rio Tinto Group | 0.13 | 0.00 | 8.02 | -1.24 | 1.3600 | 0.0467 | |||
| FTI / TechnipFMC plc | 0.28 | 21.06 | 7.99 | 13.47 | 1.3558 | 0.2165 | |||
| NEE.PRT / NextEra Energy, Inc. - Debt/Equity Composite Units | 0.18 | 0.00 | 7.72 | -5.02 | 1.3089 | -0.0052 | |||
| EQH / Equitable Holdings, Inc. | 0.15 | 58.53 | 7.62 | 72.92 | 1.2922 | 0.5520 | |||
| TSM / Taiwan Semiconductor Manufacturing Company Limited - Depositary Receipt (Common Stock) | 0.04 | -17.68 | 7.48 | -34.45 | 1.2694 | -0.5771 | |||
| PSX / Phillips 66 | 0.07 | 0.00 | 6.98 | -11.71 | 1.1843 | -0.0950 | |||
| ENB / Enbridge Inc. | 0.15 | 0.00 | 6.96 | 8.14 | 1.1808 | 0.1395 | |||
| CUZ / Cousins Properties Incorporated | 0.24 | 56.49 | 6.54 | 41.17 | 1.1094 | 0.3600 | |||
| IBDRY / Iberdrola, S.A. - Depositary Receipt (Common Stock) | 0.36 | 0.00 | 6.51 | 27.57 | 1.1044 | 0.2788 | |||
| TGT / Target Corporation | 0.07 | 0.00 | 6.49 | -29.88 | 1.1010 | -0.3964 | |||
| HIW / Highwoods Properties, Inc. | 0.22 | 0.00 | 6.22 | -4.53 | 1.0552 | 0.0012 | |||
| AAPL / Apple Inc. | 0.03 | -48.98 | 6.00 | -54.06 | 1.0183 | -1.0955 | |||
| OMC / Omnicom Group Inc. | 0.08 | 0.00 | 5.98 | -12.24 | 1.0143 | -0.0880 | |||
| ETN / Eaton Corporation plc | 0.02 | 0.00 | 5.96 | -9.82 | 1.0111 | -0.0582 | |||
| EPRT / Essential Properties Realty Trust, Inc. | 0.18 | 0.00 | 5.63 | 0.23 | 0.9557 | 0.0463 | |||
| RHHBY / Roche Holding AG - Depositary Receipt (Common Stock) | 0.02 | 0.00 | 5.47 | 3.91 | 0.9279 | 0.0763 | |||
| GILD / Gilead Sciences, Inc. | 0.05 | 0.00 | 5.38 | 9.60 | 0.9121 | 0.1185 | |||
| GOB / Compagnie de Saint-Gobain S.A. | 0.05 | 0.00 | 5.02 | 16.44 | 0.8520 | 0.1542 | |||
| MO / Altria Group, Inc. | 0.08 | 0.00 | 4.92 | 13.23 | 0.8347 | 0.1318 | |||
| CL / Colgate-Palmolive Company | 0.05 | 0.00 | 4.88 | 6.34 | 0.8281 | 0.0854 | |||
| MDLZ / Mondelez International, Inc. | 0.07 | 0.00 | 4.85 | 17.48 | 0.8219 | 0.1548 | |||
| MFC / Manulife Financial Corporation | 0.16 | 0.00 | 4.84 | 2.48 | 0.8203 | 0.0570 | |||
| E / Eni S.p.A. - Depositary Receipt (Common Stock) | 0.33 | 0.00 | 4.63 | 0.65 | 0.7855 | 0.0412 | |||
| AMAT / Applied Materials, Inc. | 0.03 | 0.00 | 4.62 | -16.43 | 0.7835 | -0.1106 | |||
| GE / General Electric Company | 0.02 | 0.00 | 4.50 | -0.99 | 0.7640 | 0.0281 | |||
| OGN / Organon & Co. | 0.35 | 0.00 | 4.50 | -16.89 | 0.7635 | -0.1127 | |||
| PM / Philip Morris International Inc. | 0.03 | 0.00 | 4.43 | 31.61 | 0.7522 | 0.2072 | |||
| DUK / Duke Energy Corporation | 0.04 | 0.00 | 4.30 | 8.95 | 0.7291 | 0.0910 | |||
| SAN / Santander UK plc - Preferred Stock | 0.04 | 0.00 | 4.25 | 1.09 | 0.7215 | 0.0410 | |||
| MA / Mastercard Incorporated | 0.01 | 4.23 | 0.7168 | 0.7168 | |||||
| NFG / National Fuel Gas Company | 0.05 | 0.00 | 4.21 | 9.63 | 0.7148 | 0.0931 | |||
| LRCX / Lam Research Corporation | 0.06 | 0.00 | 4.20 | -11.56 | 0.7125 | -0.0559 | |||
| PCG.PRX / PG&E Corporation - Preferred Security | 0.10 | 0.00 | 4.20 | 2.99 | 0.7122 | 0.0527 | |||
| ARMK / Aramark | 0.12 | 23.10 | 4.15 | 5.76 | 0.7036 | 0.0692 | |||
| EOG / EOG Resources, Inc. | 0.04 | 0.00 | 4.14 | -12.31 | 0.7023 | -0.0613 | |||
| GIS / General Mills, Inc. | 0.07 | 0.00 | 4.13 | -5.65 | 0.6998 | -0.0075 | |||
| LNC / Lincoln National Corporation | 0.12 | 3.77 | 0.6401 | 0.6401 | |||||
| BA.PRA / The Boeing Company - Preferred Security | 0.06 | 0.00 | 3.68 | 2.31 | 0.6235 | 0.0424 | |||
| BATS / British American Tobacco p.l.c. | 0.08 | 0.00 | 3.66 | 9.45 | 0.6210 | 0.0800 | |||
| NEE / NextEra Energy, Inc. | 0.05 | 0.00 | 3.64 | -6.55 | 0.6173 | -0.0126 | |||
| LDOS / Leidos Holdings, Inc. | 0.02 | 0.00 | 3.63 | 3.62 | 0.6165 | 0.0492 | |||
| PEP / PepsiCo, Inc. | 0.03 | 0.00 | 3.55 | -10.04 | 0.6020 | -0.0361 | |||
| CSX / CSX Corporation | 0.13 | 0.00 | 3.53 | -14.59 | 0.5988 | -0.0699 | |||
| ZURVY / Zurich Insurance Group AG - Depositary Receipt (Common Stock) | 0.00 | 0.00 | 3.51 | 16.40 | 0.5949 | 0.1074 | |||
| NRG / NRG Energy, Inc. | 0.03 | 0.00 | 3.47 | 6.96 | 0.5892 | 0.0639 | |||
| PNC / The PNC Financial Services Group, Inc. | 0.02 | 0.00 | 3.46 | -20.04 | 0.5877 | -0.1132 | |||
| HUM / Humana Inc. | 0.01 | 3.46 | 0.5863 | 0.5863 | |||||
| JCI / Johnson Controls International plc | 0.04 | 0.00 | 3.44 | 7.56 | 0.5839 | 0.0662 | |||
| FP / TotalEnergies SE | 0.06 | 0.00 | 3.26 | -2.39 | 0.5537 | 0.0129 | |||
| TJX / The TJX Companies, Inc. | 0.03 | 0.00 | 3.26 | 3.13 | 0.5527 | 0.0416 | |||
| COP / ConocoPhillips | 0.04 | 0.00 | 3.26 | -9.83 | 0.5526 | -0.0318 | |||
| SWK / Stanley Black & Decker, Inc. | 0.05 | 0.00 | 3.24 | -31.84 | 0.5501 | -0.2197 | |||
| AVGO / Broadcom Inc. | 0.02 | 3.23 | 0.5485 | 0.5485 | |||||
| EIX / Edison International | 0.06 | 0.00 | 3.14 | -0.91 | 0.5333 | 0.0201 | |||
| TMUS / T-Mobile US, Inc. | 0.01 | 3.13 | 0.5303 | 0.5303 | |||||
| HIG / The Hartford Insurance Group, Inc. | 0.02 | 0.00 | 3.00 | 9.97 | 0.5090 | 0.0676 | |||
| ETR / Entergy Corporation | 0.04 | 2.93 | 0.4970 | 0.4970 | |||||
| EMN / Eastman Chemical Company | 0.04 | 0.00 | 2.90 | -22.72 | 0.4921 | -0.1152 | |||
| CRM / Salesforce, Inc. | 0.01 | 0.00 | 2.84 | -21.36 | 0.4822 | -0.1025 | |||
| J / Jacobs Solutions Inc. | 0.02 | 0.00 | 2.81 | -11.68 | 0.4773 | -0.0379 | |||
| XOM / Exxon Mobil Corporation | 0.03 | 0.00 | 2.69 | -1.14 | 0.4571 | 0.0162 | |||
| AGCO / AGCO Corporation | 0.03 | 0.00 | 2.39 | -18.76 | 0.4054 | -0.0705 | |||
| UNP / Union Pacific Corporation | 0.01 | 0.00 | 2.33 | -12.99 | 0.3957 | -0.0379 | |||
| TCLAF / Transcontinental Inc. | 0.16 | 2.24 | 0.3798 | 0.3798 | |||||
| IP / International Paper Company | 0.05 | 2.18 | 0.3703 | 0.3703 | |||||
| US55291X1090 / MFS Institutional Money Market Portfolio | 1.87 | -41.70 | 1.87 | -41.71 | 0.3175 | -0.2019 | |||
| PBR.A / Petróleo Brasileiro S.A. - Petrobras - Depositary Receipt (Common Stock) | 0.17 | 1.87 | 0.3174 | 0.3174 | |||||
| VFC / V.F. Corporation | 0.15 | 31.37 | 1.83 | -39.90 | 0.3110 | -0.1825 | |||
| PCG.PRX / PG&E Corporation - Preferred Security | 1.74 | 2.11 | 0.2957 | 0.0195 | |||||
| XGGB / Gerdau S.A. - Preferred Stock | 0.59 | 0.00 | 1.55 | -10.36 | 0.2629 | -0.0168 | |||
| NWL / Newell Brands Inc. | 0.30 | 0.00 | 1.44 | -52.02 | 0.2440 | -0.2409 | |||
| GLCNF / Glencore plc | 0.29 | 0.00 | 0.96 | -25.04 | 0.1620 | -0.0441 |