Statistik Asas
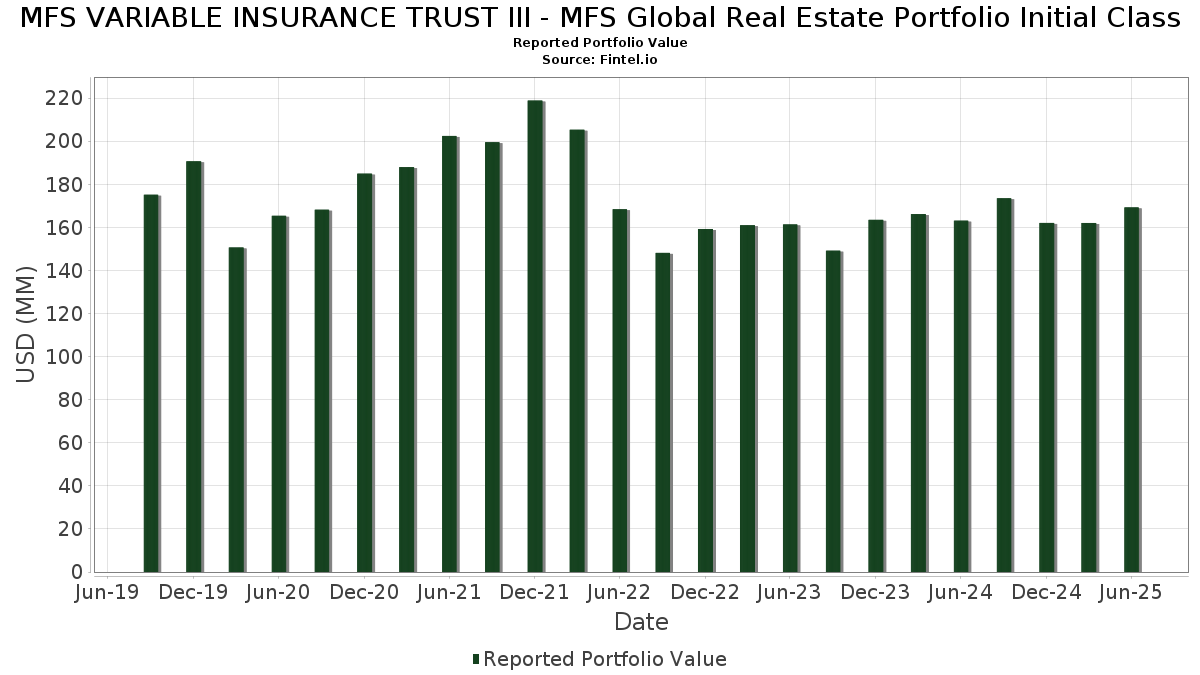
| Nilai Portfolio | $ 169,252,190 |
| Kedudukan Semasa | 50 |
Pegangan Terkini, Prestasi, AUM (dari 13F, 13D)
MFS VARIABLE INSURANCE TRUST III - MFS Global Real Estate Portfolio Initial Class telah mendedahkan 50 jumlah pegangan dalam pemfailan SEC terkini mereka. Nilai portfolio terkini dikira sebagai $ 169,252,190 USD. Aset Sebenar Di Bawah Pengurusan (AUM) ialah nilai ini ditambah dengan tunai (yang tidak didedahkan). Pegangan teratas MFS VARIABLE INSURANCE TRUST III - MFS Global Real Estate Portfolio Initial Class ialah Prologis, Inc. (US:PLD) , Equinix, Inc. (US:EQIX) , Goodman Group - Debt/Equity Composite Units (AU:GMG) , Digital Realty Trust, Inc. (US:DLR) , and Mitsui Fudosan Co., Ltd. (JP:8801) .
Kenaikan Teratas Suku Tahun Ini
Kami menggunakan perubahan dalam peruntukan portfolio kerana ini adalah metrik yang paling bermakna. Perubahan boleh disebabkan oleh perdagangan atau perubahan dalam harga saham.
| Sekuriti | Saham (MM) |
Nilai (MM$) |
Portfolio % | ΔPortfolio % |
|---|---|---|---|---|
| 0.74 | 3.97 | 2.3386 | 1.1401 | |
| 4.16 | 4.16 | 2.4455 | 1.0416 | |
| 0.03 | 3.04 | 1.7877 | 0.6398 | |
| 0.60 | 5.81 | 3.4206 | 0.6150 | |
| 0.04 | 6.78 | 3.9893 | 0.6002 | |
| 0.12 | 4.34 | 2.5517 | 0.5314 | |
| 0.32 | 7.29 | 4.2910 | 0.3248 | |
| 0.00 | 1.86 | 1.0932 | 0.3173 | |
| 0.23 | 3.66 | 2.1534 | 0.2917 | |
| 1.05 | 2.25 | 1.3217 | 0.2892 |
Penurunan Teratas Suku Tahun Ini
Kami menggunakan perubahan dalam peruntukan portfolio kerana ini adalah metrik yang paling bermakna. Perubahan boleh disebabkan oleh perdagangan atau perubahan dalam harga saham.
| Sekuriti | Saham (MM) |
Nilai (MM$) |
Portfolio % | ΔPortfolio % |
|---|---|---|---|---|
| 0.10 | 10.87 | 6.3943 | -1.7223 | |
| 0.08 | 5.27 | 3.0997 | -1.1685 | |
| 0.01 | 1.73 | 1.0158 | -1.0081 | |
| 0.01 | 1.70 | 0.9985 | -0.8615 | |
| 0.07 | 0.83 | 0.4865 | -0.5892 | |
| 0.03 | 4.18 | 2.4570 | -0.4183 | |
| 0.11 | 1.90 | 1.1182 | -0.3258 | |
| 0.02 | 4.66 | 2.7396 | -0.3235 | |
| 1.05 | 1.75 | 1.0269 | -0.3208 | |
| 0.12 | 3.04 | 1.7862 | -0.3180 |
13F dan Pemfailan Dana
Borang ini telah difailkan pada 2025-08-25 untuk tempoh pelaporan 2025-06-30. Klik ikon pautan untuk melihat sejarah transaksi penuh.
Tingkatkan untuk membuka data premium dan eksport ke Excel ![]() .
.
| Sekuriti | Jenis | Purata Harga Saham | Saham (MM) |
ΔSaham (%) |
ΔSaham (%) |
Nilai ($MM) |
Portfolio (%) |
ΔPortfolio (%) |
|
|---|---|---|---|---|---|---|---|---|---|
| PLD / Prologis, Inc. | 0.10 | -12.37 | 10.87 | -17.59 | 6.3943 | -1.7223 | |||
| EQIX / Equinix, Inc. | 0.01 | 1.20 | 8.15 | -1.26 | 4.7976 | -0.2848 | |||
| GMG / Goodman Group - Debt/Equity Composite Units | 0.32 | -9.69 | 7.29 | 13.16 | 4.2910 | 0.3248 | |||
| DLR / Digital Realty Trust, Inc. | 0.04 | 1.20 | 6.78 | 23.12 | 3.9893 | 0.6002 | |||
| 8801 / Mitsui Fudosan Co., Ltd. | 0.60 | 17.53 | 5.81 | 27.53 | 3.4206 | 0.6150 | |||
| VTR / Ventas, Inc. | 0.08 | -17.29 | 5.27 | -24.04 | 3.0997 | -1.1685 | |||
| EXR / Extra Space Storage Inc. | 0.04 | 1.20 | 5.23 | 0.48 | 3.0752 | -0.1260 | |||
| SPG / Simon Property Group, Inc. | 0.03 | 1.20 | 4.95 | -2.04 | 2.9123 | -0.1974 | |||
| ESS / Essex Property Trust, Inc. | 0.02 | 1.20 | 4.66 | -6.45 | 2.7396 | -0.3235 | |||
| KIM / Kimco Realty Corporation | 0.21 | 1.20 | 4.39 | 0.16 | 2.5815 | -0.1146 | |||
| VNA / Vonovia SE | 0.12 | 1.20 | 4.34 | 32.11 | 2.5517 | 0.5314 | |||
| MAA / Mid-America Apartment Communities, Inc. | 0.03 | 1.20 | 4.18 | -10.62 | 2.4570 | -0.4183 | |||
| US55291X1090 / MFS Institutional Money Market Portfolio | 4.16 | 82.20 | 4.16 | 82.20 | 2.4455 | 1.0416 | |||
| 823 / Link Real Estate Investment Trust | 0.74 | 79.64 | 3.97 | 104.11 | 2.3386 | 1.1401 | |||
| SUI / Sun Communities, Inc. | 0.03 | 1.20 | 3.86 | -0.49 | 2.2689 | -0.1161 | |||
| AMH / American Homes 4 Rent | 0.11 | 1.20 | 3.83 | -3.46 | 2.2508 | -0.1878 | |||
| ELS / Equity LifeStyle Properties, Inc. | 0.06 | 1.20 | 3.79 | -6.42 | 2.2283 | -0.2627 | |||
| FRT / Federal Realty Investment Trust | 0.04 | 1.20 | 3.71 | -1.72 | 2.1851 | -0.1407 | |||
| HR / Healthcare Realty Trust Incorporated | 0.23 | 28.92 | 3.66 | 21.00 | 2.1534 | 0.2917 | |||
| REXR / Rexford Industrial Realty, Inc. | 0.10 | 1.20 | 3.60 | -8.05 | 2.1165 | -0.2913 | |||
| SHUR / Shurgard Self Storage SA | 0.08 | 1.20 | 3.37 | 21.70 | 1.9833 | 0.2789 | |||
| NNN / NNN REIT, Inc. | 0.08 | 1.20 | 3.29 | 2.46 | 1.9364 | -0.0405 | |||
| BXP / Boston Properties, Inc. | 0.05 | 1.20 | 3.17 | 1.60 | 1.8640 | -0.0546 | |||
| CLNX / Cellnex Telecom, S.A. | 0.08 | 1.20 | 3.16 | 10.64 | 1.8610 | 0.1017 | |||
| HIW / Highwoods Properties, Inc. | 0.10 | 1.20 | 3.16 | 6.15 | 1.8593 | 0.0272 | |||
| URW / Unibail-Rodamco-Westfield SE | 0.03 | 43.57 | 3.04 | 62.90 | 1.7877 | 0.6398 | |||
| WY / Weyerhaeuser Company | 0.12 | 1.20 | 3.04 | -11.21 | 1.7862 | -0.3180 | |||
| SCG / Scentre Group | 1.28 | 1.20 | 2.99 | 12.96 | 1.7590 | 0.1299 | |||
| CAR.UN / Canadian Apartment Properties Real Estate Investment Trust | 0.09 | 1.20 | 2.95 | 10.10 | 1.7382 | 0.0867 | |||
| 1U4 / Grainger plc | 0.89 | 1.20 | 2.69 | 16.26 | 1.5817 | 0.1586 | |||
| SGRO / SEGRO Plc | 0.29 | 1.20 | 2.67 | 5.79 | 1.5700 | 0.0177 | |||
| EN / Bouygues SA | 0.19 | 1.20 | 2.62 | 16.47 | 1.5439 | 0.1573 | |||
| LAMR / Lamar Advertising Company | 0.02 | 1.20 | 2.59 | 7.95 | 1.5258 | 0.0473 | |||
| 8953 / Japan Metropolitan Fund Investment Corporation | 0.00 | 16.05 | 2.34 | 28.64 | 1.3774 | 0.2578 | |||
| RHP / Ryman Hospitality Properties, Inc. | 0.02 | 1.20 | 2.30 | 9.21 | 1.3540 | 0.0570 | |||
| SHC / Shaftesbury Capital PLC | 1.05 | 1.20 | 2.25 | 33.93 | 1.3217 | 0.2892 | |||
| CHC / Charter Hall Group - Debt/Equity Composite Units | 0.17 | 1.20 | 2.16 | 25.48 | 1.2693 | 0.2111 | |||
| DLN / De'Longhi S.p.A. | 0.07 | 1.20 | 2.01 | 20.76 | 1.1845 | 0.1580 | |||
| COLD / Americold Realty Trust, Inc. | 0.11 | 4.52 | 1.90 | -19.01 | 1.1182 | -0.3258 | |||
| 8972 / KDX Realty Investment Corporation | 0.00 | 33.80 | 1.86 | 47.38 | 1.0932 | 0.3173 | |||
| 8HT / Helios Towers plc | 1.05 | -34.25 | 1.75 | -20.28 | 1.0269 | -0.3208 | |||
| AMT / American Tower Corporation | 0.01 | -48.31 | 1.73 | -47.51 | 1.0158 | -1.0081 | |||
| NSR / National Storage REIT | 1.14 | 1.20 | 1.72 | 9.82 | 1.0136 | 0.0482 | |||
| SBAC / SBA Communications Corporation | 0.01 | -47.39 | 1.70 | -43.88 | 0.9985 | -0.8615 | |||
| SHO / Sunstone Hotel Investors, Inc. | 0.19 | 52.09 | 1.66 | 40.30 | 0.9753 | 0.2481 | |||
| 3P51 / Parkway Life Real Estate Investment Trust | 0.36 | 1.20 | 1.17 | 5.72 | 0.6859 | 0.0075 | |||
| DEI / Douglas Emmett, Inc. | 0.08 | 1.20 | 1.14 | -4.91 | 0.6724 | -0.0669 | |||
| 3468 / Star Asia Investment Corporation | 0.00 | 1.21 | 1.00 | 11.52 | 0.5871 | 0.0368 | |||
| UTG / Unite Group PLC | 0.07 | -51.21 | 0.83 | -54.06 | 0.4865 | -0.5892 | |||
| DBRG / DigitalBridge Group, Inc. | 0.05 | 1.20 | 0.54 | 18.81 | 0.3160 | 0.0377 |