Statistik Asas
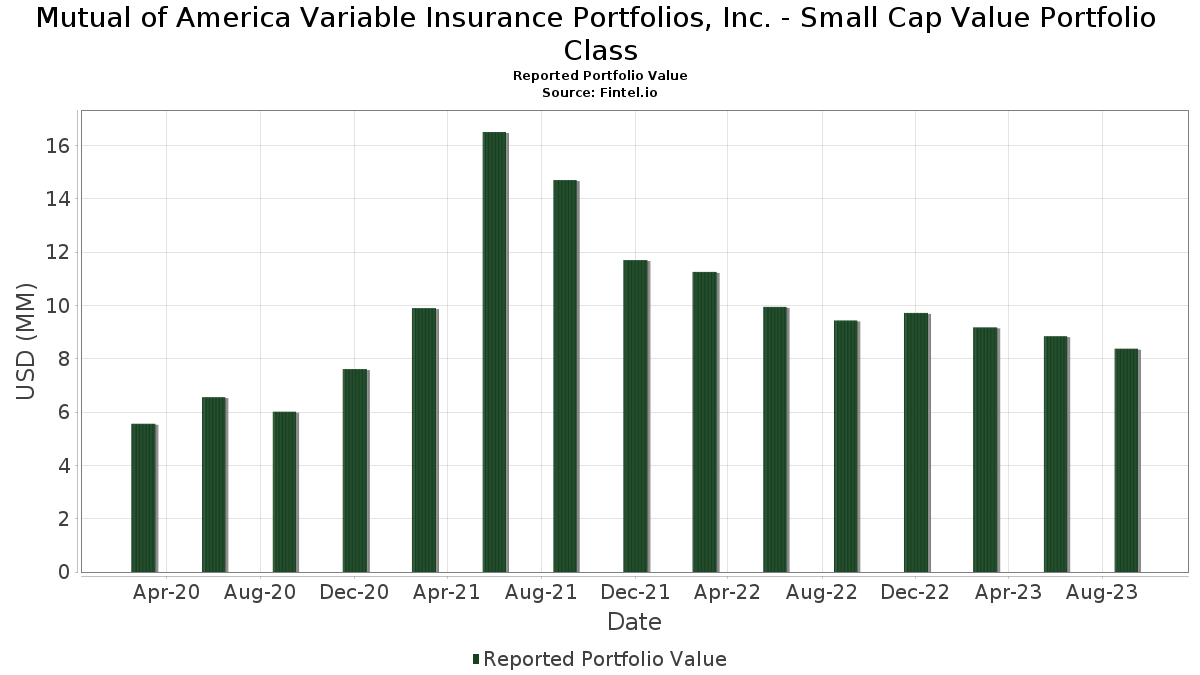
| Nilai Portfolio | $ 8,373,835 |
| Kedudukan Semasa | 83 |
Pegangan Terkini, Prestasi, AUM (dari 13F, 13D)
Mutual of America Variable Insurance Portfolios, Inc. - Small Cap Value Portfolio Class telah mendedahkan 83 jumlah pegangan dalam pemfailan SEC terkini mereka. Nilai portfolio terkini dikira sebagai $ 8,373,835 USD. Aset Sebenar Di Bawah Pengurusan (AUM) ialah nilai ini ditambah dengan tunai (yang tidak didedahkan). Pegangan teratas Mutual of America Variable Insurance Portfolios, Inc. - Small Cap Value Portfolio Class ialah Mueller Industries, Inc. (US:MLI) , ChampionX Corporation (US:CHX) , TreeHouse Foods, Inc. (US:THS) , Miller Industries, Inc. (US:MLR) , and UFP Industries, Inc. (US:UFPI) . Kedudukan baharu Mutual of America Variable Insurance Portfolios, Inc. - Small Cap Value Portfolio Class termasuk Murphy Oil Corporation (US:MUR) , .
Kenaikan Teratas Suku Tahun Ini
Kami menggunakan perubahan dalam peruntukan portfolio kerana ini adalah metrik yang paling bermakna. Perubahan boleh disebabkan oleh perdagangan atau perubahan dalam harga saham.
| Sekuriti | Saham (MM) |
Nilai (MM$) |
Portfolio % | ΔPortfolio % |
|---|---|---|---|---|
| 0.01 | 0.31 | 3.5680 | 0.7768 | |
| 0.01 | 0.16 | 1.8705 | 0.6647 | |
| 0.01 | 0.25 | 2.8706 | 0.5395 | |
| 0.00 | 0.11 | 1.3050 | 0.5057 | |
| 0.00 | 0.15 | 1.7710 | 0.4984 | |
| 0.01 | 0.09 | 0.9811 | 0.4870 | |
| 0.00 | 0.20 | 2.2779 | 0.3763 | |
| 0.01 | 0.11 | 1.2185 | 0.2949 | |
| 0.00 | 0.23 | 2.6456 | 0.2808 | |
| 0.01 | 0.14 | 1.6365 | 0.2770 |
Penurunan Teratas Suku Tahun Ini
Kami menggunakan perubahan dalam peruntukan portfolio kerana ini adalah metrik yang paling bermakna. Perubahan boleh disebabkan oleh perdagangan atau perubahan dalam harga saham.
| Sekuriti | Saham (MM) |
Nilai (MM$) |
Portfolio % | ΔPortfolio % |
|---|---|---|---|---|
| 0.00 | 0.00 | -2.3757 | ||
| 0.00 | 0.05 | 0.6231 | -0.4148 | |
| 0.00 | 0.34 | 3.8586 | -0.3674 | |
| 0.00 | 0.04 | 0.4381 | -0.1358 | |
| 0.00 | 0.05 | 0.6052 | -0.1333 | |
| 0.00 | 0.12 | 1.3737 | -0.1307 | |
| 0.00 | 0.04 | 0.4620 | -0.1205 | |
| 0.00 | 0.04 | 0.4278 | -0.1169 | |
| 0.01 | 0.26 | 3.0054 | -0.1136 | |
| 0.00 | 0.02 | 0.1981 | -0.1111 |
13F dan Pemfailan Dana
Borang ini telah difailkan pada 2023-11-16 untuk tempoh pelaporan 2023-09-30. Klik ikon pautan untuk melihat sejarah transaksi penuh.
Tingkatkan untuk membuka data premium dan eksport ke Excel ![]() .
.
| Sekuriti | Jenis | Purata Harga Saham | Saham (MM) |
ΔSaham (%) |
ΔSaham (%) |
Nilai ($MM) |
Portfolio (%) |
ΔPortfolio (%) |
|
|---|---|---|---|---|---|---|---|---|---|
| MLI / Mueller Industries, Inc. | 0.00 | 0.00 | 0.34 | -14.07 | 3.8586 | -0.3674 | |||
| CHX / ChampionX Corporation | 0.01 | 5.06 | 0.31 | 20.54 | 3.5680 | 0.7768 | |||
| THS / TreeHouse Foods, Inc. | 0.01 | 5.06 | 0.26 | -9.03 | 3.0054 | -0.1136 | |||
| MLR / Miller Industries, Inc. | 0.01 | 5.06 | 0.25 | 16.28 | 2.8706 | 0.5395 | |||
| UFPI / UFP Industries, Inc. | 0.00 | 0.00 | 0.23 | 5.96 | 2.6456 | 0.2808 | |||
| NPO / Enpro Inc. | 0.00 | 0.00 | 0.23 | -9.16 | 2.6133 | -0.1023 | |||
| VSEC / VSE Corporation | 0.00 | 5.06 | 0.21 | -3.17 | 2.4607 | 0.0655 | |||
| TMHC / Taylor Morrison Home Corporation | 0.00 | 5.06 | 0.21 | -8.23 | 2.4315 | -0.0668 | |||
| SIGI / Selective Insurance Group, Inc. | 0.00 | 5.07 | 0.20 | 12.50 | 2.2779 | 0.3763 | |||
| BLMN / Bloomin' Brands, Inc. | 0.01 | 5.05 | 0.18 | -3.76 | 2.0568 | 0.0375 | |||
| TGNA / TEGNA Inc. | 0.01 | 5.06 | 0.18 | -5.79 | 2.0551 | -0.0013 | |||
| EQT / EQT Corporation | 0.00 | 5.05 | 0.17 | 3.57 | 2.0011 | 0.1802 | |||
| ESNT / Essent Group Ltd. | 0.00 | 5.05 | 0.17 | 6.17 | 1.9707 | 0.2198 | |||
| ACA / Arcosa, Inc. | 0.00 | 5.04 | 0.17 | -0.60 | 1.9210 | 0.1034 | |||
| NXGN / NextGen Healthcare Inc | 0.01 | 0.00 | 0.16 | 46.85 | 1.8705 | 0.6647 | |||
| OVV / Ovintiv Inc. | 0.00 | 5.04 | 0.15 | 31.62 | 1.7710 | 0.4984 | |||
| KALU / Kaiser Aluminum Corporation | 0.00 | 5.07 | 0.15 | 10.79 | 1.7686 | 0.2574 | |||
| EBC / Eastern Bankshares, Inc. | 0.01 | 5.05 | 0.15 | 6.99 | 1.7612 | 0.2141 | |||
| PCH / PotlatchDeltic Corporation | 0.00 | 5.04 | 0.14 | -10.00 | 1.6561 | -0.0752 | |||
| DLX / Deluxe Corporation | 0.01 | 5.05 | 0.14 | 13.60 | 1.6365 | 0.2770 | |||
| SAH / Sonic Automotive, Inc. | 0.00 | 5.07 | 0.14 | 5.34 | 1.5878 | 0.1652 | |||
| HWC / Hancock Whitney Corporation | 0.00 | 5.06 | 0.13 | 1.53 | 1.5305 | 0.1049 | |||
| SUPN / Supernus Pharmaceuticals, Inc. | 0.00 | 5.04 | 0.13 | -3.03 | 1.4662 | 0.0309 | |||
| HOMB / Home Bancshares, Inc. (Conway, AR) | 0.01 | 5.06 | 0.13 | -3.10 | 1.4338 | 0.0324 | |||
| ICFI / ICF International, Inc. | 0.00 | 5.07 | 0.13 | 2.46 | 1.4333 | 0.1086 | |||
| FIBK / First Interstate BancSystem, Inc. | 0.00 | 5.05 | 0.12 | 9.09 | 1.3846 | 0.1963 | |||
| VAC / Marriott Vacations Worldwide Corporation | 0.00 | 5.02 | 0.12 | -14.39 | 1.3737 | -0.1307 | |||
| BANR / Banner Corporation | 0.00 | 5.06 | 0.12 | 1.74 | 1.3502 | 0.1012 | |||
| EFSC / Enterprise Financial Services Corp | 0.00 | 5.05 | 0.12 | 0.86 | 1.3403 | 0.0856 | |||
| AEL / American Equity Investment Life Holding Company | 0.00 | 5.07 | 0.12 | 8.41 | 1.3367 | 0.1711 | |||
| CPRI / Capri Holdings Limited | 0.00 | 5.04 | 0.11 | 52.70 | 1.3050 | 0.5057 | |||
| SBRA / Sabra Health Care REIT, Inc. | 0.01 | 5.05 | 0.11 | 24.71 | 1.2185 | 0.2949 | |||
| EFC / Ellington Financial Inc. | 0.01 | 5.06 | 0.10 | -4.59 | 1.1954 | 0.0078 | |||
| BKH / Black Hills Corporation | 0.00 | 5.08 | 0.10 | -11.97 | 1.1871 | -0.0821 | |||
| WERN / Werner Enterprises, Inc. | 0.00 | 5.04 | 0.10 | -7.34 | 1.1611 | -0.0214 | |||
| ADEA / Adeia Inc. | 0.01 | 27.75 | 0.10 | 24.36 | 1.1209 | 0.2678 | |||
| UMBF / UMB Financial Corporation | 0.00 | 5.08 | 0.09 | 6.98 | 1.0588 | 0.1261 | |||
| MTRN / Materion Corporation | 0.00 | 0.00 | 0.09 | -10.89 | 1.0375 | -0.0590 | |||
| DOC / Healthpeak Properties, Inc. | 0.01 | 114.92 | 0.09 | 88.89 | 0.9811 | 0.4870 | |||
| KBR / KBR, Inc. | 0.00 | 0.00 | 0.08 | -8.70 | 0.9632 | -0.0395 | |||
| WIRE / Encore Wire Corporation | 0.00 | 0.00 | 0.08 | -1.20 | 0.9424 | 0.0367 | |||
| BRKL / Brookline Bancorp, Inc. | 0.01 | 5.06 | 0.08 | 9.46 | 0.9361 | 0.1299 | |||
| POR / Portland General Electric Company | 0.00 | 5.04 | 0.08 | -9.09 | 0.9174 | -0.0355 | |||
| CWGL / Crimson Wine Group, Ltd. | 0.01 | 0.28 | 0.08 | -9.30 | 0.8955 | -0.0441 | |||
| SYBT / Stock Yards Bancorp, Inc. | 0.00 | 5.07 | 0.08 | -8.24 | 0.8949 | -0.0327 | |||
| GDEN / Golden Entertainment, Inc. | 0.00 | 5.06 | 0.08 | -14.61 | 0.8776 | -0.0858 | |||
| NWE / NorthWestern Energy Group, Inc. | 0.00 | 5.08 | 0.07 | -10.84 | 0.8531 | -0.0511 | |||
| EQC / Equity Commonwealth | 0.00 | 5.06 | 0.07 | -3.90 | 0.8476 | 0.0084 | |||
| AVA / Avista Corporation | 0.00 | 5.06 | 0.07 | -13.25 | 0.8311 | -0.0740 | |||
| TCBK / TriCo Bancshares | 0.00 | 5.04 | 0.07 | 1.54 | 0.7567 | 0.0525 | |||
| AVNT / Avient Corporation | 0.00 | 5.03 | 0.07 | -9.72 | 0.7511 | -0.0299 | |||
| SR / Spire Inc. | 0.00 | 5.01 | 0.06 | -7.46 | 0.7192 | -0.0050 | |||
| DEA / Easterly Government Properties, Inc. | 0.01 | 5.05 | 0.06 | -17.33 | 0.7190 | -0.0999 | |||
| LXP / LXP Industrial Trust | 0.01 | 5.06 | 0.06 | -4.76 | 0.6982 | 0.0116 | |||
| MC / Moelis & Company | 0.00 | 5.07 | 0.06 | 3.57 | 0.6750 | 0.0663 | |||
| VCEL / Vericel Corporation | 0.00 | 5.07 | 0.06 | -6.56 | 0.6603 | -0.0040 | |||
| AIV / Apartment Investment and Management Company | 0.01 | 5.05 | 0.06 | -15.38 | 0.6328 | -0.0790 | |||
| CUZ / Cousins Properties Incorporated | 0.00 | 5.06 | 0.05 | -6.90 | 0.6242 | -0.0030 | |||
| GDOT / Green Dot Corporation | 0.00 | -23.83 | 0.05 | -43.75 | 0.6231 | -0.4148 | |||
| VSAT / Viasat, Inc. | 0.00 | 82.39 | 0.05 | -18.46 | 0.6131 | -0.0955 | |||
| SF / Stifel Financial Corp. | 0.00 | 5.09 | 0.05 | 8.16 | 0.6100 | 0.0783 | |||
| SATS / EchoStar Corporation | 0.00 | -19.98 | 0.05 | -23.53 | 0.6052 | -0.1333 | |||
| ARGO / Argo Group International Holdings, Inc. | 0.00 | 5.03 | 0.05 | 6.12 | 0.5990 | 0.0653 | |||
| HIW / Highwoods Properties, Inc. | 0.00 | 5.05 | 0.04 | -10.42 | 0.5006 | -0.0208 | |||
| DCO / Ducommun Incorporated | 0.00 | 5.11 | 0.04 | 5.00 | 0.4818 | 0.0489 | |||
| DCOM / Dime Community Bancshares, Inc. | 0.00 | 5.04 | 0.04 | 20.00 | 0.4812 | 0.0996 | |||
| OFIX / Orthofix Medical Inc. | 0.00 | 5.06 | 0.04 | -24.53 | 0.4620 | -0.1205 | |||
| ZUO / Zuora, Inc. | 0.00 | 5.06 | 0.04 | -20.41 | 0.4505 | -0.0879 | |||
| TTMI / TTM Technologies, Inc. | 0.00 | 5.05 | 0.04 | -2.56 | 0.4387 | 0.0137 | |||
| DGII / Digi International Inc. | 0.00 | 5.04 | 0.04 | -28.30 | 0.4381 | -0.1358 | |||
| MXL / MaxLinear, Inc. | 0.00 | 5.07 | 0.04 | -26.00 | 0.4278 | -0.1169 | |||
| CTO / CTO Realty Growth, Inc. | 0.00 | 5.04 | 0.04 | 0.00 | 0.4062 | 0.0206 | |||
| XPER / Xperi Inc. | 0.00 | 24.82 | 0.04 | -5.41 | 0.4044 | -0.0031 | |||
| KRYS / Krystal Biotech, Inc. | 0.00 | 4.96 | 0.03 | 3.03 | 0.3932 | 0.0356 | |||
| COHU / Cohu, Inc. | 0.00 | 5.08 | 0.03 | -13.51 | 0.3755 | -0.0312 | |||
| BCRX / BioCryst Pharmaceuticals, Inc. | 0.00 | 5.06 | 0.03 | 6.67 | 0.3700 | 0.0397 | |||
| BMRC / Bank of Marin Bancorp | 0.00 | 5.07 | 0.03 | 12.00 | 0.3211 | 0.0425 | |||
| ALX / Alexander's, Inc. | 0.00 | 5.17 | 0.02 | 4.76 | 0.2546 | 0.0242 | |||
| MUR / Murphy Oil Corporation | 0.00 | 0.02 | 0.2545 | 0.2545 | |||||
| RNA / Avidity Biosciences, Inc. | 0.00 | 5.04 | 0.02 | -39.29 | 0.1981 | -0.1111 | |||
| HASI / HA Sustainable Infrastructure Capital, Inc. | 0.00 | 5.03 | 0.02 | -11.11 | 0.1925 | -0.0113 | |||
| HRTX / Heron Therapeutics, Inc. | 0.00 | 5.04 | 0.00 | -20.00 | 0.0543 | -0.0006 | |||
| NSTG / NanoString Technologies, Inc. | 0.00 | 0.00 | 0.00 | -62.50 | 0.0430 | -0.0525 | |||
| PDCE / PDC Energy Inc | 0.00 | -100.00 | 0.00 | -100.00 | -2.3757 | ||||
| SQNS / Sequans Communications S.A. - Depositary Receipt (Common Stock) | 0.00 | -100.00 | 0.00 | -100.00 | -0.0682 |