Statistik Asas
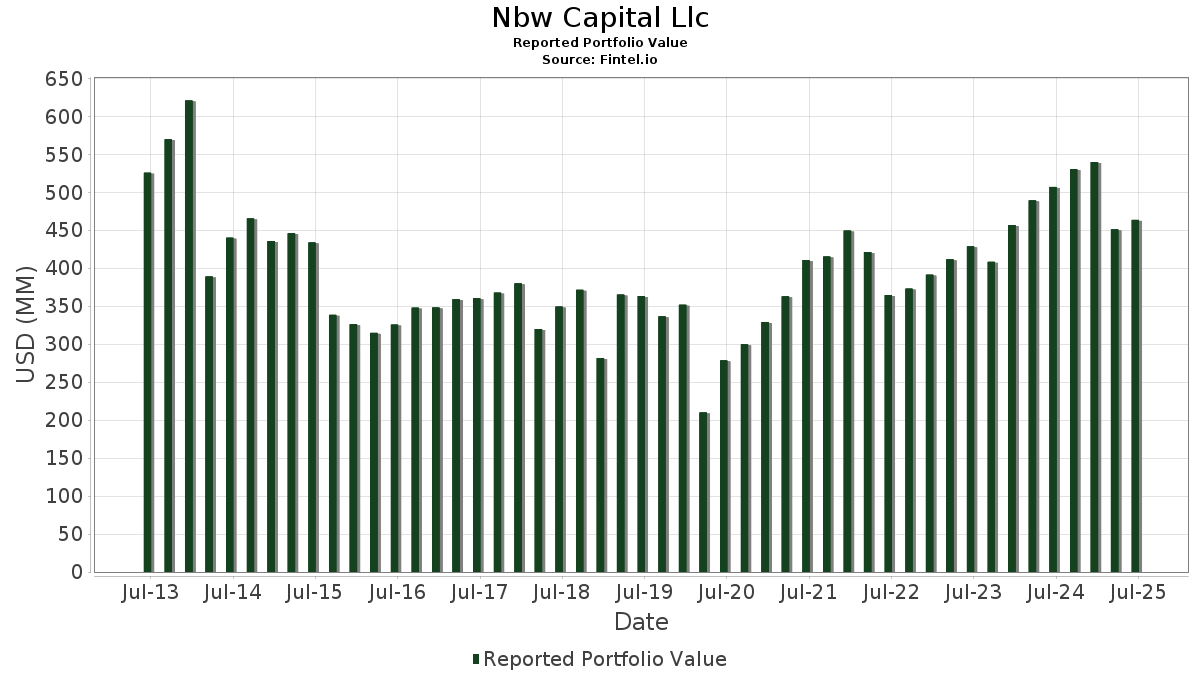
| Nilai Portfolio | $ 463,554,136 |
| Kedudukan Semasa | 111 |
Pegangan Terkini, Prestasi, AUM (dari 13F, 13D)
Nbw Capital Llc telah mendedahkan 111 jumlah pegangan dalam pemfailan SEC terkini mereka. Nilai portfolio terkini dikira sebagai $ 463,554,136 USD. Aset Sebenar Di Bawah Pengurusan (AUM) ialah nilai ini ditambah dengan tunai (yang tidak didedahkan). Pegangan teratas Nbw Capital Llc ialah Microsoft Corporation (US:MSFT) , Cheniere Energy, Inc. (US:LNG) , Alphabet Inc. (US:GOOGL) , Energy Transfer LP - Limited Partnership (US:ET) , and Apple Inc. (US:AAPL) . Kedudukan baharu Nbw Capital Llc termasuk Exact Sciences Corporation (US:EXAS) , Vanguard Index Funds - Vanguard Total Stock Market ETF (US:VTI) , Invesco Exchange-Traded Fund Trust - Invesco S&P 500 Equal Weight ETF (US:RSP) , ALPS ETF Trust - Alerian MLP ETF (US:AMLP) , and American Electric Power Company, Inc. (US:AEP) .
Kenaikan Teratas Suku Tahun Ini
Kami menggunakan perubahan dalam peruntukan portfolio kerana ini adalah metrik yang paling bermakna. Perubahan boleh disebabkan oleh perdagangan atau perubahan dalam harga saham.
| Sekuriti | Saham (MM) |
Nilai (MM$) |
Portfolio % | ΔPortfolio % |
|---|---|---|---|---|
| 0.04 | 18.27 | 3.9418 | 0.8595 | |
| 0.07 | 3.53 | 0.7606 | 0.7606 | |
| 0.03 | 8.48 | 1.8304 | 0.6957 | |
| 0.07 | 6.35 | 1.3700 | 0.5119 | |
| 0.10 | 16.79 | 3.6225 | 0.5096 | |
| 0.04 | 11.56 | 2.4943 | 0.3370 | |
| 0.03 | 5.68 | 1.2264 | 0.3155 | |
| 0.04 | 8.75 | 1.8884 | 0.2844 | |
| 0.09 | 7.14 | 1.5410 | 0.2707 | |
| 0.03 | 4.32 | 0.9319 | 0.2514 |
Penurunan Teratas Suku Tahun Ini
Kami menggunakan perubahan dalam peruntukan portfolio kerana ini adalah metrik yang paling bermakna. Perubahan boleh disebabkan oleh perdagangan atau perubahan dalam harga saham.
| Sekuriti | Saham (MM) |
Nilai (MM$) |
Portfolio % | ΔPortfolio % |
|---|---|---|---|---|
| 0.15 | 3.59 | 0.7750 | -0.6445 | |
| 0.04 | 4.33 | 0.9332 | -0.5802 | |
| 0.16 | 3.04 | 0.6552 | -0.5539 | |
| 0.62 | 11.43 | 2.4664 | -0.4409 | |
| 0.07 | 13.99 | 3.0179 | -0.3501 | |
| 0.01 | 2.11 | 0.4550 | -0.3344 | |
| 0.43 | 13.40 | 2.8906 | -0.2954 | |
| 0.25 | 12.87 | 2.7762 | -0.2906 | |
| 0.04 | 12.29 | 2.6505 | -0.2866 | |
| 0.24 | 4.66 | 1.0061 | -0.2394 |
13F dan Pemfailan Dana
Borang ini telah difailkan pada 2025-08-13 untuk tempoh pelaporan 2025-06-30. Klik ikon pautan untuk melihat sejarah transaksi penuh.
Tingkatkan untuk membuka data premium dan eksport ke Excel ![]() .
.
| Sekuriti | Jenis | Purata Harga Saham | Saham (MM) |
ΔSaham (%) |
ΔSaham (%) |
Nilai ($MM) |
Portfolio (%) |
ΔPortfolio (%) |
|
|---|---|---|---|---|---|---|---|---|---|
| MSFT / Microsoft Corporation | 0.04 | -0.80 | 18.27 | 31.45 | 3.9418 | 0.8595 | |||
| LNG / Cheniere Energy, Inc. | 0.07 | -5.57 | 17.74 | -0.62 | 3.8275 | -0.1311 | |||
| GOOGL / Alphabet Inc. | 0.10 | 4.96 | 16.79 | 19.61 | 3.6225 | 0.5096 | |||
| JPMORGAN CHASE FINL CO LLC / CAL LKD 44 (48133Q309) | 0.52 | 15.86 | 0.0000 | ||||||
| ET / Energy Transfer LP - Limited Partnership | 0.86 | 0.62 | 15.59 | -1.87 | 3.3639 | -0.1594 | |||
| AAPL / Apple Inc. | 0.07 | -0.29 | 13.99 | -7.90 | 3.0179 | -0.3501 | |||
| EPD / Enterprise Products Partners L.P. - Limited Partnership | 0.43 | 2.67 | 13.40 | -6.74 | 2.8906 | -0.2954 | |||
| MPLX / MPLX LP - Limited Partnership | 0.25 | -3.33 | 12.87 | -6.96 | 2.7762 | -0.2906 | |||
| MCD / McDonald's Corporation | 0.04 | -0.83 | 12.29 | -7.25 | 2.6505 | -0.2866 | |||
| WES / Western Midstream Partners, LP - Limited Partnership | 0.31 | -0.35 | 12.04 | -5.84 | 2.5974 | -0.2380 | |||
| JPM / JPMorgan Chase & Co. | 0.04 | 0.55 | 11.56 | 18.84 | 2.4943 | 0.3370 | |||
| PAA / Plains All American Pipeline, L.P. - Limited Partnership | 0.62 | -4.81 | 11.43 | -12.81 | 2.4664 | -0.4409 | |||
| SPY / SPDR S&P 500 ETF | 0.02 | -1.76 | 11.11 | 8.50 | 2.3974 | 0.1265 | |||
| PLMR / Palomar Holdings, Inc. | 0.07 | -1.61 | 10.59 | 10.72 | 2.2846 | 0.1636 | |||
| PANW / Palo Alto Networks, Inc. | 0.04 | 0.90 | 8.75 | 21.00 | 1.8884 | 0.2844 | |||
| ADI / Analog Devices, Inc. | 0.04 | -0.88 | 8.58 | 16.99 | 1.8511 | 0.2247 | |||
| AVGO / Broadcom Inc. | 0.03 | 0.71 | 8.48 | 65.80 | 1.8304 | 0.6957 | |||
| PATK / Patrick Industries, Inc. | 0.08 | -0.97 | 7.58 | 8.05 | 1.6355 | 0.0799 | |||
| TYL / Tyler Technologies, Inc. | 0.01 | 13.64 | 7.43 | 15.87 | 1.6036 | 0.1812 | |||
| ROP / Roper Technologies, Inc. | 0.01 | 1.07 | 7.22 | -2.82 | 1.5585 | -0.0900 | |||
| MRVL / Marvell Technology, Inc. | 0.09 | -0.82 | 7.14 | 24.68 | 1.5410 | 0.2707 | |||
| VRTX / Vertex Pharmaceuticals Incorporated | 0.02 | 1.87 | 7.10 | -6.45 | 1.5308 | -0.1511 | |||
| ITW / Illinois Tool Works Inc. | 0.03 | -0.59 | 6.85 | -0.90 | 1.4770 | -0.0547 | |||
| GTLS / Chart Industries, Inc. | 0.04 | -0.84 | 6.57 | 13.10 | 1.4180 | 0.1293 | |||
| WFC / Wells Fargo & Company | 0.08 | -0.92 | 6.36 | 10.58 | 1.3712 | 0.0967 | |||
| ATI / ATI Inc. | 0.07 | -1.11 | 6.35 | 64.08 | 1.3700 | 0.5119 | |||
| PGR / The Progressive Corporation | 0.02 | 0.04 | 6.29 | -5.68 | 1.3571 | -0.1216 | |||
| IWO / iShares Trust - iShares Russell 2000 Growth ETF | 0.02 | -1.98 | 6.26 | 9.66 | 1.3494 | 0.0845 | |||
| BSX / Boston Scientific Corporation | 0.05 | 3.25 | 5.79 | 9.93 | 1.2488 | 0.0812 | |||
| AMT / American Tower Corporation | 0.03 | 36.24 | 5.68 | 38.36 | 1.2264 | 0.3155 | |||
| ABBV / AbbVie Inc. | 0.03 | 0.88 | 5.68 | -10.63 | 1.2259 | -0.1839 | |||
| HQY / HealthEquity, Inc. | 0.05 | 2.94 | 5.61 | 22.03 | 1.2094 | 0.1908 | |||
| STE / STERIS plc | 0.02 | 7.82 | 5.59 | 14.28 | 1.2051 | 0.1212 | |||
| DSGX / The Descartes Systems Group Inc. | 0.05 | 0.73 | 5.58 | 1.55 | 1.2038 | -0.0146 | |||
| HASI / HA Sustainable Infrastructure Capital, Inc. | 0.20 | 10.73 | 5.43 | 1.72 | 1.1706 | -0.0123 | |||
| PHM / PulteGroup, Inc. | 0.05 | 19.79 | 5.23 | 22.90 | 1.1289 | 0.1847 | |||
| AROC / Archrock, Inc. | 0.21 | -2.91 | 5.21 | -8.13 | 1.1232 | -0.1334 | |||
| CYBR / CyberArk Software Ltd. | 0.01 | 0.79 | 4.67 | 21.35 | 1.0069 | 0.1539 | |||
| PAGP / Plains GP Holdings, L.P. - Limited Partnership | 0.24 | -8.73 | 4.66 | -16.98 | 1.0061 | -0.2394 | |||
| EA / Electronic Arts Inc. | 0.03 | 3.78 | 4.52 | 14.67 | 0.9745 | 0.1011 | |||
| ORLY / O'Reilly Automotive, Inc. | 0.05 | 1,434.16 | 4.40 | -3.49 | 0.9483 | -0.0615 | |||
| BJ / BJ's Wholesale Club Holdings, Inc. | 0.04 | -32.93 | 4.33 | -36.62 | 0.9332 | -0.5802 | |||
| BPMC / Blueprint Medicines Corporation | 0.03 | -2.81 | 4.32 | 40.76 | 0.9319 | 0.2514 | |||
| GLP / Global Partners LP - Limited Partnership | 0.08 | 1.50 | 4.21 | 0.26 | 0.9077 | -0.0228 | |||
| V / Visa Inc. | 0.01 | 1.74 | 4.14 | 3.06 | 0.8931 | 0.0025 | |||
| RJF / Raymond James Financial, Inc. | 0.03 | 0.85 | 4.11 | 11.35 | 0.8867 | 0.0682 | |||
| SUN / Sunoco LP - Limited Partnership | 0.08 | 1.92 | 4.07 | -5.91 | 0.8787 | -0.0814 | |||
| MDY / SPDR S&P MidCap 400 ETF Trust | 0.01 | 1.75 | 4.01 | 8.05 | 0.8656 | 0.0422 | |||
| DKNG / DraftKings Inc. | 0.09 | -1.31 | 3.92 | 27.47 | 0.8449 | 0.1635 | |||
| MA / Mastercard Incorporated | 0.01 | 1.63 | 3.86 | 4.21 | 0.8329 | 0.0112 | |||
| CDNS / Cadence Design Systems, Inc. | 0.01 | -0.94 | 3.86 | 20.04 | 0.8321 | 0.1195 | |||
| INDA / iShares Trust - iShares MSCI India ETF | 0.07 | 4.84 | 3.83 | 13.42 | 0.8260 | 0.0773 | |||
| DHR / Danaher Corporation | 0.02 | -1.23 | 3.82 | -4.82 | 0.8231 | -0.0658 | |||
| WM / Waste Management, Inc. | 0.02 | 1.59 | 3.80 | 0.42 | 0.8202 | -0.0194 | |||
| NOC / Northrop Grumman Corporation | 0.01 | -0.98 | 3.60 | -3.31 | 0.7761 | -0.0489 | |||
| ARIS / Aris Water Solutions, Inc. | 0.15 | -23.97 | 3.59 | -43.88 | 0.7750 | -0.6445 | |||
| EXAS / Exact Sciences Corporation | 0.07 | 3.53 | 0.7606 | 0.7606 | |||||
| VLTO / Veralto Corporation | 0.03 | 9.31 | 3.50 | 13.22 | 0.7541 | 0.0696 | |||
| AM / Antero Midstream Corporation | 0.16 | -47.09 | 3.04 | -44.31 | 0.6552 | -0.5539 | |||
| RGEN / Repligen Corporation | 0.02 | -1.03 | 2.52 | -3.23 | 0.5426 | -0.0339 | |||
| NKE / NIKE, Inc. | 0.03 | 9.77 | 2.46 | 22.84 | 0.5304 | 0.0866 | |||
| SONO / Sonos, Inc. | 0.20 | -1.38 | 2.21 | -0.09 | 0.4757 | -0.0137 | |||
| UNH / UnitedHealth Group Incorporated | 0.01 | -0.54 | 2.11 | -40.76 | 0.4550 | -0.3344 | |||
| ONEW / OneWater Marine Inc. | 0.15 | -2.08 | 2.00 | -18.97 | 0.4313 | -0.1158 | |||
| BAC / Bank of America Corporation | 0.04 | 0.12 | 1.83 | 13.52 | 0.3951 | 0.0374 | |||
| LYTS / LSI Industries Inc. | 0.10 | -1.07 | 1.74 | -1.03 | 0.3750 | -0.0144 | |||
| EIDO / iShares Trust - iShares MSCI Indonesia ETF | 0.09 | -0.60 | 1.51 | 7.54 | 0.3261 | 0.0143 | |||
| IWM / iShares Trust - iShares Russell 2000 ETF | 0.01 | 36.73 | 1.24 | 47.86 | 0.2681 | 0.0818 | |||
| ADBE / Adobe Inc. | 0.00 | -1.04 | 1.03 | -0.19 | 0.2232 | -0.0066 | |||
| GLD / SPDR Gold Trust | 0.00 | -13.08 | 0.78 | -8.02 | 0.1683 | -0.0198 | |||
| WCN / Waste Connections, Inc. | 0.00 | 0.00 | 0.76 | -4.30 | 0.1634 | -0.0122 | |||
| FOXF / Fox Factory Holding Corp. | 0.03 | -0.93 | 0.68 | 10.05 | 0.1467 | 0.0098 | |||
| CVX / Chevron Corporation | 0.00 | 3.41 | 0.62 | -11.49 | 0.1329 | -0.0214 | |||
| SPYG / SPDR Series Trust - SPDR Portfolio S&P 500 Growth ETF | 0.01 | -21.27 | 0.52 | -6.76 | 0.1132 | -0.0114 | |||
| OKE / ONEOK, Inc. | 0.01 | 18.63 | 0.49 | -2.39 | 0.1059 | -0.0056 | |||
| IBM / International Business Machines Corporation | 0.00 | 2.33 | 0.38 | 21.29 | 0.0811 | 0.0124 | |||
| VTI / Vanguard Index Funds - Vanguard Total Stock Market ETF | 0.00 | 0.36 | 0.0782 | 0.0782 | |||||
| LLY / Eli Lilly and Company | 0.00 | -25.04 | 0.36 | -29.35 | 0.0781 | -0.0353 | |||
| RSP / Invesco Exchange-Traded Fund Trust - Invesco S&P 500 Equal Weight ETF | 0.00 | 0.35 | 0.0755 | 0.0755 | |||||
| AMLP / ALPS ETF Trust - Alerian MLP ETF | 0.01 | 0.31 | 0.0675 | 0.0675 | |||||
| MS / Morgan Stanley | 0.00 | 21.80 | 0.30 | 47.29 | 0.0647 | 0.0195 | |||
| SYRE / Spyre Therapeutics, Inc. | 0.02 | 0.00 | 0.29 | -7.35 | 0.0627 | -0.0068 | |||
| MDLZ / Mondelez International, Inc. | 0.00 | 0.28 | 0.0601 | 0.0601 | |||||
| CL / Colgate-Palmolive Company | 0.00 | 0.27 | 0.0586 | 0.0586 | |||||
| PM / Philip Morris International Inc. | 0.00 | 0.00 | 0.27 | 14.83 | 0.0585 | 0.0061 | |||
| PEP / PepsiCo, Inc. | 0.00 | 15.23 | 0.27 | 1.52 | 0.0578 | -0.0007 | |||
| PLD / Prologis, Inc. | 0.00 | 0.26 | 0.0570 | 0.0570 | |||||
| CSCO / Cisco Systems, Inc. | 0.00 | 11.88 | 0.25 | 26.00 | 0.0544 | 0.0099 | |||
| KMI / Kinder Morgan, Inc. | 0.01 | 0.24 | 0.0510 | 0.0510 | |||||
| IVV / iShares Trust - iShares Core S&P 500 ETF | 0.00 | 0.00 | 0.24 | 10.33 | 0.0509 | 0.0036 | |||
| NEE / NextEra Energy, Inc. | 0.00 | 0.23 | 0.0506 | 0.0506 | |||||
| DUK / Duke Energy Corporation | 0.00 | 8.49 | 0.23 | 5.02 | 0.0498 | 0.0010 | |||
| KO / The Coca-Cola Company | 0.00 | 5.57 | 0.23 | 4.57 | 0.0495 | 0.0007 | |||
| SO / The Southern Company | 0.00 | -6.30 | 0.23 | -6.25 | 0.0486 | -0.0048 | |||
| MET / MetLife, Inc. | 0.00 | 0.22 | 0.0479 | 0.0479 | |||||
| XLE / The Select Sector SPDR Trust - The Energy Select Sector SPDR Fund | 0.00 | 2.91 | 0.22 | -6.75 | 0.0478 | -0.0048 | |||
| MDT / Medtronic plc | 0.00 | 6.41 | 0.22 | 3.27 | 0.0478 | 0.0002 | |||
| LMT / Lockheed Martin Corporation | 0.00 | 0.22 | 0.0477 | 0.0477 | |||||
| AEP / American Electric Power Company, Inc. | 0.00 | 0.22 | 0.0476 | 0.0476 | |||||
| GILD / Gilead Sciences, Inc. | 0.00 | -2.95 | 0.22 | -3.96 | 0.0471 | -0.0033 | |||
| MO / Altria Group, Inc. | 0.00 | 7.80 | 0.22 | 5.34 | 0.0469 | 0.0011 | |||
| JNJ / Johnson & Johnson | 0.00 | 11.53 | 0.22 | 2.84 | 0.0469 | -0.0000 | |||
| APD / Air Products and Chemicals, Inc. | 0.00 | 0.22 | 0.0467 | 0.0467 | |||||
| CMCSA / Comcast Corporation | 0.01 | 0.21 | 0.0460 | 0.0460 | |||||
| PAYX / Paychex, Inc. | 0.00 | 6.84 | 0.21 | 0.96 | 0.0456 | -0.0009 | |||
| TXN / Texas Instruments Incorporated | 0.00 | 0.21 | 0.0454 | 0.0454 | |||||
| WMB / The Williams Companies, Inc. | 0.00 | 0.21 | 0.0445 | 0.0445 | |||||
| AMGN / Amgen Inc. | 0.00 | 3.22 | 0.21 | -7.66 | 0.0444 | -0.0049 | |||
| PG / The Procter & Gamble Company | 0.00 | 0.20 | 0.0440 | 0.0440 | |||||
| O / Realty Income Corporation | 0.00 | 0.20 | 0.0435 | 0.0435 | |||||
| C / Citigroup Inc. | 0.00 | 0.20 | 0.0433 | 0.0433 | |||||
| MAS / Masco Corporation | 0.00 | -100.00 | 0.00 | 0.0000 | |||||
| VZ / Verizon Communications Inc. | 0.00 | -100.00 | 0.00 | 0.0000 | |||||
| T / AT&T Inc. | 0.00 | -100.00 | 0.00 | 0.0000 | |||||
| CIVI / Civitas Resources, Inc. | 0.00 | -100.00 | 0.00 | 0.0000 | |||||
| BK / The Bank of New York Mellon Corporation | 0.00 | -100.00 | 0.00 | 0.0000 | |||||
| NGL / NGL Energy Partners LP - Limited Partnership | 0.00 | -100.00 | 0.00 | 0.0000 | |||||
| COP / ConocoPhillips | 0.00 | -100.00 | 0.00 | 0.0000 | |||||
| BMY / Bristol-Myers Squibb Company | 0.00 | -100.00 | 0.00 | 0.0000 |