Statistik Asas
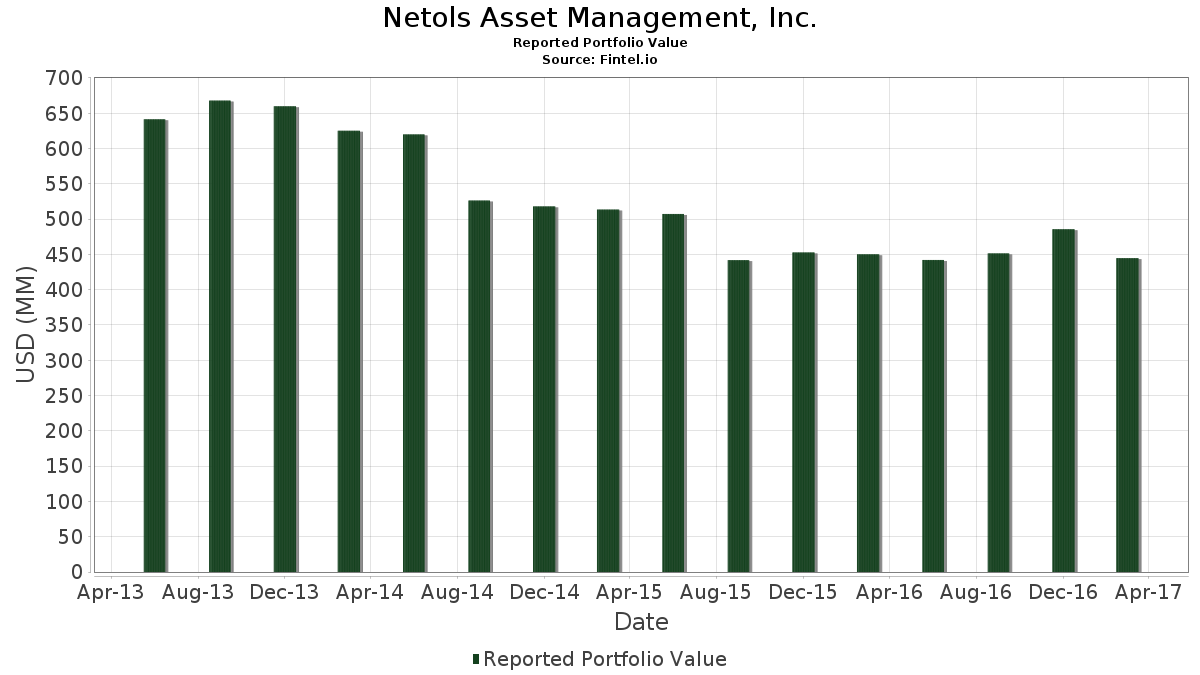
| Nilai Portfolio | $ 444,730,000 |
| Kedudukan Semasa | 69 |
Pegangan Terkini, Prestasi, AUM (dari 13F, 13D)
Netols Asset Management, Inc. telah mendedahkan 69 jumlah pegangan dalam pemfailan SEC terkini mereka. Nilai portfolio terkini dikira sebagai $ 444,730,000 USD. Aset Sebenar Di Bawah Pengurusan (AUM) ialah nilai ini ditambah dengan tunai (yang tidak didedahkan). Pegangan teratas Netols Asset Management, Inc. ialah Sterling Bancorp. (US:STL) , Selective Insurance Group, Inc. (US:SIGI) , Bob Evans Farms, Inc. (US:BOBE) , MGIC Investment Corporation (US:MTG) , and The Hanover Insurance Group, Inc. (US:THG) . Kedudukan baharu Netols Asset Management, Inc. termasuk Standex International Corporation (US:SXI) , ArcBest Corporation (US:ARCB) , Harmonic Inc. (US:HLIT) , Triumph Group, Inc. (US:TGI) , and .
Kenaikan Teratas Suku Tahun Ini
Kami menggunakan perubahan dalam peruntukan portfolio kerana ini adalah metrik yang paling bermakna. Perubahan boleh disebabkan oleh perdagangan atau perubahan dalam harga saham.
| Sekuriti | Saham (MM) |
Nilai (MM$) |
Portfolio % | ΔPortfolio % |
|---|---|---|---|---|
| 0.16 | 10.11 | 2.2740 | 2.2740 | |
| 0.45 | 9.41 | 2.1168 | 2.1168 | |
| 0.24 | 9.32 | 2.0950 | 2.0950 | |
| 0.08 | 9.19 | 2.0666 | 2.0666 | |
| 1.34 | 9.03 | 2.0302 | 2.0302 | |
| 0.26 | 8.13 | 1.8283 | 1.8283 | |
| 0.31 | 7.98 | 1.7941 | 1.7941 | |
| 0.21 | 7.30 | 1.6423 | 1.6423 | |
| 0.59 | 6.99 | 1.5722 | 1.5722 | |
| 0.16 | 6.71 | 1.5081 | 1.5081 |
Penurunan Teratas Suku Tahun Ini
Kami menggunakan perubahan dalam peruntukan portfolio kerana ini adalah metrik yang paling bermakna. Perubahan boleh disebabkan oleh perdagangan atau perubahan dalam harga saham.
| Sekuriti | Saham (MM) |
Nilai (MM$) |
Portfolio % | ΔPortfolio % |
|---|---|---|---|---|
| 0.00 | 0.00 | -1.6457 | ||
| 0.12 | 3.67 | 0.8245 | -0.5195 | |
| 0.15 | 4.37 | 0.9835 | -0.4071 | |
| 0.37 | 5.21 | 1.1710 | -0.3894 | |
| 0.21 | 7.22 | 1.6232 | -0.3504 | |
| 0.60 | 2.75 | 0.6181 | -0.3248 | |
| 0.20 | 6.18 | 1.3905 | -0.2751 | |
| 0.17 | 4.96 | 1.1148 | -0.2646 | |
| 0.12 | 6.76 | 1.5202 | -0.1833 | |
| 0.26 | 5.33 | 1.1989 | -0.1550 |
13F dan Pemfailan Dana
Borang ini telah difailkan pada 2017-05-10 untuk tempoh pelaporan 2017-03-31. Klik ikon pautan untuk melihat sejarah transaksi penuh.
Tingkatkan untuk membuka data premium dan eksport ke Excel ![]() .
.
| Sekuriti | Jenis | Purata Harga Saham | Saham (MM) |
ΔSaham (%) |
ΔSaham (%) |
Nilai ($MM) |
Portfolio (%) |
ΔPortfolio (%) |
|
|---|---|---|---|---|---|---|---|---|---|
| STL / Sterling Bancorp. | 0.44 | -8.18 | 10.38 | -7.00 | 2.3351 | 0.0360 | |||
| SIGI / Selective Insurance Group, Inc. | 0.22 | -12.71 | 10.14 | -4.40 | 2.2798 | 0.0962 | |||
| BOBE / Bob Evans Farms, Inc. | 0.16 | -8.15 | 10.11 | 11.97 | 2.2740 | 2.2740 | |||
| MTG / MGIC Investment Corporation | 0.97 | -8.11 | 9.86 | -8.65 | 2.2169 | -0.0053 | |||
| THG / The Hanover Insurance Group, Inc. | 0.10 | -12.81 | 9.45 | -13.72 | 2.1242 | -0.1301 | |||
| LL / LL Flooring Holdings, Inc. | 0.45 | -8.16 | 9.41 | 22.47 | 2.1168 | 2.1168 | |||
| BRC / Brady Corporation | 0.24 | -8.14 | 9.32 | -5.45 | 2.0950 | 2.0950 | |||
| CACI / CACI International Inc | 0.08 | -8.14 | 9.19 | -13.32 | 2.0666 | 2.0666 | |||
| SUI / Sun Communities, Inc. | 0.11 | -8.07 | 9.04 | -3.61 | 2.0327 | 0.1017 | |||
| / McDermott International, Inc. | 1.34 | -8.09 | 9.03 | -16.05 | 2.0302 | 2.0302 | |||
| ENTG / Entegris, Inc. | 0.37 | -8.13 | 8.63 | 20.09 | 1.9407 | 0.4610 | |||
| FICO / Fair Isaac Corporation | 0.07 | -8.09 | 8.49 | -0.60 | 1.9083 | 0.1505 | |||
| CASY / Casey's General Stores, Inc. | 0.07 | -8.20 | 8.38 | -13.33 | 1.8850 | -0.1064 | |||
| WBS / Webster Financial Corporation | 0.17 | -8.14 | 8.34 | -15.31 | 1.8751 | -0.1523 | |||
| MPAA / Motorcar Parts of America, Inc. | 0.26 | -8.09 | 8.13 | 4.92 | 1.8283 | 1.8283 | |||
| CSFL / Centerstate Banks, Inc. | 0.31 | -8.17 | 7.98 | -5.51 | 1.7941 | 1.7941 | |||
| PLXS / Plexus Corp. | 0.14 | -8.14 | 7.95 | -1.75 | 1.7885 | 0.1216 | |||
| STBZ / State Bank Financial Corp. | 0.28 | -8.16 | 7.42 | -10.69 | 1.6678 | -0.0422 | |||
| / Briggs & Stratton Corp. | 0.33 | -8.21 | 7.40 | -7.43 | 1.6642 | 0.0181 | |||
| AUB / Atlantic Union Bankshares Corporation | 0.21 | -8.11 | 7.30 | -9.55 | 1.6423 | 1.6423 | |||
| MANT / Mantech International Corp - Class A | 0.21 | -8.12 | 7.22 | -24.69 | 1.6232 | -0.3504 | |||
| GBCI / Glacier Bancorp, Inc. | 0.21 | -8.18 | 7.08 | -14.02 | 1.5931 | -0.1034 | |||
| BXS / BancorpSouth Bank | 0.23 | -8.22 | 7.05 | -10.58 | 1.5848 | -0.0380 | |||
| IART / Integra LifeSciences Holdings Corporation | 0.17 | 83.82 | 7.01 | -9.73 | 1.5767 | -0.0227 | |||
| FORM / FormFactor, Inc. | 0.59 | -8.17 | 6.99 | -2.83 | 1.5722 | 1.5722 | |||
| CBU / Community Financial System, Inc. | 0.12 | -8.17 | 6.76 | -18.29 | 1.5202 | -0.1833 | |||
| EXK / Endeavour Silver Corp. | 0.16 | -8.14 | 6.71 | -11.29 | 1.5081 | 1.5081 | |||
| ONB / Old National Bancorp | 0.38 | -8.10 | 6.67 | -12.15 | 1.5009 | -0.0634 | |||
| CNMD / CONMED Corporation | 0.15 | -8.11 | 6.65 | -7.61 | 1.4951 | 0.0133 | |||
| WSBC / WesBanco, Inc. | 0.17 | -8.10 | 6.64 | -18.66 | 1.4930 | 1.4930 | |||
| BGC / BGC Group, Inc. | 0.37 | -8.11 | 6.63 | -13.41 | 1.4912 | -0.0857 | |||
| SRCI / SRC Energy Inc | 0.78 | -8.10 | 6.55 | -12.95 | 1.4726 | -0.0763 | |||
| MATW / Matthews International Corporation | 0.10 | -8.09 | 6.51 | -19.09 | 1.4629 | 1.4629 | |||
| FR / First Industrial Realty Trust, Inc. | 0.24 | -8.08 | 6.50 | -12.73 | 1.4604 | -0.0718 | |||
| URI / United Rentals, Inc. | 0.05 | -19.96 | 6.41 | -5.20 | 1.4420 | 0.0492 | |||
| US92346NAB55 / VeriFone Systems, Inc | 0.34 | -8.13 | 6.36 | -2.93 | 1.4294 | 0.0810 | |||
| TEN / Tsakos Energy Navigation Limited | 0.10 | -8.10 | 6.35 | -8.18 | 1.4287 | 0.0040 | |||
| HAWK / Blackhawk Network Holdings, Inc. | 0.16 | -8.09 | 6.34 | -0.95 | 1.4254 | 1.4254 | |||
| CIR / Circor International Inc | 0.11 | -2.09 | 6.28 | -10.29 | 1.4128 | 1.4128 | |||
| ETD / Ethan Allen Interiors Inc. | 0.20 | -8.10 | 6.18 | -23.56 | 1.3905 | -0.2751 | |||
| SXT / Sensient Technologies Corporation | 0.08 | -8.10 | 5.96 | -7.31 | 1.3397 | 0.0162 | |||
| SXI / Standex International Corporation | 0.06 | 5.94 | 1.3354 | 1.3354 | |||||
| AVID / Avid Technology, Inc. | 1.27 | 27.62 | 5.90 | 35.14 | 1.3264 | 1.3264 | |||
| CRI / Carter's, Inc. | 0.07 | -8.10 | 5.89 | -4.46 | 1.3235 | 0.0550 | |||
| WAB / Westinghouse Air Brake Technologies Corporation | 0.07 | -8.13 | 5.69 | -13.68 | 1.2788 | -0.0776 | |||
| GWR / Genesee & Wyoming, Inc. | 0.08 | -8.09 | 5.61 | -10.14 | 1.2612 | -0.0239 | |||
| IVC / Invacare Corp. | 0.47 | -8.08 | 5.59 | -16.18 | 1.2569 | -0.1161 | |||
| EPAY / Bottomline Technologies (Delaware) Inc | 0.23 | -8.12 | 5.53 | -13.15 | 1.2432 | 1.2432 | |||
| OIS / Oil States International, Inc. | 0.16 | -8.10 | 5.33 | -21.89 | 1.1996 | 1.1996 | |||
| TRS / TriMas Corporation | 0.26 | -8.17 | 5.33 | -18.92 | 1.1989 | -0.1550 | |||
| AMRI / Albany Molecular Research, Inc. | 0.37 | -8.11 | 5.21 | -31.28 | 1.1710 | -0.3894 | |||
| CALM / Cal-Maine Foods, Inc. | 0.14 | -1.32 | 5.15 | -17.79 | 1.1585 | 1.1585 | |||
| CRS / Carpenter Technology Corporation | 0.14 | 14.20 | 5.05 | 17.77 | 1.1357 | 0.2527 | |||
| CAKE / The Cheesecake Factory Incorporated | 0.08 | -8.12 | 5.04 | -2.78 | 1.1335 | 0.0660 | |||
| UFI / Unifi, Inc. | 0.17 | -14.95 | 4.96 | -26.00 | 1.1148 | -0.2646 | |||
| ARCB / ArcBest Corporation | 0.19 | 4.95 | 1.1139 | 1.1139 | |||||
| THR / Thermon Group Holdings, Inc. | 0.23 | -8.13 | 4.74 | 0.27 | 1.0667 | 0.0927 | |||
| HLIT / Harmonic Inc. | 0.79 | 4.71 | 1.0582 | 1.0582 | |||||
| NDLS / Noodles & Company | 0.79 | -7.51 | 4.54 | 29.72 | 1.0217 | 1.0217 | |||
| USPH / U.S. Physical Therapy, Inc. | 0.07 | -8.09 | 4.49 | -14.51 | 1.0098 | -0.0717 | |||
| AYI / Acuity Inc. | 0.02 | -8.07 | 4.44 | -18.77 | 0.9986 | -0.1270 | |||
| PRGS / Progress Software Corporation | 0.15 | -28.82 | 4.37 | -35.24 | 0.9835 | -0.4071 | |||
| KND / Kindred Healthcare, Inc. | 0.50 | 22.04 | 4.20 | 29.82 | 0.9446 | 0.9446 | |||
| MLHR / Herman Miller Inc. | 0.12 | -39.10 | 3.67 | -43.83 | 0.8245 | -0.5195 | |||
| CVGI / Commercial Vehicle Group, Inc. | 0.48 | -7.99 | 3.23 | 12.65 | 0.7270 | 0.1361 | |||
| TGI / Triumph Group, Inc. | 0.12 | 2.96 | 0.6665 | 0.6665 | |||||
| PGTI / PGT Innovations, Inc. | 0.26 | -20.88 | 2.77 | -25.70 | 0.6240 | -0.1450 | |||
| BBG / Bill Barrett Corp. | 0.60 | -7.78 | 2.75 | -39.98 | 0.6181 | -0.3248 | |||
| WG / Willbros Group, Inc. | 0.68 | -7.72 | 1.85 | -21.95 | 0.4167 | -0.0721 | |||
| 918194101 / VCA Inc. | 0.00 | -100.00 | 0.00 | -100.00 | -1.6457 | ||||
| ACAT / Acasia Technology, Inc. | 0.00 | -100.00 | 0.00 | -100.00 | 0.0000 | 0.0000 |