Statistik Asas
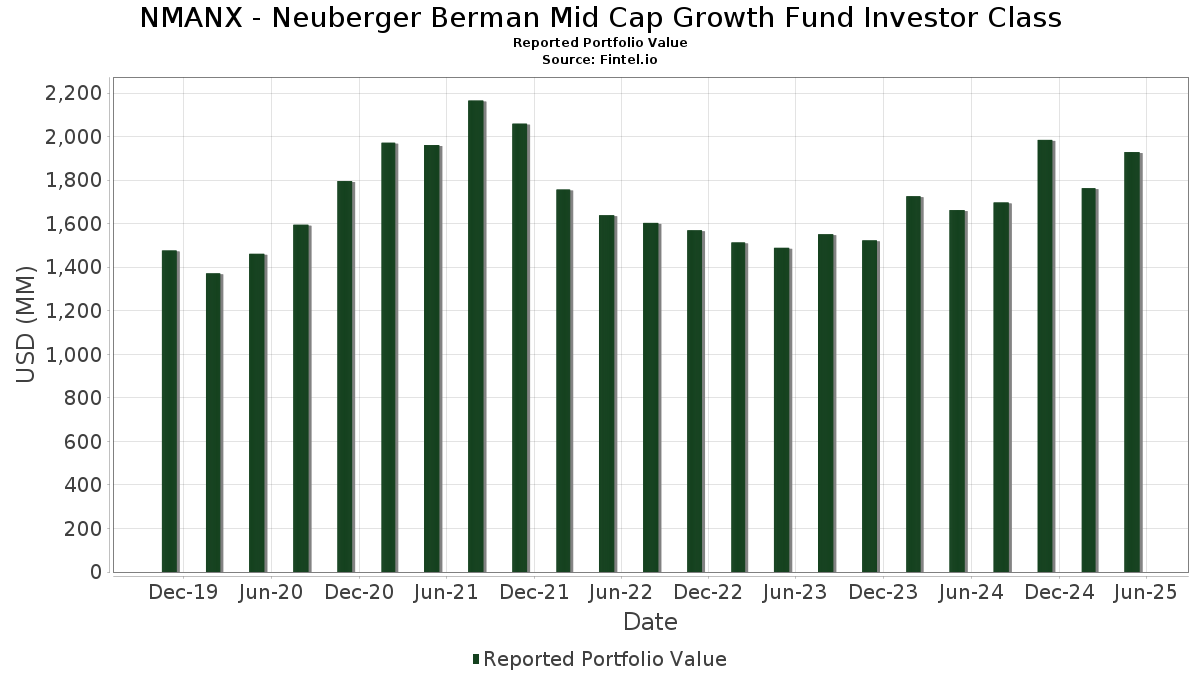
| Nilai Portfolio | $ 1,928,805,734 |
| Kedudukan Semasa | 80 |
Pegangan Terkini, Prestasi, AUM (dari 13F, 13D)
NMANX - Neuberger Berman Mid Cap Growth Fund Investor Class telah mendedahkan 80 jumlah pegangan dalam pemfailan SEC terkini mereka. Nilai portfolio terkini dikira sebagai $ 1,928,805,734 USD. Aset Sebenar Di Bawah Pengurusan (AUM) ialah nilai ini ditambah dengan tunai (yang tidak didedahkan). Pegangan teratas NMANX - Neuberger Berman Mid Cap Growth Fund Investor Class ialah Palantir Technologies Inc. (US:PLTR) , AppLovin Corporation (US:APP) , State Street Institutional Investment Trust - State Street Institutional US Govt Money Market Fnd Premier Cls (US:GVMXX) , Axon Enterprise, Inc. (US:AXON) , and Cencora, Inc. (US:COR) . Kedudukan baharu NMANX - Neuberger Berman Mid Cap Growth Fund Investor Class termasuk Toast, Inc. (US:TOST) , LPL Financial Holdings Inc. (US:LPLA) , Coupang, Inc. (US:CPNG) , Broadridge Financial Solutions, Inc. (US:BR) , and Yum! Brands, Inc. (US:YUM) .
Kenaikan Teratas Suku Tahun Ini
Kami menggunakan perubahan dalam peruntukan portfolio kerana ini adalah metrik yang paling bermakna. Perubahan boleh disebabkan oleh perdagangan atau perubahan dalam harga saham.
| Sekuriti | Saham (MM) |
Nilai (MM$) |
Portfolio % | ΔPortfolio % |
|---|---|---|---|---|
| 66.88 | 66.88 | 3.4932 | 3.2305 | |
| 0.25 | 41.30 | 2.1572 | 2.1572 | |
| 0.91 | 38.25 | 1.9978 | 1.9978 | |
| 0.22 | 88.17 | 4.6051 | 1.8031 | |
| 0.06 | 38.79 | 2.0261 | 1.5110 | |
| 0.07 | 28.88 | 1.5083 | 1.5083 | |
| 1.02 | 28.67 | 1.4976 | 1.4976 | |
| 0.08 | 19.62 | 1.0248 | 1.0248 | |
| 0.13 | 19.12 | 0.9984 | 0.9984 | |
| 0.22 | 17.24 | 0.9004 | 0.9004 |
Penurunan Teratas Suku Tahun Ini
Kami menggunakan perubahan dalam peruntukan portfolio kerana ini adalah metrik yang paling bermakna. Perubahan boleh disebabkan oleh perdagangan atau perubahan dalam harga saham.
| Sekuriti | Saham (MM) |
Nilai (MM$) |
Portfolio % | ΔPortfolio % |
|---|---|---|---|---|
| 0.00 | 0.00 | -3.7766 | ||
| 0.00 | 0.00 | -1.2319 | ||
| 0.19 | 26.83 | 1.4014 | -1.1371 | |
| 0.00 | 0.00 | -0.9787 | ||
| 0.68 | 89.93 | 4.6971 | -0.9071 | |
| 0.00 | 0.00 | -0.8231 | ||
| 0.29 | 25.21 | 1.3168 | -0.7450 | |
| 0.01 | 20.79 | 1.0858 | -0.6929 | |
| 1.95 | 23.43 | 1.2237 | -0.6588 | |
| 0.08 | 9.36 | 0.4889 | -0.6161 |
13F dan Pemfailan Dana
Borang ini telah difailkan pada 2025-07-28 untuk tempoh pelaporan 2025-05-31. Klik ikon pautan untuk melihat sejarah transaksi penuh.
Tingkatkan untuk membuka data premium dan eksport ke Excel ![]() .
.
| Sekuriti | Jenis | Purata Harga Saham | Saham (MM) |
ΔSaham (%) |
ΔSaham (%) |
Nilai ($MM) |
Portfolio (%) |
ΔPortfolio (%) |
|
|---|---|---|---|---|---|---|---|---|---|
| PLTR / Palantir Technologies Inc. | 0.68 | -43.89 | 89.93 | -12.92 | 4.6971 | -0.9071 | |||
| APP / AppLovin Corporation | 0.22 | 41.52 | 88.17 | 70.75 | 4.6051 | 1.8031 | |||
| GVMXX / State Street Institutional Investment Trust - State Street Institutional US Govt Money Market Fnd Premier Cls | 66.88 | 1,281.60 | 66.88 | 1,281.80 | 3.4932 | 3.2305 | |||
| AXON / Axon Enterprise, Inc. | 0.07 | -8.60 | 51.02 | 29.78 | 2.6651 | 0.5316 | |||
| COR / Cencora, Inc. | 0.16 | -4.50 | 47.85 | 9.70 | 2.4993 | 0.1324 | |||
| GWW / W.W. Grainger, Inc. | 0.04 | 13.66 | 45.24 | 21.05 | 2.3631 | 0.3348 | |||
| HEI / HEICO Corporation | 0.15 | 0.00 | 43.51 | 13.21 | 2.2725 | 0.1870 | |||
| ARES / Ares Management Corporation | 0.26 | -9.72 | 43.10 | -12.59 | 2.2510 | -0.4245 | |||
| NET / Cloudflare, Inc. | 0.25 | 41.30 | 2.1572 | 2.1572 | |||||
| RBLX / Roblox Corporation | 0.46 | -26.83 | 40.29 | 0.00 | 2.1042 | -0.0818 | |||
| SPOT / Spotify Technology S.A. | 0.06 | 273.60 | 38.79 | 308.70 | 2.0261 | 1.5110 | |||
| TOST / Toast, Inc. | 0.91 | 38.25 | 1.9978 | 1.9978 | |||||
| DDOG / Datadog, Inc. | 0.31 | -13.26 | 36.89 | -12.27 | 1.9266 | -0.3549 | |||
| MPWR / Monolithic Power Systems, Inc. | 0.05 | 77.43 | 33.29 | 92.21 | 1.7386 | 0.7988 | |||
| TRGP / Targa Resources Corp. | 0.19 | 0.00 | 29.58 | -21.71 | 1.5450 | -0.5052 | |||
| IDXX / IDEXX Laboratories, Inc. | 0.06 | -0.88 | 29.23 | 16.41 | 1.5268 | 0.1641 | |||
| RCL / Royal Caribbean Cruises Ltd. | 0.11 | 13.68 | 29.04 | 18.70 | 1.5167 | 0.1892 | |||
| LPLA / LPL Financial Holdings Inc. | 0.07 | 28.88 | 1.5083 | 1.5083 | |||||
| CPNG / Coupang, Inc. | 1.02 | 28.67 | 1.4976 | 1.4976 | |||||
| VRSK / Verisk Analytics, Inc. | 0.09 | 19.48 | 27.36 | 55.16 | 1.4291 | 0.4071 | |||
| TW / Tradeweb Markets Inc. | 0.19 | -46.25 | 26.83 | -42.64 | 1.4014 | -1.1371 | |||
| ZS / Zscaler, Inc. | 0.10 | -22.16 | 26.59 | 3.88 | 1.3888 | 0.0988 | |||
| DKNG / DraftKings Inc. | 0.73 | -10.03 | 26.35 | -26.40 | 1.3763 | -0.5665 | |||
| DXCM / DexCom, Inc. | 0.29 | 1.15 | 25.21 | -26.93 | 1.3168 | -0.7450 | |||
| RDDT / Reddit, Inc. | 0.22 | 90.49 | 24.91 | 32.29 | 1.3013 | 0.2793 | |||
| WING / Wingstop Inc. | 0.07 | 61.11 | 24.77 | 134.48 | 1.2939 | 0.7206 | |||
| PSTG / Pure Storage, Inc. | 0.45 | -4.61 | 24.02 | -2.58 | 1.2546 | -0.0833 | |||
| CYBR / CyberArk Software Ltd. | 0.06 | 149.65 | 23.74 | 162.64 | 1.2402 | 0.7496 | |||
| NU / Nu Holdings Ltd. | 1.95 | -39.55 | 23.43 | -32.46 | 1.2237 | -0.6588 | |||
| ORLY / O'Reilly Automotive, Inc. | 0.02 | -15.73 | 23.28 | -16.11 | 1.2158 | -0.2899 | |||
| VLTO / Veralto Corporation | 0.22 | 0.00 | 22.30 | 1.27 | 1.1646 | -0.0301 | |||
| ALNY / Alnylam Pharmaceuticals, Inc. | 0.07 | -10.34 | 22.01 | 10.66 | 1.1495 | 0.0703 | |||
| MSTR / Strategy Inc | 0.06 | 39.30 | 21.92 | 101.28 | 1.1450 | 0.5540 | |||
| CTAS / Cintas Corporation | 0.10 | 0.00 | 21.73 | 9.16 | 1.1351 | 0.0547 | |||
| DUOL / Duolingo, Inc. | 0.04 | 81.14 | 21.14 | 201.63 | 1.1044 | 0.7240 | |||
| PWR / Quanta Services, Inc. | 0.06 | -17.84 | 21.14 | 8.40 | 1.1040 | 0.0459 | |||
| FICO / Fair Isaac Corporation | 0.01 | -30.70 | 20.79 | -36.58 | 1.0858 | -0.6929 | |||
| FIX / Comfort Systems USA, Inc. | 0.04 | 0.00 | 20.47 | 31.63 | 1.0691 | 0.2252 | |||
| AJG / Arthur J. Gallagher & Co. | 0.06 | -16.09 | 20.38 | 19.52 | 1.0643 | 0.0762 | |||
| LNG / Cheniere Energy, Inc. | 0.08 | 21.84 | 20.12 | 26.33 | 1.0509 | 0.1866 | |||
| CVNA / Carvana Co. | 0.06 | -31.08 | 20.11 | -3.28 | 1.0505 | -0.0779 | |||
| BR / Broadridge Financial Solutions, Inc. | 0.08 | 19.62 | 1.0248 | 1.0248 | |||||
| HOOD / Robinhood Markets, Inc. | 0.30 | 47.31 | 19.58 | 94.51 | 1.0228 | 0.4765 | |||
| ROST / Ross Stores, Inc. | 0.14 | 2.06 | 19.42 | 1.89 | 1.0141 | -0.0199 | |||
| URI / United Rentals, Inc. | 0.03 | 2.24 | 19.41 | 12.75 | 1.0138 | 0.0797 | |||
| PKG / Packaging Corporation of America | 0.10 | 0.00 | 19.34 | -9.35 | 1.0100 | -0.1475 | |||
| TXRH / Texas Roadhouse, Inc. | 0.10 | 0.00 | 19.27 | 6.04 | 1.0064 | 0.0204 | |||
| DSGX / The Descartes Systems Group Inc. | 0.17 | -22.43 | 19.16 | -19.34 | 1.0009 | -0.2883 | |||
| YUM / Yum! Brands, Inc. | 0.13 | 19.12 | 0.9984 | 0.9984 | |||||
| DASH / DoorDash, Inc. | 0.09 | 18.41 | 18.92 | 24.50 | 0.9885 | 0.1636 | |||
| NTRA / Natera, Inc. | 0.12 | 4.52 | 18.85 | 5.96 | 0.9847 | 0.0192 | |||
| TPG / TPG Inc. | 0.38 | -13.09 | 18.47 | -24.17 | 0.9646 | -0.3569 | |||
| COHR / Coherent Corp. | 0.24 | 95.47 | 18.03 | 96.63 | 0.9415 | 0.4440 | |||
| BJ / BJ's Wholesale Club Holdings, Inc. | 0.16 | -17.42 | 18.02 | -7.67 | 0.9413 | -0.1179 | |||
| WAY / Waystar Holding Corp. | 0.45 | 0.00 | 17.92 | -8.03 | 0.9359 | -0.1213 | |||
| USFD / US Foods Holding Corp. | 0.22 | 243.22 | 17.70 | 278.91 | 0.9245 | 0.6709 | |||
| SCI / Service Corporation International | 0.22 | 17.24 | 0.9004 | 0.9004 | |||||
| MANH / Manhattan Associates, Inc. | 0.09 | 0.00 | 16.11 | 6.73 | 0.8412 | 0.0223 | |||
| LSCC / Lattice Semiconductor Corporation | 0.34 | 84.52 | 15.30 | 8.24 | 0.7989 | -0.0200 | |||
| EQH / Equitable Holdings, Inc. | 0.28 | 14.66 | 0.7656 | 0.7656 | |||||
| ALL / The Allstate Corporation | 0.07 | 14.36 | 0.7499 | 0.7499 | |||||
| GWRE / Guidewire Software, Inc. | 0.07 | 14.05 | 0.7339 | 0.7339 | |||||
| US8575093013 / State Street Navigator Securities Lending Government Money Market Portfolio | 13.84 | -21.84 | 13.84 | -21.84 | 0.7229 | -0.2380 | |||
| NTNX / Nutanix, Inc. | 0.18 | 0.00 | 13.73 | -0.26 | 0.7172 | -0.0299 | |||
| NTAP / NetApp, Inc. | 0.14 | 0.00 | 13.43 | -0.66 | 0.7017 | -0.0321 | |||
| WCN / Waste Connections, Inc. | 0.07 | 0.00 | 13.28 | 3.86 | 0.6938 | -0.0002 | |||
| EHC / Encompass Health Corporation | 0.11 | -29.34 | 12.81 | -0.42 | 0.6693 | 0.0112 | |||
| SFM / Sprouts Farmers Market, Inc. | 0.07 | 12.39 | 0.6474 | 0.6474 | |||||
| WAT / Waters Corporation | 0.03 | 11.73 | 0.6124 | 0.6124 | |||||
| IR / Ingersoll Rand Inc. | 0.14 | 0.00 | 11.72 | -3.70 | 0.6119 | -0.0483 | |||
| WST / West Pharmaceutical Services, Inc. | 0.05 | 11.47 | 0.5989 | 0.5989 | |||||
| AER / AerCap Holdings N.V. | 0.10 | -36.10 | 11.12 | -28.28 | 0.5809 | -0.2605 | |||
| INSP / Inspire Medical Systems, Inc. | 0.08 | 4.04 | 10.63 | -22.53 | 0.5553 | -0.1893 | |||
| QXO / QXO, Inc. | 0.62 | 55.87 | 10.61 | 107.98 | 0.5542 | 0.2773 | |||
| GLW / Corning Incorporated | 0.20 | 0.00 | 10.11 | -1.11 | 0.5282 | -0.0268 | |||
| XPO / XPO, Inc. | 0.08 | -50.35 | 9.36 | -54.04 | 0.4889 | -0.6161 | |||
| CHE / Chemed Corporation | 0.02 | 9.26 | 0.4837 | 0.4837 | |||||
| STVN / Stevanato Group S.p.A. | 0.38 | 0.00 | 8.42 | 19.16 | 0.4395 | 0.0563 | |||
| CDW / CDW Corporation | 0.04 | -0.73 | 7.31 | 0.47 | 0.3820 | -0.0130 | |||
| AFRM / Affirm Holdings, Inc. | 0.09 | 4.55 | 0.2378 | 0.2378 | |||||
| IT / Gartner, Inc. | 0.00 | -100.00 | 0.00 | -100.00 | -1.2319 | ||||
| GDDY / GoDaddy Inc. | 0.00 | -100.00 | 0.00 | -100.00 | -0.8231 | ||||
| IWP / iShares Trust - iShares Russell Mid-Cap Growth ETF | 0.00 | -100.00 | 0.00 | -100.00 | -3.7766 | ||||
| CHDN / Churchill Downs Incorporated | 0.00 | -100.00 | 0.00 | -100.00 | -0.9787 |