Statistik Asas
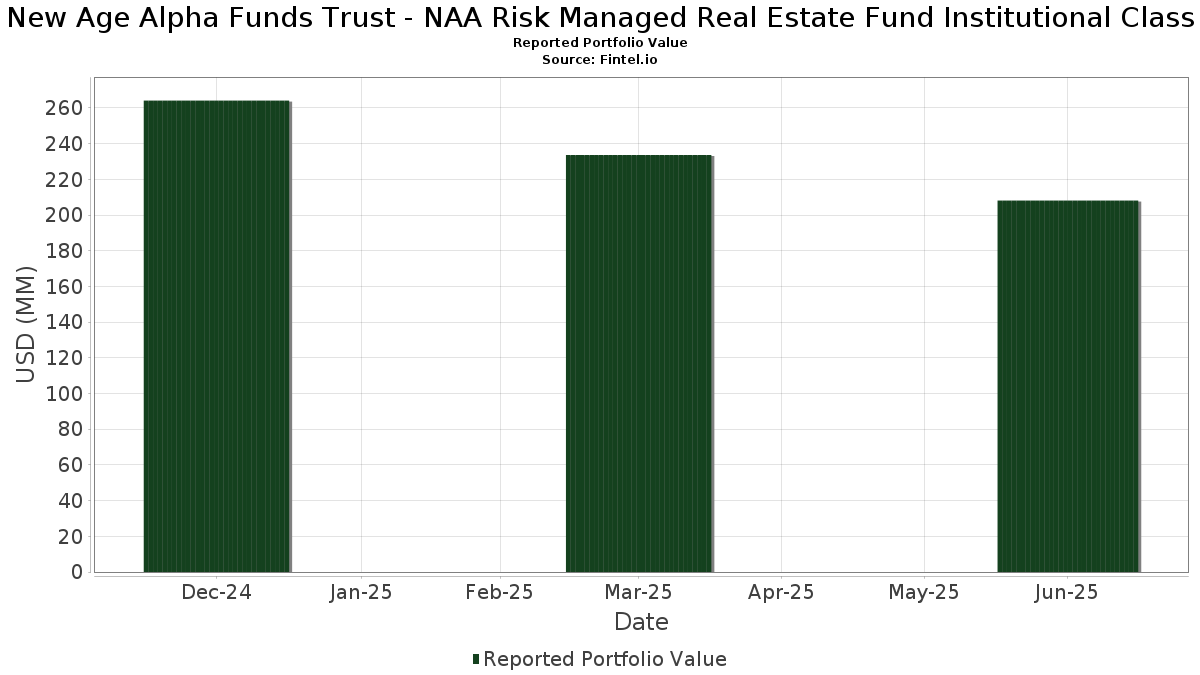
| Nilai Portfolio | $ 208,120,143 |
| Kedudukan Semasa | 148 |
Pegangan Terkini, Prestasi, AUM (dari 13F, 13D)
New Age Alpha Funds Trust - NAA Risk Managed Real Estate Fund Institutional Class telah mendedahkan 148 jumlah pegangan dalam pemfailan SEC terkini mereka. Nilai portfolio terkini dikira sebagai $ 208,120,143 USD. Aset Sebenar Di Bawah Pengurusan (AUM) ialah nilai ini ditambah dengan tunai (yang tidak didedahkan). Pegangan teratas New Age Alpha Funds Trust - NAA Risk Managed Real Estate Fund Institutional Class ialah Prologis, Inc. (US:PLD) , Welltower Inc. (US:WELL) , Equinix, Inc. (US:EQIX) , Simon Property Group, Inc. (US:SPG) , and Realty Income Corporation (US:O) . Kedudukan baharu New Age Alpha Funds Trust - NAA Risk Managed Real Estate Fund Institutional Class termasuk Phillips Edison & Company, Inc. (US:PECO) , eXp World Holdings, Inc. (US:EXPI) , Star Holdings (US:STHO) , Broadstone Net Lease, Inc. (US:BNL) , and FRP Holdings, Inc. (US:FRPH) .
Kenaikan Teratas Suku Tahun Ini
Kami menggunakan perubahan dalam peruntukan portfolio kerana ini adalah metrik yang paling bermakna. Perubahan boleh disebabkan oleh perdagangan atau perubahan dalam harga saham.
| Sekuriti | Saham (MM) |
Nilai (MM$) |
Portfolio % | ΔPortfolio % |
|---|---|---|---|---|
| 29.76 | 14.2536 | 14.2536 | ||
| 11.08 | 5.3059 | 5.3059 | ||
| 9.00 | 4.3090 | 4.3090 | ||
| 0.15 | 16.23 | 7.7743 | 3.5341 | |
| 0.05 | 9.07 | 4.3439 | 3.1892 | |
| 0.03 | 2.18 | 1.0434 | 2.2663 | |
| 0.02 | 0.61 | 0.2917 | 1.7804 | |
| 0.10 | 15.32 | 7.3371 | 1.6286 | |
| 0.06 | 0.94 | 0.4522 | 1.6025 | |
| 0.03 | 3.75 | 1.7946 | 1.5827 |
Penurunan Teratas Suku Tahun Ini
Kami menggunakan perubahan dalam peruntukan portfolio kerana ini adalah metrik yang paling bermakna. Perubahan boleh disebabkan oleh perdagangan atau perubahan dalam harga saham.
| Sekuriti | Saham (MM) |
Nilai (MM$) |
Portfolio % | ΔPortfolio % |
|---|---|---|---|---|
| 0.04 | 1.73 | 0.8280 | -1.4631 | |
| 0.03 | 0.78 | 0.3749 | -1.4328 | |
| 0.04 | 1.20 | 0.5751 | -1.4179 | |
| -0.10 | -2.81 | -1.3464 | -1.3464 | |
| 0.04 | 1.39 | 0.6645 | -1.3442 | |
| 0.06 | 9.31 | 4.4563 | -1.2822 | |
| 0.22 | 7.23 | 3.4634 | -1.2063 | |
| 0.01 | 1.29 | 0.6173 | -1.1463 | |
| 0.02 | 0.76 | 0.3622 | -1.1315 | |
| 0.01 | 3.92 | 1.8779 | -1.0215 |
13F dan Pemfailan Dana
Borang ini telah difailkan pada 2025-08-28 untuk tempoh pelaporan 2025-06-30. Klik ikon pautan untuk melihat sejarah transaksi penuh.
Tingkatkan untuk membuka data premium dan eksport ke Excel ![]() .
.
| Sekuriti | Jenis | Purata Harga Saham | Saham (MM) |
ΔSaham (%) |
ΔSaham (%) |
Nilai ($MM) |
Portfolio (%) |
ΔPortfolio (%) |
|
|---|---|---|---|---|---|---|---|---|---|
| MORGAN STANLEY & COMPANY MARGIN DEPOSIT ACCOUNT / STIV (N/A) | 29.76 | 14.2536 | 14.2536 | ||||||
| PLD / Prologis, Inc. | 0.15 | 73.52 | 16.23 | 63.16 | 7.7743 | 3.5341 | |||
| WELL / Welltower Inc. | 0.10 | 13.99 | 15.32 | 14.38 | 7.3371 | 1.6286 | |||
| EQIX / Equinix, Inc. | 0.02 | 6.93 | 13.81 | 4.33 | 6.6155 | 0.9724 | |||
| BBH Overnight Sweep / STIV (N/A) | 11.08 | 5.3059 | 5.3059 | ||||||
| SPG / Simon Property Group, Inc. | 0.06 | -28.61 | 9.31 | -30.89 | 4.4563 | -1.2822 | |||
| O / Realty Income Corporation | 0.16 | -7.52 | 9.14 | -8.17 | 4.3794 | 0.1357 | |||
| PSA / Public Storage | 0.03 | -4.62 | 9.13 | -6.49 | 4.3715 | 0.2110 | |||
| DLR / Digital Realty Trust, Inc. | 0.05 | 175.17 | 9.07 | 234.81 | 4.3439 | 3.1892 | |||
| U.S. Treasury Bill 0.000%, Due 7/3/2025 / DBT (US912797NX17) | 9.00 | 4.3090 | 4.3090 | ||||||
| VICI / VICI Properties Inc. | 0.22 | -33.96 | 7.23 | -34.00 | 3.4634 | -1.2063 | |||
| EXR / Extra Space Storage Inc. | 0.05 | -5.10 | 6.75 | -5.77 | 3.2326 | 0.1797 | |||
| IRM / Iron Mountain Incorporated | 0.06 | -19.82 | 6.29 | -4.40 | 3.0142 | 0.2079 | |||
| AVB / AvalonBay Communities, Inc. | 0.03 | -17.48 | 6.16 | -21.75 | 2.9496 | -0.4050 | |||
| VTR / Ventas, Inc. | 0.10 | 98.54 | 6.04 | 82.36 | 2.8919 | 1.4805 | |||
| EQR / Equity Residential | 0.07 | -29.29 | 4.97 | -33.33 | 2.3783 | -0.7964 | |||
| INVH / Invitation Homes Inc. | 0.12 | 10.04 | 3.94 | 3.57 | 1.8877 | 0.2657 | |||
| ESS / Essex Property Trust, Inc. | 0.01 | -37.65 | 3.92 | -42.36 | 1.8779 | -1.0215 | |||
| MAA / Mid-America Apartment Communities, Inc. | 0.03 | 753.32 | 3.75 | 653.92 | 1.7946 | 1.5827 | |||
| SUI / Sun Communities, Inc. | 0.03 | 2,629.57 | 3.21 | 2,597.48 | 1.5377 | 1.4867 | |||
| KIM / Kimco Realty Corporation | 0.14 | -28.62 | 3.05 | -29.38 | 1.4591 | -0.3792 | |||
| WPC / W. P. Carey Inc. | 0.05 | -39.51 | 2.88 | -40.22 | 1.3797 | -0.6738 | |||
| UDR / UDR, Inc. | 0.07 | 176.95 | 2.68 | 150.56 | 1.2816 | 0.8260 | |||
| DOC / Healthpeak Properties, Inc. | 0.15 | 28.38 | 2.62 | 11.21 | 1.2548 | 0.2503 | |||
| REG / Regency Centers Corporation | 0.04 | 167.56 | 2.50 | 158.41 | 1.1993 | 0.7862 | |||
| ELS / Equity LifeStyle Properties, Inc. | 0.04 | -19.84 | 2.50 | -25.89 | 1.1984 | -0.2406 | |||
| ARE / Alexandria Real Estate Equities, Inc. | 0.03 | -18.15 | 2.42 | -35.74 | 1.1573 | -0.4455 | |||
| HST / Host Hotels & Resorts, Inc. | 0.15 | -512.20 | 2.33 | -545.40 | 1.1139 | 1.3364 | |||
| LAMR / Lamar Advertising Company | 0.02 | -35.86 | 2.32 | -31.58 | 1.1111 | -0.3342 | |||
| BXP / Boston Properties, Inc. | 0.03 | -175.62 | 2.18 | -175.91 | 1.0434 | 2.2663 | |||
| CUBE / CubeSmart | 0.05 | -9.98 | 2.12 | -10.40 | 1.0154 | 0.0066 | |||
| EGP / EastGroup Properties, Inc. | 0.01 | 230.55 | 1.90 | 213.74 | 0.9077 | 0.6501 | |||
| REXR / Rexford Industrial Realty, Inc. | 0.05 | -37.69 | 1.82 | -43.39 | 0.8719 | -0.4987 | |||
| NNN / NNN REIT, Inc. | 0.04 | -68.23 | 1.73 | -67.85 | 0.8280 | -1.4631 | |||
| ADC / Agree Realty Corporation | 0.02 | -47.30 | 1.71 | -50.13 | 0.8201 | -0.6430 | |||
| STAG / STAG Industrial, Inc. | 0.04 | 205.70 | 1.49 | 207.45 | 0.7114 | 0.5052 | |||
| VNO / Vornado Realty Trust | 0.04 | 22.15 | 1.46 | 26.34 | 0.6983 | 0.2062 | |||
| EPRT / Essential Properties Realty Trust, Inc. | 0.04 | -69.89 | 1.39 | -70.57 | 0.6645 | -1.3442 | |||
| FR / First Industrial Realty Trust, Inc. | 0.03 | 1.38 | 0.6590 | 0.6590 | |||||
| RHP / Ryman Hospitality Properties, Inc. | 0.01 | -71.13 | 1.29 | -68.85 | 0.6173 | -1.1463 | |||
| CTRE / CareTrust REIT, Inc. | 0.04 | -76.02 | 1.20 | -74.34 | 0.5751 | -1.4179 | |||
| CUZ / Cousins Properties Incorporated | 0.04 | 132.32 | 1.11 | 136.60 | 0.5329 | 0.3324 | |||
| SLG / SL Green Realty Corp. | 0.02 | -174.42 | 1.01 | -179.83 | 0.4834 | 1.0223 | |||
| PECO / Phillips Edison & Company, Inc. | 0.03 | 0.99 | 0.4727 | 0.4727 | |||||
| MORGAN STANLEY & COMPANY USD MARGIN ACCOUNT / STIV (N/A) | 0.98 | 0.4717 | 0.4717 | ||||||
| MAC / The Macerich Company | 0.06 | -137.13 | 0.94 | -134.99 | 0.4522 | 1.6025 | |||
| EPR / EPR Properties | 0.02 | 193.76 | 0.94 | 225.61 | 0.4509 | 0.3275 | |||
| KRC / Kilroy Realty Corporation | 0.02 | -223.20 | 0.82 | -229.15 | 0.3946 | 0.6668 | |||
| SKT / Tanger Inc. | 0.03 | -79.61 | 0.78 | -81.56 | 0.3749 | -1.4328 | |||
| HIW / Highwoods Properties, Inc. | 0.02 | -79.43 | 0.76 | -78.42 | 0.3622 | -1.1315 | |||
| CDP / COPT Defense Properties | 0.03 | -35.43 | 0.69 | -34.72 | 0.3317 | -0.1203 | |||
| MPW / Medical Properties Trust, Inc. | 0.14 | 38.77 | 0.61 | -0.81 | 0.2931 | 0.0301 | |||
| FCPT / Four Corners Property Trust, Inc. | 0.02 | -118.60 | 0.61 | -117.43 | 0.2917 | 1.7804 | |||
| APLE / Apple Hospitality REIT, Inc. | 0.05 | -331.14 | 0.59 | -309.61 | 0.2822 | 0.4023 | |||
| Wells Fargo Margin Deposit / STIV (N/A) | 0.27 | 0.1285 | 0.1285 | ||||||
| CUSHMAN & WAKEFIELD - TRS / DE (N/A) | 0.08 | 0.25 | 0.1192 | 0.1192 | |||||
| VORNADO REALTY - TRS / DE (N/A) | 0.08 | 0.13 | 0.0642 | 0.0642 | |||||
| WP CAREY INC - TRS / DE (N/A) | 0.02 | 0.12 | 0.0597 | 0.0597 | |||||
| NNN REIT INC - TRS / DE (N/A) | 0.04 | 0.12 | 0.0590 | 0.0590 | |||||
| CBRE GROUP INC - A - TRS / DE (N/A) | 0.01 | 0.10 | 0.0492 | 0.0492 | |||||
| PLYMOUTH INDUSTRIAL - TRS / DE (N/A) | 0.04 | 0.09 | 0.0452 | 0.0452 | |||||
| SIMON PROPERTY GROUP - TRS / DE (N/A) | 0.01 | 0.08 | 0.0401 | 0.0401 | |||||
| AMERICAN TOWER CORP - TRS / DE (N/A) | 0.01 | 0.08 | 0.0396 | 0.0396 | |||||
| ZILLOW GROUP INC - C - TRS / DE (N/A) | 0.01 | 0.07 | 0.0319 | 0.0319 | |||||
| JONES LANG LASALLE I - TRS / DE (N/A) | 0.00 | 0.07 | 0.0312 | 0.0312 | |||||
| VICI PROPERTIES INC - TRS / DE (N/A) | 0.03 | 0.06 | 0.0293 | 0.0293 | |||||
| THE ST JOE CO - TRS / DE (N/A) | 0.01 | 0.06 | 0.0289 | 0.0289 | |||||
| KIMCO REALTY CORP - TRS / DE (N/A) | 0.04 | 0.03 | 0.0166 | 0.0166 | |||||
| SABRA HEALTH CARE RE - TRS / DE (N/A) | 0.04 | 0.03 | 0.0159 | 0.0159 | |||||
| DOUGLAS EMMETT INC - TRS / DE (N/A) | 0.02 | 0.03 | 0.0135 | 0.0135 | |||||
| ELME COMMUNITIES - TRS / DE (N/A) | 0.02 | 0.02 | 0.0119 | 0.0119 | |||||
| OUTFRONT MEDIA INC - TRS / DE (N/A) | 0.11 | 0.02 | 0.0087 | 0.0087 | |||||
| KENNEDY-WILSON HLDGS - TRS / DE (N/A) | 0.06 | 0.01 | 0.0041 | 0.0041 | |||||
| SAFEHOLD INC - TRS / DE (N/A) | 0.02 | 0.00 | 0.0020 | 0.0020 | |||||
| VENTAS INC - TRS / DE (N/A) | 0.00 | 0.00 | 0.0005 | 0.0005 | |||||
| WHITESTONE REIT - TRS / DE (N/A) | Short | -0.02 | 0.00 | 0.0004 | 0.0004 | ||||
| NXRT / NexPoint Residential Trust, Inc. | 0.00 | -98.73 | 0.00 | -100.00 | 0.0003 | -0.0223 | |||
| KILROY REALTY CORP - TRS / DE (N/A) | 0.00 | 0.00 | 0.0001 | 0.0001 | |||||
| WRE / Washington Real Estate Investment Trust | 0.00 | -100.00 | 0.00 | -100.00 | 0.0123 | ||||
| HEALTHPEAK PROPERTIE - TRS / DE (N/A) | 0.01 | -0.00 | -0.0000 | -0.0000 | |||||
| WELLTOWER INC - TRS / DE (N/A) | 0.00 | -0.00 | -0.0002 | -0.0002 | |||||
| HOST HOTELS & RESORT - TRS / DE (N/A) | 0.01 | -0.00 | -0.0004 | -0.0004 | |||||
| SUN COMMUNITIES INC - TRS / DE (N/A) | 0.00 | -0.00 | -0.0005 | -0.0005 | |||||
| COMPASS INC - CLASS - TRS / DE (N/A) | 0.02 | -0.00 | -0.0014 | -0.0014 | |||||
| NEXPOINT RESIDENTIAL - TRS / DE (N/A) | Short | -0.04 | -0.00 | -0.0016 | -0.0016 | ||||
| REGENCY CENTERS CORP - TRS / DE (N/A) | 0.01 | -0.01 | -0.0027 | -0.0027 | |||||
| GLOBAL MEDICAL REIT - TRS / DE (N/A) | Short | -0.02 | -0.01 | -0.0030 | -0.0030 | ||||
| MID-AMERICA APARTMEN - TRS / DE (N/A) | 0.01 | -0.01 | -0.0043 | -0.0043 | |||||
| JBG SMITH PROPERTIES - TRS / DE (N/A) | Short | -0.08 | -0.01 | -0.0043 | -0.0043 | ||||
| REALTY INCOME CORP - TRS / DE (N/A) | 0.02 | -0.01 | -0.0045 | -0.0045 | |||||
| PUBLIC STORAGE - TRS / DE (N/A) | 0.00 | -0.01 | -0.0048 | -0.0048 | |||||
| INNOVATIVE INDUSTRIA - TRS / DE (N/A) | 0.01 | -0.01 | -0.0059 | -0.0059 | |||||
| AGREE REALTY CORP - TRS / DE (N/A) | 0.02 | -0.01 | -0.0059 | -0.0059 | |||||
| LAMAR ADVERTISING CO - TRS / DE (N/A) | 0.01 | -0.02 | -0.0076 | -0.0076 | |||||
| HOWARD HUGHES HOLDIN - TRS / DE (N/A) | 0.02 | -0.02 | -0.0101 | -0.0101 | |||||
| INVENTRUST PPTYS COR - TRS / DE (N/A) | Short | -0.08 | -0.02 | -0.0103 | -0.0103 | ||||
| TANGER INC - TRS / DE (N/A) | 0.03 | -0.02 | -0.0104 | -0.0104 | |||||
| RAYONIER - TRS / DE (N/A) | 0.00 | -0.02 | -0.0104 | -0.0104 | |||||
| PROLOGIS INC - TRS / DE (N/A) | 0.01 | -0.03 | -0.0129 | -0.0129 | |||||
| RMR GROUP INC/THE - - TRS / DE (N/A) | Short | -0.03 | -0.03 | -0.0152 | -0.0152 | ||||
| KE HOLDINGS INC-ADR - TRS / DE (N/A) | 0.04 | -0.03 | -0.0160 | -0.0160 | |||||
| PEAKSTONE REALTY CL - TRS / DE (N/A) | Short | -0.02 | -0.03 | -0.0165 | -0.0165 | ||||
| PIEDMONT OFFICE REAL - TRS / DE (N/A) | Short | -0.03 | -0.04 | -0.0181 | -0.0181 | ||||
| COSTAR GROUP - TRS / DE (N/A) | Short | -0.01 | -0.04 | -0.0184 | -0.0184 | ||||
| AMERICAN ASSETS TRUS - TRS / DE (N/A) | 0.02 | -0.04 | -0.0186 | -0.0186 | |||||
| RYMAN HOSPITALITY PR - TRS / DE (N/A) | 0.03 | -0.04 | -0.0204 | -0.0204 | |||||
| Urban Edge Prop - TRS / DE (N/A) | Short | -0.05 | -0.05 | -0.0221 | -0.0221 | ||||
| ESSEX PROPERTY TRUST - TRS / DE (N/A) | 0.00 | -0.05 | -0.0238 | -0.0238 | |||||
| OMEGA HEALTHCARE INV - TRS / DE (N/A) | 0.03 | -0.05 | -0.0244 | -0.0244 | |||||
| NEWMARK GROUP INC-CL - TRS / DE (N/A) | Short | -0.18 | -0.07 | -0.0326 | -0.0326 | ||||
| EQUITY RESIDENTIAL - TRS / DE (N/A) | 0.03 | -0.07 | -0.0327 | -0.0327 | |||||
| POSTAL REALTY TRUST - TRS / DE (N/A) | Short | -0.04 | -0.08 | -0.0397 | -0.0397 | ||||
| REXFORD INDUSTRIAL R - TRS / DE (N/A) | 0.01 | -0.10 | -0.0492 | -0.0492 | |||||
| KITE REALTY GRP - TRS / DE (N/A) | Short | -0.06 | -0.12 | -0.0587 | -0.0587 | ||||
| EXPI / eXp World Holdings, Inc. | Short | -0.01 | -0.13 | -0.0642 | -0.0642 | ||||
| ALEXANDRIA REAL ESTA - TRS / DE (N/A) | 0.00 | -0.14 | -0.0666 | -0.0666 | |||||
| STHO / Star Holdings | Short | -0.02 | -0.16 | -0.0776 | -0.0776 | ||||
| BNL / Broadstone Net Lease, Inc. | Short | -0.01 | -0.19 | -0.0903 | -0.0903 | ||||
| BRT / BRT Apartments Corp. | Short | -0.01 | 94.21 | -0.21 | 79.31 | -0.0997 | -0.0500 | ||
| LINE / Lineage, Inc. | Short | -0.01 | -7.33 | -0.23 | -31.42 | -0.1090 | 0.0320 | ||
| AVALONBAY COMMUNITIE - TRS / DE (N/A) | 0.02 | -0.24 | -0.1152 | -0.1152 | |||||
| FRPH / FRP Holdings, Inc. | Short | -0.01 | -0.27 | -0.1271 | -0.1271 | ||||
| PINE / Alpine Income Property Trust, Inc. | Short | -0.02 | -2,307.57 | -0.30 | -2,066.67 | -0.1417 | -0.1482 | ||
| PEB / Pebblebrook Hotel Trust | Short | -0.03 | -24.49 | -0.31 | -25.42 | -0.1475 | 0.0288 | ||
| UHT / Universal Health Realty Income Trust | Short | -0.01 | -20.83 | -0.40 | -22.91 | -0.1906 | 0.0290 | ||
| MMI / Marcus & Millichap, Inc. | Short | -0.01 | -0.40 | -0.1913 | -0.1913 | ||||
| WY / Weyerhaeuser Company | Short | -0.02 | -0.51 | -0.2456 | -0.2456 | ||||
| CHCT / Community Healthcare Trust Incorporated | Short | -0.03 | -32.16 | -0.54 | -37.89 | -0.2593 | 0.1121 | ||
| SEG / Seaport Entertainment Group Inc. | Short | -0.03 | -0.54 | -0.2607 | -0.2607 | ||||
| TRC / Tejon Ranch Co. | Short | -0.03 | -0.55 | -0.2615 | -0.2615 | ||||
| ALEX / Alexander & Baldwin, Inc. | Short | -0.03 | -186.87 | -0.60 | -189.89 | -0.2856 | -0.5682 | ||
| UMH / UMH Properties, Inc. | Short | -0.04 | 23.50 | -0.60 | 10.83 | -0.2897 | -0.0572 | ||
| TRNO / Terreno Realty Corporation | Short | -0.01 | -72.50 | -0.62 | -75.62 | -0.2958 | 0.7833 | ||
| NLOP / Net Lease Office Properties | Short | -0.02 | -0.66 | -0.3167 | -0.3167 | ||||
| FVR / FrontView REIT, Inc. | Short | -0.06 | -0.76 | -0.3632 | -0.3632 | ||||
| LAND / Gladstone Land Corporation | Short | -0.08 | -3,132.39 | -0.79 | -3,119.23 | -0.3762 | -0.3876 | ||
| CPT / Camden Property Trust | Short | -0.01 | -282.09 | -0.79 | -267.74 | -0.3764 | -0.5760 | ||
| FOR / Forestar Group Inc. | Short | -0.04 | -0.90 | -0.4301 | -0.4301 | ||||
| DRH / DiamondRock Hospitality Company | Short | -0.12 | 41.81 | -0.93 | 40.79 | -0.4466 | -0.1642 | ||
| CCI / Crown Castle Inc. | Short | -0.01 | -3.59 | -1.07 | 9.10 | -0.5114 | -0.1418 | ||
| ALX / Alexander's, Inc. | Short | -0.01 | 66.34 | -1.18 | 79.33 | -0.5652 | -0.2845 | ||
| CTO / CTO Realty Growth, Inc. | Short | -0.07 | 131.76 | -1.27 | 107.17 | -0.6095 | -0.3477 | ||
| XHR / Xenia Hotels & Resorts, Inc. | Short | -0.11 | -36.74 | -1.41 | -32.39 | -0.6751 | 0.2135 | ||
| COLD / Americold Realty Trust, Inc. | Short | -0.10 | -17.99 | -1.62 | -36.45 | -0.7741 | 0.3099 | ||
| CSR / Centerspace | Short | -0.03 | -2,565.46 | -1.96 | -2,409.41 | -0.9402 | -0.9767 | ||
| CURB / Curbline Properties Corp. | Short | -0.10 | -44.76 | -2.20 | -47.88 | -1.0534 | 0.7447 | ||
| HR / Healthcare Realty Trust Incorporated | Short | -0.14 | -19.79 | -2.26 | -24.72 | -1.0807 | 0.1969 | ||
| MRP / Millrose Properties, Inc. | Short | -0.10 | -2.81 | -1.3464 | -1.3464 | ||||
| CLI / Mack-Cali Realty Corp. | Short | -0.19 | 278.34 | -2.87 | 232.91 | -1.3762 | -1.0083 |