Statistik Asas
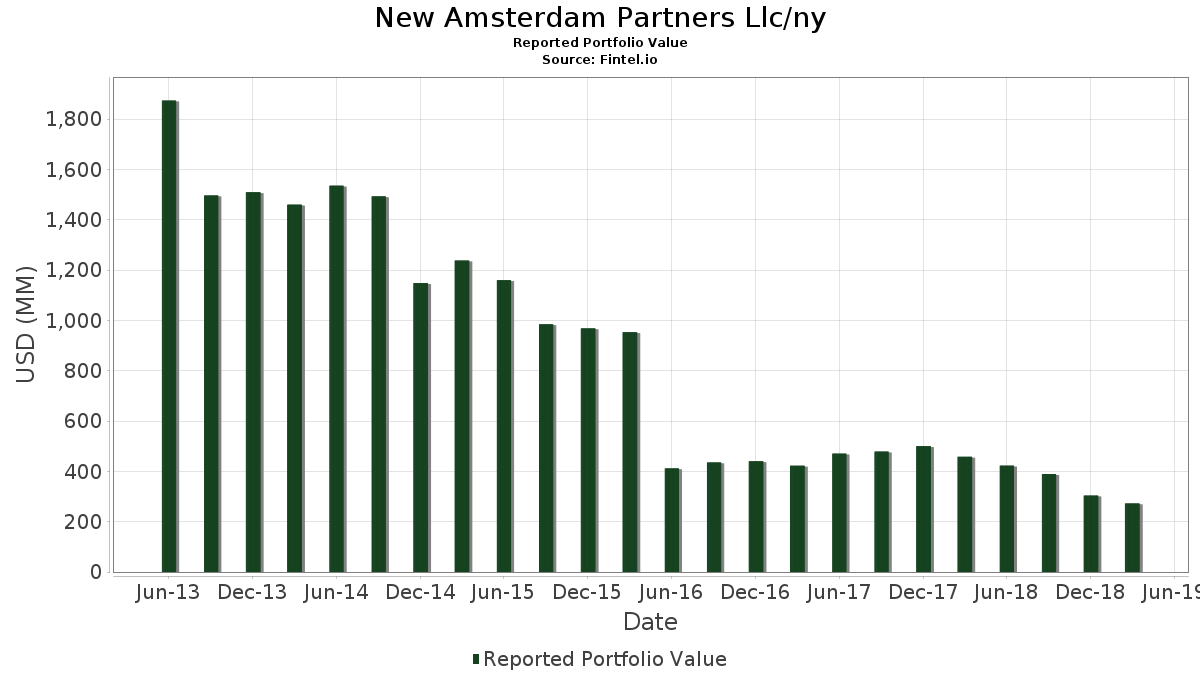
| Nilai Portfolio | $ 272,449,000 |
| Kedudukan Semasa | 108 |
Pegangan Terkini, Prestasi, AUM (dari 13F, 13D)
New Amsterdam Partners Llc/ny telah mendedahkan 108 jumlah pegangan dalam pemfailan SEC terkini mereka. Nilai portfolio terkini dikira sebagai $ 272,449,000 USD. Aset Sebenar Di Bawah Pengurusan (AUM) ialah nilai ini ditambah dengan tunai (yang tidak didedahkan). Pegangan teratas New Amsterdam Partners Llc/ny ialah Masimo Corporation (US:MASI) , Gray Media, Inc. (US:GTN) , Manhattan Associates, Inc. (US:MANH) , Insperity, Inc. (US:NSP) , and Walker & Dunlop, Inc. (US:WD) . Kedudukan baharu New Amsterdam Partners Llc/ny termasuk QuidelOrtho Corporation (US:QDEL) , Senior Housing Properties Trust (US:SNH) , Altra Industrial Motion Corp (US:AIMC) , Perficient, Inc. (US:PRFT) , and ScanSource, Inc. (US:SCSC) .
Kenaikan Teratas Suku Tahun Ini
Kami menggunakan perubahan dalam peruntukan portfolio kerana ini adalah metrik yang paling bermakna. Perubahan boleh disebabkan oleh perdagangan atau perubahan dalam harga saham.
| Sekuriti | Saham (MM) |
Nilai (MM$) |
Portfolio % | ΔPortfolio % |
|---|---|---|---|---|
| 0.07 | 9.86 | 3.6190 | 3.6190 | |
| 0.44 | 9.32 | 3.4216 | 3.4216 | |
| 0.16 | 8.93 | 3.2784 | 3.2784 | |
| 0.06 | 7.82 | 2.8692 | 2.8692 | |
| 0.15 | 7.68 | 2.8203 | 2.8203 | |
| 0.04 | 7.64 | 2.8042 | 2.8042 | |
| 0.19 | 7.59 | 2.7873 | 2.7873 | |
| 0.14 | 5.89 | 2.1619 | 2.1619 | |
| 0.10 | 5.69 | 2.0896 | 2.0896 | |
| 0.17 | 5.37 | 1.9717 | 1.9717 |
Penurunan Teratas Suku Tahun Ini
Kami menggunakan perubahan dalam peruntukan portfolio kerana ini adalah metrik yang paling bermakna. Perubahan boleh disebabkan oleh perdagangan atau perubahan dalam harga saham.
| Sekuriti | Saham (MM) |
Nilai (MM$) |
Portfolio % | ΔPortfolio % |
|---|---|---|---|---|
| 0.12 | 6.23 | 2.2863 | -1.5601 | |
| 0.00 | 0.00 | -1.1197 | ||
| 0.02 | 1.46 | 0.5355 | -0.7656 | |
| 0.00 | 0.00 | -0.7052 | ||
| 0.00 | 0.00 | -0.5762 | ||
| 0.00 | 0.00 | -0.4655 | ||
| 0.02 | 1.40 | 0.5131 | -0.4084 | |
| 0.00 | 0.00 | -0.4076 | ||
| 0.25 | 6.88 | 2.5263 | -0.3686 | |
| 0.04 | 3.09 | 1.1334 | -0.3386 |
13F dan Pemfailan Dana
Borang ini telah difailkan pada 2019-05-02 untuk tempoh pelaporan 2019-03-31. Klik ikon pautan untuk melihat sejarah transaksi penuh.
Tingkatkan untuk membuka data premium dan eksport ke Excel ![]() .
.
| Sekuriti | Jenis | Purata Harga Saham | Saham (MM) |
ΔSaham (%) |
ΔSaham (%) |
Nilai ($MM) |
Portfolio (%) |
ΔPortfolio (%) |
|
|---|---|---|---|---|---|---|---|---|---|
| MASI / Masimo Corporation | 0.07 | -23.15 | 9.86 | -1.02 | 3.6190 | 3.6190 | |||
| GTN / Gray Media, Inc. | 0.44 | -14.68 | 9.32 | 23.63 | 3.4216 | 3.4216 | |||
| MANH / Manhattan Associates, Inc. | 0.16 | -22.34 | 8.93 | 1.02 | 3.2784 | 3.2784 | |||
| NSP / Insperity, Inc. | 0.06 | -10.51 | 7.82 | 18.53 | 2.8692 | 2.8692 | |||
| WD / Walker & Dunlop, Inc. | 0.15 | -13.20 | 7.68 | 2.18 | 2.8203 | 2.8203 | |||
| CACI / CACI International Inc | 0.04 | -2.30 | 7.64 | 23.46 | 2.8042 | 2.8042 | |||
| GIII / G-III Apparel Group, Ltd. | 0.19 | 108.96 | 7.59 | 199.45 | 2.7873 | 2.7873 | |||
| HF / Tidal Trust II - DGA Core Plus Absolute Return ETF | 0.16 | -10.57 | 7.58 | 28.78 | 2.7840 | 0.8448 | |||
| AEL / American Equity Investment Life Holding Company | 0.25 | -19.06 | 6.88 | -21.72 | 2.5263 | -0.3686 | |||
| EBS / Emergent BioSolutions Inc. | 0.12 | -37.44 | 6.23 | -46.68 | 2.2863 | -1.5601 | |||
| SAM / The Boston Beer Company, Inc. | 0.02 | -4.52 | 6.17 | 16.84 | 2.2639 | 0.5259 | |||
| FHI / Federated Hermes, Inc. | 0.21 | -23.63 | 6.14 | -15.70 | 2.2533 | -0.1442 | |||
| CRUS / Cirrus Logic, Inc. | 0.14 | -26.52 | 5.89 | -6.83 | 2.1619 | 2.1619 | |||
| ORA / Ormat Technologies, Inc. | 0.10 | -14.08 | 5.69 | -9.40 | 2.0896 | 2.0896 | |||
| UI / Ubiquiti Inc. | 0.04 | -2.61 | 5.52 | 46.66 | 2.0257 | 0.7868 | |||
| WCC / WESCO International, Inc. | 0.10 | -14.40 | 5.45 | -5.47 | 1.9985 | 0.1022 | |||
| PBF / PBF Energy Inc. | 0.17 | -2.57 | 5.37 | -7.12 | 1.9717 | 1.9717 | |||
| AAWW / Atlas Air Worldwide Holdings Inc. | 0.10 | -14.72 | 5.10 | 2.20 | 1.8723 | 1.8723 | |||
| QDEL / QuidelOrtho Corporation | 0.07 | 4.31 | 1.5805 | 1.5805 | |||||
| TEN / Tsakos Energy Navigation Limited | 0.19 | 50.28 | 4.30 | 21.59 | 1.5794 | 1.5794 | |||
| WOR / Worthington Enterprises, Inc. | 0.11 | -24.58 | 4.29 | -19.22 | 1.5739 | 1.5739 | |||
| US4989042001 / Knoll Inc | 0.22 | -17.57 | 4.16 | -5.41 | 1.5262 | 1.5262 | |||
| SNH / Senior Housing Properties Trust | 0.33 | 3.84 | 1.4098 | 1.4098 | |||||
| CPK / Chesapeake Utilities Corporation | 0.04 | -3.15 | 3.73 | 8.66 | 1.3672 | 0.2386 | |||
| TMHC / Taylor Morrison Home Corporation | 0.21 | 9.35 | 3.72 | 22.09 | 1.3654 | 1.3654 | |||
| ENSG / The Ensign Group, Inc. | 0.07 | 3.71 | 1.3610 | 1.3610 | |||||
| PETS / PetMed Express, Inc. | 0.16 | 56.29 | 3.56 | 53.05 | 1.3067 | 1.3067 | |||
| EEFT / Euronet Worldwide, Inc. | 0.02 | -50.48 | 3.53 | -31.03 | 1.2942 | 1.2942 | |||
| AIMC / Altra Industrial Motion Corp | 0.11 | 3.34 | 1.2259 | 1.2259 | |||||
| NSIT / Insight Enterprises, Inc. | 0.06 | 3.29 | 1.2083 | 1.2083 | |||||
| PRFT / Perficient, Inc. | 0.12 | 3.21 | 1.1767 | 1.1767 | |||||
| CUBI / Customers Bancorp, Inc. | 0.17 | 0.23 | 3.20 | 0.82 | 1.1742 | 1.1742 | |||
| GPI / Group 1 Automotive, Inc. | 0.05 | -2.37 | 3.10 | 19.81 | 1.1364 | 1.1364 | |||
| ARW / Arrow Electronics, Inc. | 0.04 | -38.20 | 3.09 | -30.93 | 1.1334 | -0.3386 | |||
| CSL / Carlisle Companies Incorporated | 0.02 | 647.30 | 2.90 | 811.32 | 1.0637 | 1.0637 | |||
| VRTS / Virtus Investment Partners, Inc. | 0.03 | 0.17 | 2.88 | 22.98 | 1.0567 | 0.2860 | |||
| MTH / Meritage Homes Corporation | 0.06 | -34.97 | 2.83 | -20.81 | 1.0376 | 1.0376 | |||
| LII / Lennox International Inc. | 0.01 | 541.03 | 2.78 | 675.42 | 1.0189 | 0.9010 | |||
| IDCC / InterDigital, Inc. | 0.04 | -2.90 | 2.76 | -3.56 | 1.0130 | 1.0130 | |||
| ENS / EnerSys | 0.04 | -2.53 | 2.72 | -18.17 | 0.9984 | -0.0960 | |||
| TDS / Telephone and Data Systems, Inc. | 0.09 | 3.35 | 2.72 | -2.40 | 0.9980 | 0.9980 | |||
| URI / United Rentals, Inc. | 0.02 | -39.54 | 2.63 | -32.62 | 0.9661 | -0.3199 | |||
| SCSC / ScanSource, Inc. | 0.07 | 2.59 | 0.9517 | 0.9517 | |||||
| CPRT / Copart, Inc. | 0.04 | -7.76 | 2.59 | 16.99 | 0.9503 | 0.9503 | |||
| ALGT / Allegiant Travel Company | 0.02 | 2.50 | 0.9187 | 0.9187 | |||||
| MPW / Medical Properties Trust, Inc. | 0.13 | -9.33 | 2.37 | 4.36 | 0.8699 | 0.8699 | |||
| PAG / Penske Automotive Group, Inc. | 0.05 | -33.65 | 2.35 | -26.51 | 0.8636 | 0.8636 | |||
| SIVB / SVB Financial Group | 0.01 | -9.68 | 2.32 | 5.74 | 0.8515 | 0.1292 | |||
| MMI / Marcus & Millichap, Inc. | 0.06 | 2.24 | 0.8236 | 0.8236 | |||||
| NR / NPK International Inc. | 0.24 | -0.34 | 2.17 | 32.86 | 0.7983 | 0.7983 | |||
| MMS / Maximus, Inc. | 0.03 | -25.57 | 2.17 | -18.85 | 0.7950 | 0.7950 | |||
| COMM / CommScope Holding Company, Inc. | 0.09 | -32.77 | 2.04 | -10.88 | 0.7484 | 0.7484 | |||
| EHC / Encompass Health Corporation | 0.03 | 9.82 | 1.97 | 3.95 | 0.7238 | 0.7238 | |||
| RS / Reliance, Inc. | 0.02 | -4.88 | 1.84 | 20.68 | 0.6746 | 0.1732 | |||
| JLL / Jones Lang LaSalle Incorporated | 0.01 | 1.83 | 0.6724 | 0.6724 | |||||
| UNFI / United Natural Foods, Inc. | 0.14 | 0.18 | 1.82 | 25.09 | 0.6680 | 0.6680 | |||
| WIRE / Encore Wire Corporation | 0.03 | 39.68 | 1.77 | 59.26 | 0.6500 | 0.6500 | |||
| COR / Cencora, Inc. | 0.02 | -18.10 | 1.75 | 17.87 | 0.6416 | 0.1533 | |||
| OSK / Oshkosh Corporation | 0.02 | 10.04 | 1.74 | 34.88 | 0.6401 | 0.2144 | |||
| DISCA / Discovery Inc - Class A | 0.06 | -39.26 | 1.74 | -33.65 | 0.6390 | -0.2249 | |||
| NFG / National Fuel Gas Company | 0.03 | -6.29 | 1.70 | 11.59 | 0.6254 | 0.6254 | |||
| IPAR / Interparfums, Inc. | 0.02 | -68.10 | 1.46 | -63.08 | 0.5355 | -0.7656 | |||
| FL / Foot Locker, Inc. | 0.02 | -56.15 | 1.40 | -50.05 | 0.5131 | -0.4084 | |||
| / U.S. Concrete, Inc. | 0.03 | -2.21 | 1.38 | 14.85 | 0.5054 | 0.5054 | |||
| EVR / Evercore Inc. | 0.01 | 1.35 | 0.4951 | 0.4951 | |||||
| UTHR / United Therapeutics Corporation | 0.01 | -7.90 | 1.29 | -0.69 | 0.4742 | 0.0459 | |||
| PGTI / PGT Innovations, Inc. | 0.09 | 1.26 | 0.4632 | 0.4632 | |||||
| DDS / Dillard's, Inc. | 0.02 | 1.22 | 0.4474 | 0.4474 | |||||
| NGVT / Ingevity Corporation | 0.01 | 1.18 | 0.4342 | 0.4342 | |||||
| ALGN / Align Technology, Inc. | 0.00 | -65.15 | 1.16 | -52.66 | 0.4243 | 0.4243 | |||
| NTCT / NetScout Systems, Inc. | 0.03 | -64.92 | 0.92 | -58.35 | 0.3358 | 0.3358 | |||
| CCMP / CMC Materials Inc | 0.01 | 0.88 | 0.3241 | 0.3241 | |||||
| TYL / Tyler Technologies, Inc. | 0.00 | 0.82 | 0.3024 | 0.3024 | |||||
| XEC / Cimarex Energy Co. | 0.01 | 8.54 | 0.79 | 23.05 | 0.2900 | 0.0786 | |||
| AL / Air Lease Corporation | 0.02 | -59.60 | 0.77 | -54.04 | 0.2815 | 0.2815 | |||
| WEX / WEX Inc. | 0.00 | -65.33 | 0.73 | -52.46 | 0.2694 | 0.2694 | |||
| ABC / Amerisource Bergen Corp. | 0.01 | 0.58 | 0.2144 | -0.2739 | |||||
| INTU / Intuit Inc. | 0.00 | -1.39 | 0.57 | 30.98 | 0.2110 | 0.2110 | |||
| CBM / Cambrex Corp. | 0.01 | -89.50 | 0.51 | -89.21 | 0.1872 | 0.1872 | |||
| SSNC / SS&C Technologies Holdings, Inc. | 0.01 | 0.84 | 0.49 | 42.40 | 0.1787 | 0.1787 | |||
| ANET / Arista Networks Inc | 0.00 | 0.47 | 0.47 | 50.16 | 0.1725 | 0.0695 | |||
| TJX / The TJX Companies, Inc. | 0.01 | -1.62 | 0.47 | 17.09 | 0.1710 | 0.0400 | |||
| TSCO / Tractor Supply Company | 0.00 | -4.47 | 0.42 | 11.94 | 0.1549 | 0.0308 | |||
| FTNT / Fortinet, Inc. | 0.00 | 0.42 | 0.1527 | 0.1527 | |||||
| ADBE / Adobe Inc. | 0.00 | 2.53 | 0.39 | 20.81 | 0.1428 | 0.0368 | |||
| NFLX / Netflix, Inc. | 0.00 | -1.05 | 0.37 | 31.79 | 0.1354 | 0.0433 | |||
| REGN / Regeneron Pharmaceuticals, Inc. | 0.00 | -3.45 | 0.37 | 6.05 | 0.1351 | 0.0208 | |||
| EQIX / Equinix, Inc. | 0.00 | 1.26 | 0.36 | 30.11 | 0.1332 | 0.1332 | |||
| MTD / Mettler-Toledo International Inc. | 0.00 | -2.60 | 0.35 | 24.38 | 0.1292 | 0.0360 | |||
| BBY / Best Buy Co., Inc. | 0.00 | -2.04 | 0.35 | 31.70 | 0.1281 | 0.0409 | |||
| ORLY / O'Reilly Automotive, Inc. | 0.00 | -35.77 | 0.34 | -27.60 | 0.1252 | -0.0299 | |||
| GL / Globe Life Inc. | 0.00 | 2.23 | 0.32 | 12.50 | 0.1189 | 0.0241 | |||
| CLX / The Clorox Company | 0.00 | -1.88 | 0.31 | 1.98 | 0.1134 | 0.0137 | |||
| CDNS / Cadence Design Systems, Inc. | 0.00 | 0.30 | 0.1094 | 0.1094 | |||||
| EW / Edwards Lifesciences Corporation | 0.00 | -32.43 | 0.30 | -15.62 | 0.1090 | -0.0069 | |||
| WBC / Wabco Holdings, Inc. | 0.00 | 0.30 | 0.1090 | 0.1090 | |||||
| AMAT / Applied Materials, Inc. | 0.01 | 2.21 | 0.29 | 23.63 | 0.1075 | 0.1075 | |||
| RES / RPC, Inc. | 0.03 | -65.45 | 0.29 | -60.11 | 0.1057 | -0.1320 | |||
| LH / Labcorp Holdings Inc. | 0.00 | 2.24 | 0.29 | 23.71 | 0.1053 | 0.0290 | |||
| AKAM / Akamai Technologies, Inc. | 0.00 | 0.27 | 0.0991 | 0.0991 | |||||
| TROW / T. Rowe Price Group, Inc. | 0.00 | 2.82 | 0.25 | 11.50 | 0.0925 | 0.0181 | |||
| AYI / Acuity Inc. | 0.00 | 1.85 | 0.25 | 6.36 | 0.0921 | 0.0921 | |||
| PFG / Principal Financial Group, Inc. | 0.00 | 3.14 | 0.24 | 16.91 | 0.0888 | 0.0888 | |||
| OKE / ONEOK, Inc. | 0.00 | 0.23 | 0.0855 | 0.0855 | |||||
| ALB / Albemarle Corporation | 0.00 | 4.78 | 0.23 | 11.82 | 0.0833 | 0.0165 | |||
| TRIP / Tripadvisor, Inc. | 0.00 | 0.22 | 0.0800 | 0.0800 | |||||
| ILMN / Illumina, Inc. | 0.00 | 0.21 | 0.0789 | 0.0789 | |||||
| GRBK / Green Brick Partners, Inc. | 0.01 | 0.12 | 0.0429 | 0.0429 | |||||
| PLUS / ePlus inc. | 0.00 | -100.00 | 0.00 | -100.00 | 0.0000 | ||||
| BIG / Big Lots, Inc. | 0.00 | -100.00 | 0.00 | -100.00 | -0.2933 | ||||
| CBRE / CBRE Group, Inc. | 0.00 | -100.00 | 0.00 | -100.00 | -0.5762 | ||||
| RGA / Reinsurance Group of America, Incorporated | 0.00 | -100.00 | 0.00 | -100.00 | -0.4655 | ||||
| LFUS / Littelfuse, Inc. | 0.00 | -100.00 | 0.00 | -100.00 | -0.7052 | ||||
| SZY / Sykes Enterprises, Inc. | 0.00 | -100.00 | 0.00 | -100.00 | 0.0000 | ||||
| PCH / PotlatchDeltic Corporation | 0.00 | -100.00 | 0.00 | -100.00 | 0.0000 | ||||
| IWR / iShares Trust - iShares Russell Mid-Cap ETF | 0.00 | -100.00 | 0.00 | -100.00 | -1.1197 | ||||
| MKSI / MKS Inc. | 0.00 | -100.00 | 0.00 | -100.00 | 0.0000 | ||||
| US7587501039 / Regal-Beloit Corp. | 0.00 | -100.00 | 0.00 | -100.00 | 0.0000 | ||||
| SNA / Snap-on Incorporated | 0.00 | -100.00 | 0.00 | -100.00 | 0.0000 | ||||
| APOG / Apogee Enterprises, Inc. | 0.00 | -100.00 | 0.00 | -100.00 | -0.4076 | ||||
| AMN / AMN Healthcare Services, Inc. | 0.00 | -100.00 | 0.00 | -100.00 | 0.0000 | ||||
| IJH / iShares Trust - iShares Core S&P Mid-Cap ETF | 0.00 | -100.00 | 0.00 | -100.00 | 0.0000 | 0.0000 | |||
| AWI / Armstrong World Industries, Inc. | 0.00 | -100.00 | 0.00 | -100.00 | 0.0000 | ||||
| TOL / Toll Brothers, Inc. | 0.00 | -100.00 | 0.00 | -100.00 | 0.0000 | ||||
| FUL / H.B. Fuller Company | 0.00 | -100.00 | 0.00 | -100.00 | 0.0000 | ||||
| NTRI / NutriSystem, Inc. | 0.00 | -100.00 | 0.00 | -100.00 | 0.0000 | ||||
| IWP / iShares Trust - iShares Russell Mid-Cap Growth ETF | 0.00 | -100.00 | 0.00 | -100.00 | 0.0000 | ||||
| TREX / Trex Company, Inc. | 0.00 | -100.00 | 0.00 | -100.00 | 0.0000 | ||||
| GMED / Globus Medical, Inc. | 0.00 | -100.00 | 0.00 | -100.00 | 0.0000 | ||||
| EXLS / ExlService Holdings, Inc. | 0.00 | -100.00 | 0.00 | -100.00 | 0.0000 | ||||
| FLT / Corpay, Inc. | 0.00 | -100.00 | 0.00 | -100.00 | 0.0000 | ||||
| HA / Hawaiian Holdings, Inc. | 0.00 | -100.00 | 0.00 | -100.00 | 0.0000 | ||||
| CTXS / Citrix Systems, Inc. | 0.00 | -100.00 | 0.00 | -100.00 | 0.0000 | ||||
| US0352901054 / Anixter International, Inc. | 0.00 | -100.00 | 0.00 | -100.00 | 0.0000 | ||||
| ACCO / ACCO Brands Corporation | 0.00 | -100.00 | 0.00 | -100.00 | 0.0000 | ||||
| SPY / SPDR S&P 500 ETF | 0.00 | -100.00 | 0.00 | -100.00 | 0.0000 | ||||
| OUT / OUTFRONT Media Inc. | 0.00 | -100.00 | 0.00 | -100.00 | 0.0000 | ||||
| HUN / Huntsman Corporation | 0.00 | -100.00 | 0.00 | -100.00 | 0.0000 | ||||
| CAL / Caleres, Inc. | 0.00 | -100.00 | 0.00 | -100.00 | 0.0000 | ||||
| TVTY / Tivity Health Inc | 0.00 | -100.00 | 0.00 | -100.00 | 0.0000 |