Statistik Asas
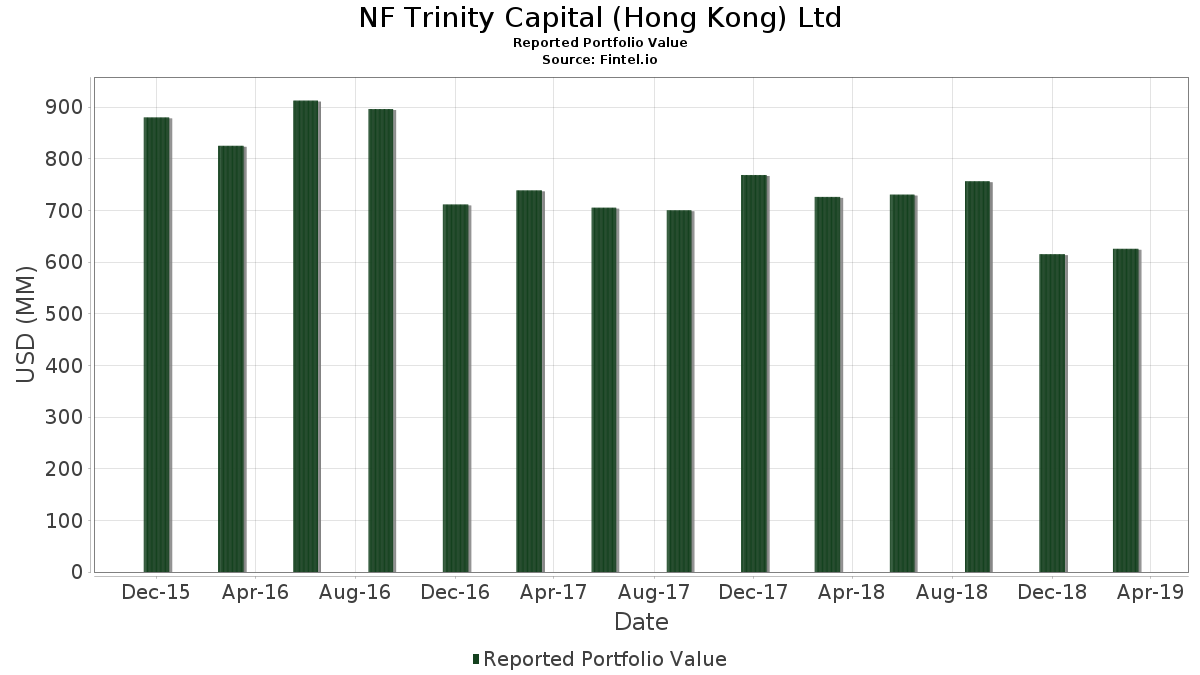
| Nilai Portfolio | $ 625,843,000 |
| Kedudukan Semasa | 39 |
Pegangan Terkini, Prestasi, AUM (dari 13F, 13D)
NF Trinity Capital (Hong Kong) Ltd telah mendedahkan 39 jumlah pegangan dalam pemfailan SEC terkini mereka. Nilai portfolio terkini dikira sebagai $ 625,843,000 USD. Aset Sebenar Di Bawah Pengurusan (AUM) ialah nilai ini ditambah dengan tunai (yang tidak didedahkan). Pegangan teratas NF Trinity Capital (Hong Kong) Ltd ialah Alibaba Group Holding Limited - Depositary Receipt (Common Stock) (US:BABA) , Alphabet Inc. (US:GOOGL) , Meta Platforms, Inc. (US:META) , Bank of America Corporation (US:BAC) , and The Walt Disney Company (US:DIS) .
Kenaikan Teratas Suku Tahun Ini
Kami menggunakan perubahan dalam peruntukan portfolio kerana ini adalah metrik yang paling bermakna. Perubahan boleh disebabkan oleh perdagangan atau perubahan dalam harga saham.
| Sekuriti | Saham (MM) |
Nilai (MM$) |
Portfolio % | ΔPortfolio % |
|---|---|---|---|---|
| 1.38 | 41.49 | 6.6303 | 6.6303 | |
| 0.01 | 16.66 | 2.6618 | 2.6618 | |
| 0.63 | 115.58 | 18.4681 | 2.5047 | |
| 0.16 | 14.32 | 2.2876 | 2.2876 | |
| 0.05 | 63.70 | 10.1791 | 0.9886 | |
| 0.08 | 11.15 | 1.7819 | 0.7932 | |
| 0.38 | 42.71 | 6.8246 | 0.7930 | |
| 0.00 | 3.07 | 0.4907 | 0.4907 | |
| 0.03 | 2.67 | 0.4260 | 0.4260 | |
| 0.28 | 17.47 | 2.7913 | 0.4165 |
Penurunan Teratas Suku Tahun Ini
Kami menggunakan perubahan dalam peruntukan portfolio kerana ini adalah metrik yang paling bermakna. Perubahan boleh disebabkan oleh perdagangan atau perubahan dalam harga saham.
| Sekuriti | Saham (MM) |
Nilai (MM$) |
Portfolio % | ΔPortfolio % |
|---|---|---|---|---|
| 0.00 | 0.00 | -1.3723 | ||
| 0.00 | 0.00 | -1.1193 | ||
| 0.04 | 7.33 | 1.1720 | -1.0249 | |
| 0.00 | 0.00 | -1.0082 | ||
| 0.13 | 21.82 | 3.4870 | -0.6847 | |
| 0.00 | 0.00 | -0.6834 | ||
| 1.72 | 47.53 | 7.5949 | -0.6802 | |
| 0.50 | 10.37 | 1.6565 | -0.5261 | |
| 0.08 | 6.91 | 1.1038 | -0.4009 | |
| 0.00 | 0.00 | -0.2619 |
13F dan Pemfailan Dana
Borang ini telah difailkan pada 2019-05-10 untuk tempoh pelaporan 2019-03-31. Klik ikon pautan untuk melihat sejarah transaksi penuh.
Tingkatkan untuk membuka data premium dan eksport ke Excel ![]() .
.
| Sekuriti | Jenis | Purata Harga Saham | Saham (MM) |
ΔSaham (%) |
ΔSaham (%) |
Nilai ($MM) |
Portfolio (%) |
ΔPortfolio (%) |
|
|---|---|---|---|---|---|---|---|---|---|
| BABA / Alibaba Group Holding Limited - Depositary Receipt (Common Stock) | 0.63 | -11.62 | 115.58 | 17.64 | 18.4681 | 2.5047 | |||
| GOOGL / Alphabet Inc. | 0.05 | 0.00 | 63.70 | 12.62 | 10.1791 | 0.9886 | |||
| META / Meta Platforms, Inc. | 0.30 | -16.68 | 50.18 | 5.95 | 8.0183 | 0.3224 | |||
| BAC / Bank of America Corporation | 1.72 | -16.65 | 47.53 | -6.67 | 7.5949 | -0.6802 | |||
| DIS / The Walt Disney Company | 0.38 | 13.63 | 42.71 | 15.06 | 6.8246 | 0.7930 | |||
| JD / JD.com, Inc. - Depositary Receipt (Common Stock) | 1.38 | -23.69 | 41.49 | 9.93 | 6.6303 | 6.6303 | |||
| BIDU / Baidu, Inc. - Depositary Receipt (Common Stock) | 0.13 | -18.22 | 21.82 | -15.00 | 3.4870 | -0.6847 | |||
| NXPI / NXP Semiconductors N.V. | 0.22 | -19.16 | 19.76 | -2.49 | 3.1580 | -0.1353 | |||
| C / Citigroup Inc. | 0.28 | 0.00 | 17.47 | 19.52 | 2.7913 | 0.4165 | |||
| AMZN / Amazon.com, Inc. | 0.01 | 6.98 | 16.66 | 26.83 | 2.6618 | 2.6618 | |||
| 018490100 / Allergan plc | 0.11 | 0.00 | 15.88 | 9.54 | 2.5371 | 0.1819 | |||
| EDU / New Oriental Education & Technology Group Inc. - Depositary Receipt (Common Stock) | 0.16 | 0.00 | 14.32 | 64.37 | 2.2876 | 2.2876 | |||
| OLED / Universal Display Corporation | 0.08 | -43.49 | 12.13 | -7.69 | 1.9390 | -0.1970 | |||
| XLE / The Select Sector SPDR Trust - The Energy Select Sector SPDR Fund | 0.18 | 0.00 | 11.66 | 15.29 | 1.8624 | 0.2198 | |||
| US0153511094 / Alexion Pharmaceuticals, Inc. | 0.08 | 32.00 | 11.15 | 83.27 | 1.7819 | 0.7932 | |||
| ON / ON Semiconductor Corporation | 0.50 | -38.05 | 10.37 | -22.82 | 1.6565 | -0.5261 | |||
| LBTYA / Liberty Global Ltd. | 0.38 | 2.57 | 9.35 | 19.78 | 1.4941 | 0.2257 | |||
| WB / Weibo Corporation - Depositary Receipt (Common Stock) | 0.15 | 0.00 | 9.12 | 6.10 | 1.4566 | 0.0606 | |||
| ZAYO / Zayo Group Holdings, Inc. | 0.30 | 0.00 | 8.62 | 24.44 | 1.3773 | 0.2518 | |||
| ADSK / Autodesk, Inc. | 0.06 | 0.00 | 8.57 | 21.15 | 1.3694 | 0.2200 | |||
| V / Visa Inc. | 0.05 | 0.00 | 8.43 | 18.37 | 1.3476 | 0.1900 | |||
| AAPL / Apple Inc. | 0.04 | -54.95 | 7.33 | -45.75 | 1.1720 | -1.0249 | |||
| ATUS / Altice USA, Inc. | 0.34 | 0.00 | 7.28 | 30.03 | 1.1637 | 0.2537 | |||
| BMRN / BioMarin Pharmaceutical Inc. | 0.08 | -28.50 | 6.91 | -25.41 | 1.1038 | -0.4009 | |||
| BMY / Bristol-Myers Squibb Company | 0.14 | 47.31 | 6.54 | 35.21 | 1.0444 | 0.2589 | |||
| GILD / Gilead Sciences, Inc. | 0.09 | 0.00 | 5.65 | 3.93 | 0.9033 | 0.0195 | |||
| TAL / TAL Education Group - Depositary Receipt (Common Stock) | 0.14 | -36.71 | 5.22 | -14.42 | 0.8347 | -0.1571 | |||
| IBB / iShares Trust - iShares Biotechnology ETF | 0.04 | 0.00 | 4.83 | 15.94 | 0.7718 | 0.0949 | |||
| DB / Deutsche Bank Aktiengesellschaft | 0.53 | 0.00 | 4.33 | 1.79 | 0.6923 | 0.0007 | |||
| SAGE / Sage Therapeutics, Inc. | 0.02 | -40.59 | 3.07 | -1.35 | 0.4909 | -0.0151 | |||
| BKNG / Booking Holdings Inc. | 0.00 | 3.07 | 0.4907 | 0.4907 | |||||
| US00C4U1L353 / Mylan N.V. | 0.10 | 0.00 | 2.83 | 3.43 | 0.4528 | 0.0076 | |||
| INCY / Incyte Corporation | 0.03 | 0.00 | 2.67 | 35.26 | 0.4260 | 0.4260 | |||
| SLB / Schlumberger Limited | 0.06 | 0.00 | 2.42 | 20.78 | 0.3864 | 0.0611 | |||
| MNKKQ / Mallinckrodt Plc | 0.10 | 0.00 | 2.22 | 37.53 | 0.3542 | 0.0923 | |||
| IOVA / Iovance Biotherapeutics, Inc. | 0.23 | 0.00 | 2.17 | 7.42 | 0.3471 | 0.0185 | |||
| VKTX / Viking Therapeutics, Inc. | 0.14 | 0.00 | 1.39 | 29.97 | 0.2224 | 0.0484 | |||
| FLNT / Fluent, Inc. | 0.19 | 0.00 | 1.09 | 56.21 | 0.1750 | 0.1750 | |||
| ARAV / Aravive, Inc. | 0.04 | 0.00 | 0.29 | 99.31 | 0.0459 | 0.0225 | |||
| APLS / Apellis Pharmaceuticals, Inc. | 0.00 | -100.00 | 0.00 | -100.00 | 0.0000 | ||||
| CRM / Salesforce, Inc. | 0.00 | -100.00 | 0.00 | -100.00 | 0.0000 | ||||
| MELI / MercadoLibre, Inc. | 0.00 | -100.00 | 0.00 | -100.00 | -1.0082 | ||||
| GS / The Goldman Sachs Group, Inc. | 0.00 | -100.00 | 0.00 | -100.00 | -0.1004 | ||||
| PM / Philip Morris International Inc. | 0.00 | -100.00 | 0.00 | -100.00 | -0.6834 | ||||
| CELG / Celgene Corp. | 0.00 | -100.00 | 0.00 | -100.00 | -1.1193 | ||||
| TEVA / Teva Pharmaceutical Industries Limited - Depositary Receipt (Common Stock) | 0.00 | -100.00 | 0.00 | -100.00 | -0.1327 | ||||
| FNSR / Finisar Corporation | 0.00 | -100.00 | 0.00 | -100.00 | -1.3723 | ||||
| HIMX / Himax Technologies, Inc. - Depositary Receipt (Common Stock) | 0.00 | -100.00 | 0.00 | -100.00 | -0.2619 | ||||
| VIPS / Vipshop Holdings Limited - Depositary Receipt (Common Stock) | 0.00 | -100.00 | 0.00 | -100.00 | -0.0466 | ||||
| XLRN / Acceleron Pharma Inc | 0.00 | -100.00 | 0.00 | -100.00 | -0.1017 |