Statistik Asas
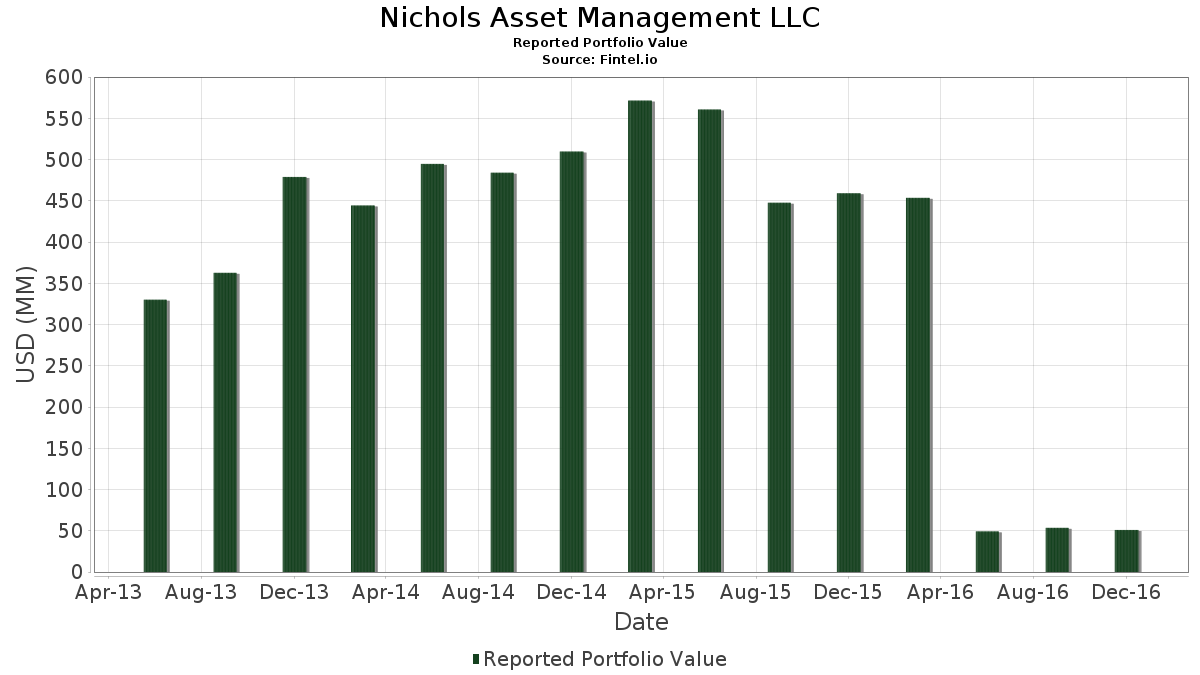
| Nilai Portfolio | $ 50,969,000 |
| Kedudukan Semasa | 64 |
Pegangan Terkini, Prestasi, AUM (dari 13F, 13D)
Nichols Asset Management LLC telah mendedahkan 64 jumlah pegangan dalam pemfailan SEC terkini mereka. Nilai portfolio terkini dikira sebagai $ 50,969,000 USD. Aset Sebenar Di Bawah Pengurusan (AUM) ialah nilai ini ditambah dengan tunai (yang tidak didedahkan). Pegangan teratas Nichols Asset Management LLC ialah iShares Trust - iShares Preferred and Income Securities ETF (US:PFF) , SPDR Series Trust - SPDR Bloomberg High Yield Bond ETF (US:JNK) , SPDR S&P 500 ETF (US:SPY) , Invesco QQQ Trust, Series 1 (US:QQQ) , and iShares Trust - iShares Select Dividend ETF (US:DVY) .
Kenaikan Teratas Suku Tahun Ini
Kami menggunakan perubahan dalam peruntukan portfolio kerana ini adalah metrik yang paling bermakna. Perubahan boleh disebabkan oleh perdagangan atau perubahan dalam harga saham.
| Sekuriti | Saham (MM) |
Nilai (MM$) |
Portfolio % | ΔPortfolio % |
|---|---|---|---|---|
| 0.02 | 2.33 | 4.5714 | 4.5714 | |
| 0.00 | 0.57 | 1.1144 | 1.1144 | |
| 0.01 | 0.55 | 1.0771 | 1.0771 | |
| 0.00 | 0.53 | 1.0398 | 1.0398 | |
| 0.15 | 5.37 | 10.5260 | 0.4294 | |
| 0.00 | 0.21 | 0.4120 | 0.4120 | |
| 0.01 | 2.66 | 5.2169 | 0.4105 | |
| 0.01 | 0.59 | 1.1497 | 0.3072 | |
| 0.02 | 1.64 | 3.2255 | 0.2535 | |
| 0.01 | 0.92 | 1.8109 | 0.1783 |
Penurunan Teratas Suku Tahun Ini
Kami menggunakan perubahan dalam peruntukan portfolio kerana ini adalah metrik yang paling bermakna. Perubahan boleh disebabkan oleh perdagangan atau perubahan dalam harga saham.
| Sekuriti | Saham (MM) |
Nilai (MM$) |
Portfolio % | ΔPortfolio % |
|---|---|---|---|---|
| 0.00 | 0.00 | -0.8705 | ||
| 0.00 | 0.33 | 0.6475 | -0.4453 | |
| 0.00 | 0.00 | -0.4390 | ||
| 0.00 | 0.00 | -0.3923 | ||
| 0.00 | 0.35 | 0.6867 | -0.3146 | |
| 0.00 | 0.26 | 0.5140 | -0.2612 | |
| 0.02 | 0.95 | 1.8698 | -0.2392 | |
| 0.15 | 5.45 | 10.6830 | -0.1141 | |
| 0.01 | 0.33 | 0.6514 | -0.1052 | |
| 0.00 | 0.58 | 1.1478 | -0.0833 |
13F dan Pemfailan Dana
Borang ini telah difailkan pada 2017-02-10 untuk tempoh pelaporan 2016-12-31. Klik ikon pautan untuk melihat sejarah transaksi penuh.
Tingkatkan untuk membuka data premium dan eksport ke Excel ![]() .
.
| Sekuriti | Jenis | Purata Harga Saham | Saham (MM) |
ΔSaham (%) |
ΔSaham (%) |
Nilai ($MM) |
Portfolio (%) |
ΔPortfolio (%) |
|
|---|---|---|---|---|---|---|---|---|---|
| PFF / iShares Trust - iShares Preferred and Income Securities ETF | 0.15 | 0.00 | 5.45 | -5.80 | 10.6830 | -0.1141 | |||
| JNK / SPDR Series Trust - SPDR Bloomberg High Yield Bond ETF | 0.15 | 0.00 | 5.37 | -0.74 | 10.5260 | 0.4294 | |||
| SPY / SPDR S&P 500 ETF | 0.01 | 0.00 | 2.66 | 3.34 | 5.2169 | 0.4105 | |||
| Dow Jones Industrial Avg ETF / (252787106) | 0.01 | 0.00 | 2.51 | 8.04 | 0.0000 | ||||
| QQQ / Invesco QQQ Trust, Series 1 | 0.02 | -16.65 | 2.33 | -16.85 | 4.5714 | 4.5714 | |||
| DVY / iShares Trust - iShares Select Dividend ETF | 0.02 | 0.00 | 1.64 | 3.33 | 3.2255 | 0.2535 | |||
| MMC / Marsh & McLennan Companies, Inc. | 0.02 | 0.00 | 1.60 | 0.50 | 3.1313 | 0.1649 | |||
| IGSB / iShares Trust - iShares 1-5 Year Investment Grade Corporate Bond ETF | 0.01 | 0.00 | 1.37 | -0.80 | 2.6859 | 0.1081 | |||
| INTC / Intel Corporation | 0.03 | 0.00 | 1.01 | -3.91 | 1.9777 | 0.0181 | |||
| MMM / 3M Company | 0.01 | 0.00 | 1.01 | 1.31 | 1.9757 | 0.1189 | |||
| JNJ / Johnson & Johnson | 0.01 | 0.96 | 0.97 | -1.53 | 1.8992 | 0.0629 | |||
| CNC / Centene Corporation | 0.02 | 0.00 | 0.95 | -15.59 | 1.8698 | -0.2392 | |||
| MCD / McDonald's Corporation | 0.01 | 0.00 | 0.92 | 5.61 | 1.8109 | 0.1783 | |||
| BDX / Becton, Dickinson and Company | 0.00 | 0.00 | 0.81 | -7.93 | 1.5951 | -0.0544 | |||
| GE / General Electric Company | 0.03 | 0.00 | 0.81 | 6.75 | 1.5833 | 0.1711 | |||
| RTX / RTX Corporation | 0.01 | 0.00 | 0.77 | 7.80 | 1.5186 | 0.1773 | |||
| NVS / Novartis AG - Depositary Receipt (Common Stock) | 0.01 | 0.00 | 0.75 | -7.64 | 1.4715 | -0.0453 | |||
| PEP / PepsiCo, Inc. | 0.01 | 0.00 | 0.72 | -3.88 | 1.4087 | 0.0133 | |||
| NSRGY / Nestlé S.A. - Depositary Receipt (Common Stock) | 0.01 | 0.00 | 0.71 | -9.10 | 1.3910 | -0.0660 | |||
| GIS / General Mills, Inc. | 0.01 | 0.00 | 0.63 | -3.35 | 1.2439 | 0.0185 | |||
| ROP / Roper Technologies, Inc. | 0.00 | 0.00 | 0.63 | 0.32 | 1.2341 | 0.0628 | |||
| ABBV / AbbVie Inc. | 0.01 | 0.00 | 0.61 | -0.81 | 1.2007 | 0.0482 | |||
| TJX / The TJX Companies, Inc. | 0.01 | 0.00 | 0.61 | 0.50 | 1.1948 | 0.0628 | |||
| SF / Stifel Financial Corp. | 0.01 | 0.00 | 0.59 | 29.93 | 1.1497 | 0.3072 | |||
| TMO / Thermo Fisher Scientific Inc. | 0.00 | 0.00 | 0.58 | -11.23 | 1.1478 | -0.0833 | |||
| IWM / iShares Trust - iShares Russell 2000 ETF | 0.00 | 0.00 | 0.57 | 8.40 | 1.1144 | 1.1144 | |||
| PUK / Prudential plc - Depositary Receipt (Common Stock) | 0.01 | 0.00 | 0.55 | 11.36 | 1.0771 | 1.0771 | |||
| UNP / Union Pacific Corporation | 0.01 | 0.00 | 0.55 | 6.43 | 1.0712 | 0.1130 | |||
| BFFAF / BASF SE | 0.01 | 0.00 | 0.54 | 8.25 | 1.0555 | 0.1271 | |||
| WPPGY / WPP PLC | 0.00 | 0.00 | 0.53 | -5.86 | 1.0398 | 1.0398 | |||
| ES / Eversource Energy | 0.01 | 0.00 | 0.53 | 1.94 | 1.0300 | 0.0680 | |||
| BIIB / Biogen Inc. | 0.00 | 0.00 | 0.52 | -9.52 | 1.0261 | -0.0536 | |||
| MSFT / Microsoft Corporation | 0.01 | 0.00 | 0.52 | 7.85 | 1.0242 | 0.1200 | |||
| SYY / Sysco Corporation | 0.01 | 0.00 | 0.52 | 12.91 | 1.0124 | 0.1587 | |||
| WMT / Walmart Inc. | 0.01 | 0.00 | 0.50 | -4.18 | 0.9888 | 0.0063 | |||
| KMB / Kimberly-Clark Corporation | 0.00 | 0.00 | 0.50 | -9.55 | 0.9849 | -0.0518 | |||
| AMT / American Tower Corporation | 0.00 | 0.00 | 0.48 | -6.67 | 0.9339 | -0.0188 | |||
| AMZN / Amazon.com, Inc. | 0.00 | 0.00 | 0.45 | -10.36 | 0.8829 | -0.0548 | |||
| SYT / SYLA Technologies Co., Ltd. - Depositary Receipt (Common Stock) | 0.01 | 0.00 | 0.45 | -9.70 | 0.8770 | -0.0477 | |||
| AMGN / Amgen Inc. | 0.00 | 0.00 | 0.42 | -12.24 | 0.8162 | -0.0693 | |||
| FUJHY / Subaru Corporation - Depositary Receipt (Common Stock) | 0.02 | 300.00 | 0.41 | 8.49 | 0.8024 | 0.0982 | |||
| FDX / FedEx Corporation | 0.00 | 0.00 | 0.39 | 6.78 | 0.7730 | 0.0837 | |||
| ABT / Abbott Laboratories | 0.01 | 0.00 | 0.39 | -9.20 | 0.7554 | -0.0367 | |||
| NEE / NextEra Energy, Inc. | 0.00 | 0.00 | 0.38 | -2.30 | 0.7495 | 0.0191 | |||
| TSM / Taiwan Semiconductor Manufacturing Company Limited - Depositary Receipt (Common Stock) | 0.01 | 0.00 | 0.35 | -6.13 | 0.6906 | -0.0099 | |||
| V / Visa Inc. | 0.00 | -30.86 | 0.35 | -34.70 | 0.6867 | -0.3146 | |||
| CSCO / Cisco Systems, Inc. | 0.01 | 0.00 | 0.33 | -4.86 | 0.6533 | -0.0005 | |||
| NGG / National Grid plc - Depositary Receipt (Common Stock) | 0.01 | 0.00 | 0.33 | -18.02 | 0.6514 | -0.1052 | |||
| CVS / CVS Health Corporation | 0.00 | -36.50 | 0.33 | -43.59 | 0.6475 | -0.4453 | |||
| Power Assets ADR / (438580300) | 0.04 | 0.00 | 0.33 | -11.38 | 0.0000 | ||||
| CVX / Chevron Corporation | 0.00 | 0.00 | 0.33 | 14.34 | 0.6416 | 0.1073 | |||
| XOM / Exxon Mobil Corporation | 0.00 | 0.00 | 0.32 | 3.51 | 0.6357 | 0.0510 | |||
| SIEGY / Siemens Aktiengesellschaft - Depositary Receipt (Common Stock) | 0.00 | 0.00 | 0.31 | 4.42 | 0.6023 | 0.0531 | |||
| SO / The Southern Company | 0.01 | 0.00 | 0.30 | -4.10 | 0.5964 | 0.0043 | |||
| PG / The Procter & Gamble Company | 0.00 | 0.00 | 0.27 | -6.27 | 0.5278 | -0.0083 | |||
| ADP / Automatic Data Processing, Inc. | 0.00 | 0.00 | 0.27 | 16.59 | 0.5238 | 0.0961 | |||
| HENOY / Henkel AG & Co. KGaA - Depositary Receipt (Common Stock) | 0.00 | 0.00 | 0.26 | -10.58 | 0.5140 | -0.0333 | |||
| CL / Colgate-Palmolive Company | 0.00 | -28.57 | 0.26 | -36.87 | 0.5140 | -0.2612 | |||
| SKM / SK Telecom Co., Ltd. - Depositary Receipt (Common Stock) | 0.01 | 0.00 | 0.26 | -7.53 | 0.5062 | -0.0150 | |||
| GILD / Gilead Sciences, Inc. | 0.00 | 0.00 | 0.26 | -9.25 | 0.5003 | -0.0246 | |||
| IBM / International Business Machines Corporation | 0.00 | 0.00 | 0.25 | 4.56 | 0.4944 | 0.0442 | |||
| QCOM / QUALCOMM Incorporated | 0.00 | 0.00 | 0.23 | -4.86 | 0.4611 | -0.0003 | |||
| AAPL / Apple Inc. | 0.00 | 0.00 | 0.23 | 2.73 | 0.4434 | 0.0324 | |||
| COST / Costco Wholesale Corporation | 0.00 | 0.00 | 0.21 | 0.4120 | 0.4120 | ||||
| NKE / NIKE, Inc. | 0.00 | -100.00 | 0.00 | -100.00 | -0.4390 | ||||
| SJM / The J. M. Smucker Company | 0.00 | -100.00 | 0.00 | -100.00 | 0.0000 | ||||
| JCI / Johnson Controls International plc | 0.00 | -100.00 | 0.00 | -100.00 | -0.3923 | ||||
| TEVA / Teva Pharmaceutical Industries Limited - Depositary Receipt (Common Stock) | 0.00 | -100.00 | 0.00 | -100.00 | -0.8705 | ||||
| SNMX / Senomyx, Inc. | 0.00 | -100.00 | 0.00 | -100.00 | -0.0803 | ||||
| JASN / Jason Industries, Inc. | 0.00 | -100.00 | 0.00 | -100.00 | 0.0000 |