Statistik Asas
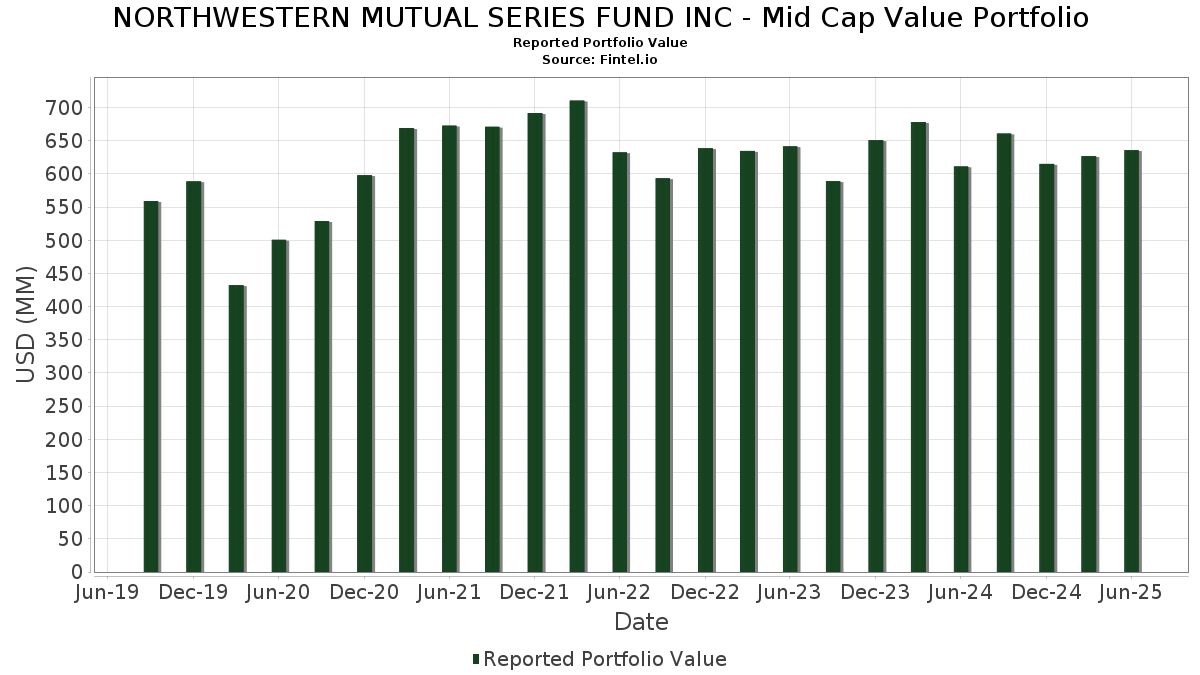
| Nilai Portfolio | $ 635,933,256 |
| Kedudukan Semasa | 110 |
Pegangan Terkini, Prestasi, AUM (dari 13F, 13D)
NORTHWESTERN MUTUAL SERIES FUND INC - Mid Cap Value Portfolio telah mendedahkan 110 jumlah pegangan dalam pemfailan SEC terkini mereka. Nilai portfolio terkini dikira sebagai $ 635,933,256 USD. Aset Sebenar Di Bawah Pengurusan (AUM) ialah nilai ini ditambah dengan tunai (yang tidak didedahkan). Pegangan teratas NORTHWESTERN MUTUAL SERIES FUND INC - Mid Cap Value Portfolio ialah Zimmer Biomet Holdings, Inc. (US:ZBH) , Enterprise Products Partners L.P. - Limited Partnership (US:EPD) , Henry Schein, Inc. (US:HSIC) , Truist Financial Corporation (US:TFC) , and U.S. Bancorp (US:USB) . Kedudukan baharu NORTHWESTERN MUTUAL SERIES FUND INC - Mid Cap Value Portfolio termasuk Hexcel Corporation (US:HXL) , The Toro Company (US:TTC) , NXP Semiconductors N.V. (US:NXPI) , Raymond James Financial, Inc. (US:RJF) , and Ashtead Group plc (GB:AHT) .
Kenaikan Teratas Suku Tahun Ini
Kami menggunakan perubahan dalam peruntukan portfolio kerana ini adalah metrik yang paling bermakna. Perubahan boleh disebabkan oleh perdagangan atau perubahan dalam harga saham.
| Sekuriti | Saham (MM) |
Nilai (MM$) |
Portfolio % | ΔPortfolio % |
|---|---|---|---|---|
| 0.02 | 7.02 | 1.0899 | 0.9319 | |
| 0.05 | 8.81 | 1.3679 | 0.7284 | |
| 0.07 | 4.03 | 0.6255 | 0.6255 | |
| 0.07 | 6.26 | 0.9717 | 0.6182 | |
| 0.04 | 7.44 | 1.1549 | 0.6091 | |
| 0.05 | 3.65 | 0.5670 | 0.5670 | |
| 0.02 | 3.59 | 0.5573 | 0.5573 | |
| 0.02 | 3.51 | 0.5453 | 0.5453 | |
| 0.24 | 9.15 | 1.4200 | 0.5428 | |
| 0.05 | 3.03 | 0.4703 | 0.4703 |
Penurunan Teratas Suku Tahun Ini
Kami menggunakan perubahan dalam peruntukan portfolio kerana ini adalah metrik yang paling bermakna. Perubahan boleh disebabkan oleh perdagangan atau perubahan dalam harga saham.
| Sekuriti | Saham (MM) |
Nilai (MM$) |
Portfolio % | ΔPortfolio % |
|---|---|---|---|---|
| 0.01 | 2.50 | 0.3877 | -0.7408 | |
| 0.05 | 1.63 | 0.2527 | -0.6494 | |
| 0.02 | 3.68 | 0.5718 | -0.5785 | |
| 0.00 | 0.00 | -0.5446 | ||
| 0.02 | 3.16 | 0.4898 | -0.4572 | |
| 0.05 | 4.34 | 0.6729 | -0.4370 | |
| 0.11 | 4.81 | 0.7461 | -0.4140 | |
| 0.05 | 3.23 | 0.5018 | -0.4058 | |
| 0.01 | 1.30 | 0.2014 | -0.3716 | |
| 0.19 | 17.16 | 2.6634 | -0.3559 |
13F dan Pemfailan Dana
Borang ini telah difailkan pada 2025-08-19 untuk tempoh pelaporan 2025-06-30. Klik ikon pautan untuk melihat sejarah transaksi penuh.
Tingkatkan untuk membuka data premium dan eksport ke Excel ![]() .
.
| Sekuriti | Jenis | Purata Harga Saham | Saham (MM) |
ΔSaham (%) |
ΔSaham (%) |
Nilai ($MM) |
Portfolio (%) |
ΔPortfolio (%) |
|
|---|---|---|---|---|---|---|---|---|---|
| ZBH / Zimmer Biomet Holdings, Inc. | 0.19 | 10.05 | 17.16 | -11.31 | 2.6634 | -0.3559 | |||
| EPD / Enterprise Products Partners L.P. - Limited Partnership | 0.44 | 7.07 | 13.50 | -2.75 | 2.0946 | -0.0707 | |||
| HSIC / Henry Schein, Inc. | 0.18 | -0.85 | 13.19 | 5.76 | 2.0470 | 0.1010 | |||
| TFC / Truist Financial Corporation | 0.30 | 6.98 | 12.91 | 11.75 | 2.0041 | 0.2012 | |||
| USB / U.S. Bancorp | 0.28 | -3.58 | 12.68 | 3.33 | 1.9674 | 0.0533 | |||
| WTY / Willis Towers Watson Public Limited Company | 0.04 | 23.98 | 11.78 | 12.44 | 1.8276 | 0.1935 | |||
| NTRS / Northern Trust Corporation | 0.09 | -6.76 | 11.52 | 19.84 | 1.7878 | 0.2879 | |||
| LH / Labcorp Holdings Inc. | 0.04 | -7.92 | 11.17 | 3.86 | 1.7337 | 0.0554 | |||
| KVUE / Kenvue Inc. | 0.52 | 39.23 | 10.79 | 21.52 | 1.6748 | 0.2892 | |||
| MSM / MSC Industrial Direct Co., Inc. | 0.12 | -2.51 | 10.32 | 6.71 | 1.6015 | 0.0927 | |||
| NSC / Norfolk Southern Corporation | 0.04 | -18.10 | 10.30 | -11.49 | 1.5983 | -0.2171 | |||
| OSK / Oshkosh Corporation | 0.09 | 0.47 | 10.19 | 21.26 | 1.5818 | 0.2703 | |||
| CBSH / Commerce Bancshares, Inc. | 0.16 | 2.01 | 10.10 | 1.92 | 1.5679 | 0.0212 | |||
| O / Realty Income Corporation | 0.18 | 6.06 | 10.09 | 5.32 | 1.5655 | 0.0712 | |||
| CSX / CSX Corporation | 0.31 | 28.49 | 10.01 | 42.47 | 1.5540 | 0.4573 | |||
| VICI / VICI Properties Inc. | 0.29 | -5.41 | 9.44 | -5.47 | 1.4654 | -0.0930 | |||
| ES / Eversource Energy | 0.15 | 20.10 | 9.31 | 23.02 | 1.4445 | 0.2640 | |||
| BKR / Baker Hughes Company | 0.24 | 86.55 | 9.15 | 62.72 | 1.4200 | 0.5428 | |||
| LHX / L3Harris Technologies, Inc. | 0.04 | -18.48 | 9.13 | -2.31 | 1.4173 | -0.0413 | |||
| EVRG / Evergy, Inc. | 0.13 | -13.05 | 9.12 | -13.07 | 1.4148 | -0.2215 | |||
| RGA / Reinsurance Group of America, Incorporated | 0.05 | 44.35 | 9.07 | 45.42 | 1.4080 | 0.4346 | |||
| BNZL / Bunzl plc | 0.28 | 60.87 | 9.07 | 33.73 | 1.4071 | 0.3492 | |||
| BDX / Becton, Dickinson and Company | 0.05 | 22.96 | 9.01 | -7.54 | 1.3981 | -0.1221 | |||
| XEL / Xcel Energy Inc. | 0.13 | 20.56 | 8.90 | 15.99 | 1.3803 | 0.1838 | |||
| KMB / Kimberly-Clark Corporation | 0.07 | 25.72 | 8.89 | 13.96 | 1.3796 | 0.1625 | |||
| PNC / The PNC Financial Services Group, Inc. | 0.05 | 102.77 | 8.81 | 115.08 | 1.3679 | 0.7284 | |||
| EQR / Equity Residential | 0.13 | 8.13 | 8.73 | 1.95 | 1.3544 | 0.0188 | |||
| GPK / Graphic Packaging Holding Company | 0.41 | 15.36 | 8.67 | -6.37 | 1.3452 | -0.0992 | |||
| NWE / NorthWestern Energy Group, Inc. | 0.16 | -3.24 | 8.39 | -14.22 | 1.3014 | -0.2239 | |||
| PKG / Packaging Corporation of America | 0.04 | 123.53 | 7.44 | 112.75 | 1.1549 | 0.6091 | |||
| PSA / Public Storage | 0.02 | 4.84 | 7.22 | 2.79 | 1.1198 | 0.0245 | |||
| CMI / Cummins Inc. | 0.02 | 563.55 | 7.02 | 593.29 | 1.0899 | 0.9319 | |||
| DOX / Amdocs Limited | 0.08 | -19.64 | 6.97 | -19.87 | 1.0811 | -0.2753 | |||
| GEHC / GE HealthCare Technologies Inc. | 0.09 | 60.74 | 6.76 | 47.52 | 1.0483 | 0.3338 | |||
| EL / The Estée Lauder Companies Inc. | 0.08 | 10.62 | 6.70 | 35.43 | 1.0400 | 0.2679 | |||
| SR / Spire Inc. | 0.09 | -7.70 | 6.67 | -13.90 | 1.0349 | -0.1736 | |||
| HPQ / HP Inc. | 0.27 | 3.74 | 6.54 | -8.36 | 1.0156 | -0.0986 | |||
| MDT / Medtronic plc | 0.07 | 7.92 | 6.35 | 4.68 | 0.9861 | 0.0391 | |||
| AMT / American Tower Corporation | 0.03 | -3.20 | 6.33 | -1.68 | 0.9823 | -0.0221 | |||
| RBGPF / Reckitt Benckiser Group plc | 0.09 | 7.51 | 6.28 | 8.23 | 0.9740 | 0.0692 | |||
| TER / Teradyne, Inc. | 0.07 | 153.89 | 6.26 | 176.42 | 0.9717 | 0.6182 | |||
| LUV / Southwest Airlines Co. | 0.19 | 6.23 | 6.25 | 2.63 | 0.9702 | 0.0197 | |||
| RS / Reliance, Inc. | 0.02 | 6.86 | 6.20 | 16.17 | 0.9621 | 0.1295 | |||
| CAG / Conagra Brands, Inc. | 0.30 | -0.46 | 6.08 | -23.60 | 0.9435 | -0.2980 | |||
| OGS / ONE Gas, Inc. | 0.08 | -10.55 | 5.93 | -14.97 | 0.9196 | -0.1677 | |||
| RI / Pernod Ricard SA | 0.06 | -3.26 | 5.78 | -2.71 | 0.8975 | -0.0300 | |||
| PB / Prosperity Bancshares, Inc. | 0.08 | 87.48 | 5.57 | 94.44 | 0.8636 | 0.4356 | |||
| CTSH / Cognizant Technology Solutions Corporation | 0.07 | 38.26 | 5.50 | 41.03 | 0.8541 | 0.2452 | |||
| CTRA / Coterra Energy Inc. | 0.21 | -1.81 | 5.43 | -13.78 | 0.8420 | -0.1397 | |||
| TE Connectivity PLC / EC (IE000IVNQZ81) | 0.03 | -25.22 | 5.38 | -10.76 | 0.8356 | -0.1057 | |||
| IQV / IQVIA Holdings Inc. | 0.03 | 18.03 | 5.31 | 5.50 | 0.8241 | 0.0388 | |||
| DOC / Healthpeak Properties, Inc. | 0.30 | 21.13 | 5.31 | 4.90 | 0.8239 | 0.0342 | |||
| HOLX / Hologic, Inc. | 0.08 | 8.45 | 5.20 | 14.40 | 0.8064 | 0.0977 | |||
| DGX / Quest Diagnostics Incorporated | 0.03 | -34.06 | 5.16 | -29.99 | 0.8001 | -0.3490 | |||
| CNC / Centene Corporation | 0.09 | 2.46 | 5.10 | -8.39 | 0.7915 | -0.0771 | |||
| TROW / T. Rowe Price Group, Inc. | 0.05 | -25.61 | 5.06 | -21.86 | 0.7851 | -0.2250 | |||
| TKR / The Timken Company | 0.07 | 12.19 | 5.06 | 13.26 | 0.7850 | 0.0881 | |||
| GIS / General Mills, Inc. | 0.10 | -0.93 | 4.96 | -14.15 | 0.7699 | -0.1317 | |||
| MHK / Mohawk Industries, Inc. | 0.05 | 8.34 | 4.93 | -0.52 | 0.7654 | -0.0082 | |||
| VTR / Ventas, Inc. | 0.08 | -8.13 | 4.93 | -15.63 | 0.7651 | -0.1466 | |||
| IPG / The Interpublic Group of Companies, Inc. | 0.20 | 6.95 | 4.85 | -3.62 | 0.7523 | -0.0323 | |||
| AD / Koninklijke Ahold Delhaize N.V. | 0.11 | -42.18 | 4.81 | -35.35 | 0.7461 | -0.4140 | |||
| EXP / Eagle Materials Inc. | 0.02 | 108.82 | 4.77 | 90.20 | 0.7406 | 0.3491 | |||
| HEN3 / Henkel AG & Co. KGaA - Preferred Stock | 0.06 | -4.39 | 4.77 | -5.56 | 0.7403 | -0.0478 | |||
| PPG / PPG Industries, Inc. | 0.04 | 15.83 | 4.63 | 20.51 | 0.7186 | 0.1190 | |||
| OMC / Omnicom Group Inc. | 0.06 | 9.39 | 4.57 | -5.08 | 0.7099 | -0.0420 | |||
| HEIA / Heineken N.V. | 0.05 | -5.15 | 4.53 | 1.71 | 0.7028 | 0.0080 | |||
| NVST / Envista Holdings Corporation | 0.22 | -7.18 | 4.37 | 5.10 | 0.6785 | 0.0293 | |||
| BK / The Bank of New York Mellon Corporation | 0.05 | -43.89 | 4.34 | -39.04 | 0.6729 | -0.4370 | |||
| ABM / ABM Industries Incorporated | 0.09 | -0.63 | 4.30 | -0.95 | 0.6666 | -0.0100 | |||
| OXY / Occidental Petroleum Corporation | 0.10 | 12.58 | 4.24 | -4.18 | 0.6579 | -0.0324 | |||
| EMR / Emerson Electric Co. | 0.03 | -26.44 | 4.15 | -10.56 | 0.6445 | -0.0798 | |||
| HXL / Hexcel Corporation | 0.07 | 4.03 | 0.6255 | 0.6255 | |||||
| BWA / BorgWarner Inc. | 0.12 | -4.58 | 4.01 | 11.52 | 0.6219 | 0.0612 | |||
| FANG / Diamondback Energy, Inc. | 0.03 | 49.75 | 3.99 | 28.68 | 0.6191 | 0.1355 | |||
| AOS / A. O. Smith Corporation | 0.06 | 15.91 | 3.80 | 16.29 | 0.5904 | 0.0800 | |||
| UHS / Universal Health Services, Inc. | 0.02 | -16.58 | 3.70 | -19.58 | 0.5744 | -0.1436 | |||
| ALL / The Allstate Corporation | 0.02 | -48.59 | 3.68 | -50.03 | 0.5718 | -0.5785 | |||
| TTC / The Toro Company | 0.05 | 3.65 | 0.5670 | 0.5670 | |||||
| THG / The Hanover Insurance Group, Inc. | 0.02 | -11.97 | 3.61 | -14.04 | 0.5608 | -0.0950 | |||
| NXPI / NXP Semiconductors N.V. | 0.02 | 3.59 | 0.5573 | 0.5573 | |||||
| WABC / Westamerica Bancorporation | 0.07 | 9.54 | 3.55 | 4.79 | 0.5504 | 0.0224 | |||
| RJF / Raymond James Financial, Inc. | 0.02 | 3.51 | 0.5453 | 0.5453 | |||||
| ML / Compagnie Générale des Établissements Michelin Société en commandite par actions | 0.09 | 45.89 | 3.49 | 41.56 | 0.5414 | 0.1853 | |||
| SW / Sodexo S.A. | 0.06 | 132.61 | 3.43 | 58.86 | 0.5329 | 0.1861 | |||
| LR / Legrand SA | 0.03 | 58.33 | 3.43 | 99.77 | 0.5323 | 0.2644 | |||
| AKZA / Akzo Nobel N.V. | 0.05 | -37.39 | 3.34 | -28.94 | 0.5176 | -0.2146 | |||
| MDLZ / Mondelez International, Inc. | 0.05 | -44.08 | 3.23 | -44.42 | 0.5018 | -0.4058 | |||
| FFIV / F5, Inc. | 0.01 | 1.16 | 3.20 | 11.84 | 0.4971 | 0.0502 | |||
| DG / Vinci SA | 0.02 | -55.49 | 3.16 | -48.01 | 0.4898 | -0.4572 | |||
| AHT / Ashtead Group plc | 0.05 | 3.03 | 0.4703 | 0.4703 | |||||
| ICLR / ICON Public Limited Company | 0.02 | 0.00 | 3.02 | -16.88 | 0.4685 | -0.0982 | |||
| GNTX / Gentex Corporation | 0.13 | 22.27 | 2.91 | 15.37 | 0.4509 | 0.0581 | |||
| COR / Cencora, Inc. | 0.01 | -67.97 | 2.50 | -65.46 | 0.3877 | -0.7408 | |||
| ESS / Essex Property Trust, Inc. | 0.01 | -34.62 | 2.28 | -39.56 | 0.3533 | -0.2344 | |||
| ADC / Agree Realty Corporation | 0.03 | -37.50 | 2.27 | -40.84 | 0.3528 | -0.2468 | |||
| PHM / PulteGroup, Inc. | 0.02 | 1.93 | 0.2988 | 0.2988 | |||||
| REG / Regency Centers Corporation | 0.02 | -3.85 | 1.74 | -7.19 | 0.2706 | -0.0224 | |||
| DOV / Dover Corporation | 0.01 | -41.19 | 1.71 | -38.67 | 0.2654 | -0.1696 | |||
| GTES / Gates Industrial Corporation plc | 0.07 | 22.66 | 1.67 | 53.45 | 0.2590 | 0.0893 | |||
| FHB / First Hawaiian, Inc. | 0.07 | -49.25 | 1.64 | -48.18 | 0.2540 | -0.2386 | |||
| PPL / PPL Corporation | 0.05 | -69.99 | 1.63 | -71.84 | 0.2527 | -0.6494 | |||
| QGEN / Qiagen N.V. | 0.03 | 1.48 | 0.2302 | 0.2302 | |||||
| 0IRE / Fortive Corporation | 0.03 | 1.40 | 0.2177 | 0.2177 | |||||
| ADI / Analog Devices, Inc. | 0.01 | 1.36 | 0.2113 | 0.2113 | |||||
| DUK / Duke Energy Corporation | 0.01 | -67.30 | 1.30 | -64.20 | 0.2014 | -0.3716 | |||
| RSG / Republic Services, Inc. | 0.00 | -66.24 | 0.96 | -65.62 | 0.1485 | -0.2858 | |||
| RAL / Ralliant Corporation | 0.01 | 0.44 | 0.0675 | 0.0675 | |||||
| MLM / Martin Marietta Materials, Inc. | 0.00 | -100.00 | 0.00 | -100.00 | -0.5446 | ||||
| BA.C / Bank of America Corporation - Depositary Receipt (Common Stock) | -0.37 | -0.0569 | -0.0569 | ||||||
| PURCHASED USD / SOLD EUR / DFE (000000000) | -0.80 | -0.1243 | -0.1243 |