Statistik Asas
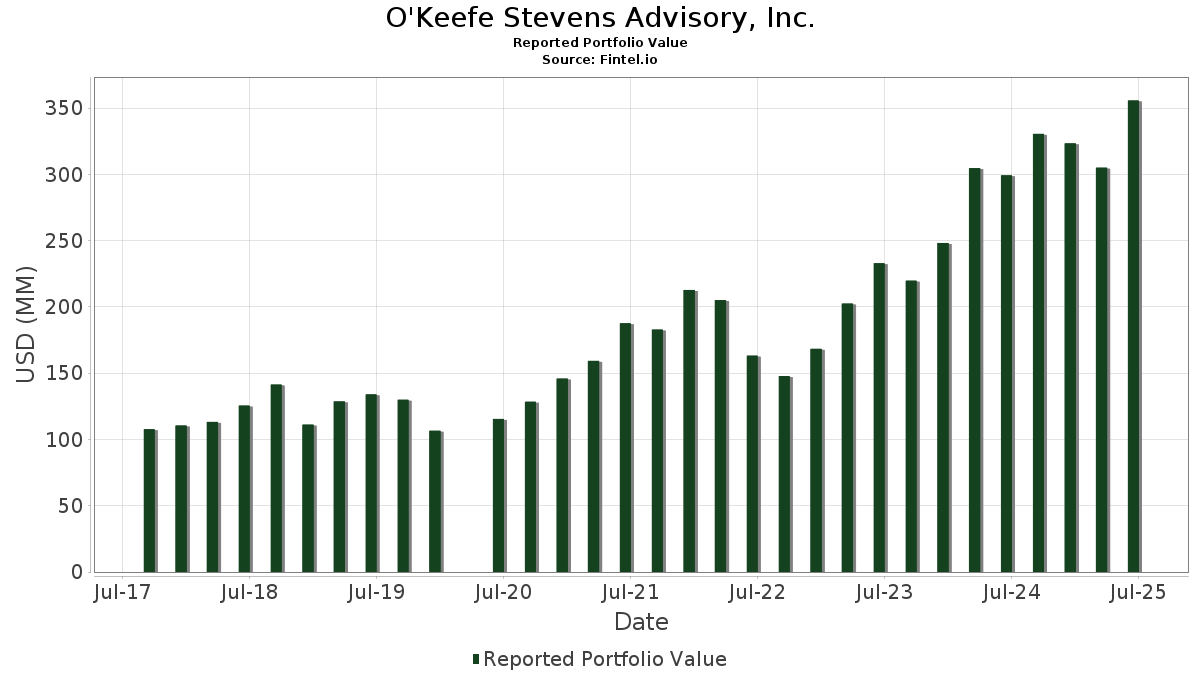
| Nilai Portfolio | $ 355,666,027 |
| Kedudukan Semasa | 68 |
Pegangan Terkini, Prestasi, AUM (dari 13F, 13D)
O'Keefe Stevens Advisory, Inc. telah mendedahkan 68 jumlah pegangan dalam pemfailan SEC terkini mereka. Nilai portfolio terkini dikira sebagai $ 355,666,027 USD. Aset Sebenar Di Bawah Pengurusan (AUM) ialah nilai ini ditambah dengan tunai (yang tidak didedahkan). Pegangan teratas O'Keefe Stevens Advisory, Inc. ialah Direxion Shares ETF Trust - Direxion Daily NVDA Bear 1X Shares (US:NVDD) , QUALCOMM Incorporated (US:QCOM) , BGC Group, Inc. (US:BGC) , Corning Incorporated (US:GLW) , and Loews Corporation (US:L) . Kedudukan baharu O'Keefe Stevens Advisory, Inc. termasuk Seaport Entertainment Group Inc. (US:SEG) , Meta Platforms, Inc. (US:META) , Topgolf Callaway Brands Corp. (US:MODG) , .
Kenaikan Teratas Suku Tahun Ini
Kami menggunakan perubahan dalam peruntukan portfolio kerana ini adalah metrik yang paling bermakna. Perubahan boleh disebabkan oleh perdagangan atau perubahan dalam harga saham.
| Sekuriti | Saham (MM) |
Nilai (MM$) |
Portfolio % | ΔPortfolio % |
|---|---|---|---|---|
| 0.48 | 76.44 | 21.4924 | 4.2171 | |
| 0.55 | 10.97 | 3.0831 | 2.1883 | |
| 0.23 | 14.45 | 4.0624 | 0.7746 | |
| 0.01 | 1.51 | 0.4253 | 0.3271 | |
| 0.21 | 8.70 | 2.4467 | 0.3140 | |
| 0.11 | 13.02 | 3.6611 | 0.0866 | |
| 0.01 | 2.83 | 0.7951 | 0.0806 | |
| 0.01 | 1.38 | 0.3882 | 0.0687 | |
| 0.00 | 0.24 | 0.0685 | 0.0685 | |
| 0.01 | 0.23 | 0.0646 | 0.0646 |
Penurunan Teratas Suku Tahun Ini
Kami menggunakan perubahan dalam peruntukan portfolio kerana ini adalah metrik yang paling bermakna. Perubahan boleh disebabkan oleh perdagangan atau perubahan dalam harga saham.
| Sekuriti | Saham (MM) |
Nilai (MM$) |
Portfolio % | ΔPortfolio % |
|---|---|---|---|---|
| 0.05 | 13.96 | 3.9236 | -1.0816 | |
| 0.03 | 13.40 | 3.7681 | -0.9880 | |
| 0.08 | 9.39 | 2.6408 | -0.8477 | |
| 0.36 | 9.28 | 2.6093 | -0.7840 | |
| 0.17 | 15.23 | 4.2831 | -0.6900 | |
| 0.14 | 22.66 | 6.3707 | -0.6513 | |
| 0.29 | 13.18 | 3.7050 | -0.6137 | |
| 2.28 | 12.55 | 3.5296 | -0.3859 | |
| 0.22 | 5.93 | 1.6668 | -0.2521 | |
| 0.03 | 3.16 | 0.8879 | -0.1961 |
13F dan Pemfailan Dana
Borang ini telah difailkan pada 2025-07-22 untuk tempoh pelaporan 2025-06-30. Klik ikon pautan untuk melihat sejarah transaksi penuh.
Tingkatkan untuk membuka data premium dan eksport ke Excel ![]() .
.
| Sekuriti | Jenis | Purata Harga Saham | Saham (MM) |
ΔSaham (%) |
ΔSaham (%) |
Nilai ($MM) |
Portfolio (%) |
ΔPortfolio (%) |
|
|---|---|---|---|---|---|---|---|---|---|
| NVDD / Direxion Shares ETF Trust - Direxion Daily NVDA Bear 1X Shares | 0.48 | -0.48 | 76.44 | 45.08 | 21.4924 | 4.2171 | |||
| QCOM / QUALCOMM Incorporated | 0.14 | 2.04 | 22.66 | 5.80 | 6.3707 | -0.6513 | |||
| BGC / BGC Group, Inc. | 1.72 | 2.44 | 17.65 | 14.28 | 4.9614 | -0.1015 | |||
| GLW / Corning Incorporated | 0.32 | 1.64 | 16.68 | 16.76 | 4.6890 | 0.0058 | |||
| L / Loews Corporation | 0.17 | 0.71 | 15.23 | 0.44 | 4.2831 | -0.6900 | |||
| DFIN / Donnelley Financial Solutions, Inc. | 0.23 | 2.16 | 14.45 | 44.09 | 4.0624 | 0.7746 | |||
| AMGN / Amgen Inc. | 0.05 | 2.00 | 13.96 | -8.58 | 3.9236 | -1.0816 | |||
| BRK.B / Berkshire Hathaway Inc. | 0.03 | 1.29 | 13.40 | -7.61 | 3.7681 | -0.9880 | |||
| HCC / Warrior Met Coal, Inc. | 0.29 | 4.17 | 13.18 | 0.05 | 3.7050 | -0.6137 | |||
| AER / AerCap Holdings N.V. | 0.11 | 4.30 | 13.02 | 19.45 | 3.6611 | 0.0866 | |||
| FPH / Five Point Holdings, LLC | 2.28 | 2.06 | 12.55 | 5.13 | 3.5296 | -0.3859 | |||
| CMP / Compass Minerals International, Inc. | 0.55 | 85.79 | 10.97 | 301.80 | 3.0831 | 2.1883 | |||
| LAZ / Lazard, Inc. | 0.22 | 1.78 | 10.50 | 12.78 | 2.9529 | -0.1003 | |||
| BABA / Alibaba Group Holding Limited - Depositary Receipt (Common Stock) | 0.08 | 2.93 | 9.39 | -11.72 | 2.6408 | -0.8477 | |||
| WY / Weyerhaeuser Company | 0.36 | 2.20 | 9.28 | -10.33 | 2.6093 | -0.7840 | |||
| MTB / M&T Bank Corporation | 0.05 | 2.82 | 8.92 | 11.59 | 2.5076 | -0.1131 | |||
| TPH / Tri Pointe Homes, Inc. | 0.27 | 9.96 | 8.73 | 10.07 | 2.4555 | -0.1461 | |||
| SPHR / Sphere Entertainment Co. | 0.21 | 4.72 | 8.70 | 33.79 | 2.4467 | 0.3140 | |||
| UNP / Union Pacific Corporation | 0.03 | 12.97 | 6.01 | 10.03 | 1.6905 | -0.1013 | |||
| PRGO / Perrigo Company plc | 0.22 | 6.30 | 5.93 | 1.30 | 1.6668 | -0.2521 | |||
| ARCO / Arcos Dorados Holdings Inc. | 0.52 | 2.17 | 4.08 | 0.00 | 1.1474 | -0.1905 | |||
| SCL / Stepan Company | 0.07 | 9.65 | 4.00 | 8.75 | 1.1247 | -0.0815 | |||
| XOM / Exxon Mobil Corporation | 0.03 | 5.38 | 3.16 | -4.48 | 0.8879 | -0.1961 | |||
| PSX / Phillips 66 | 0.02 | -0.06 | 2.88 | -3.45 | 0.8099 | -0.1682 | |||
| JPM / JPMorgan Chase & Co. | 0.01 | 9.79 | 2.83 | 29.78 | 0.7951 | 0.0806 | |||
| PFE / Pfizer Inc. | 0.10 | 4.33 | 2.48 | -0.20 | 0.6972 | -0.1175 | |||
| TKO / TKO Group Holdings, Inc. | 0.01 | 323.97 | 1.51 | 405.69 | 0.4253 | 0.3271 | |||
| EBGEF / Enbridge Inc. - Preferred Stock | 0.03 | 18.70 | 1.40 | 21.37 | 0.3930 | 0.0155 | |||
| HII / Huntington Ingalls Industries, Inc. | 0.01 | 19.70 | 1.38 | 41.68 | 0.3882 | 0.0687 | |||
| SWX / Southwest Gas Holdings, Inc. | 0.02 | 23.60 | 1.36 | 28.03 | 0.3829 | 0.0342 | |||
| BLK / BlackRock, Inc. | 0.00 | 20.33 | 1.30 | 33.47 | 0.3668 | 0.0461 | |||
| PAYX / Paychex, Inc. | 0.01 | 0.43 | 1.27 | -5.30 | 0.3567 | -0.0826 | |||
| WMB / The Williams Companies, Inc. | 0.02 | 15.81 | 1.21 | 21.70 | 0.3392 | 0.0142 | |||
| DUK / Duke Energy Corporation | 0.01 | 19.80 | 1.14 | 15.96 | 0.3208 | -0.0020 | |||
| APD / Air Products and Chemicals, Inc. | 0.00 | 24.12 | 1.14 | 18.72 | 0.3191 | 0.0056 | |||
| KO / The Coca-Cola Company | 0.02 | 19.38 | 1.09 | 17.93 | 0.3053 | 0.0034 | |||
| AAPL / Apple Inc. | 0.01 | 0.00 | 1.07 | -7.63 | 0.2996 | -0.0786 | |||
| SBUX / Starbucks Corporation | 0.01 | 24.60 | 1.05 | 16.33 | 0.2945 | -0.0006 | |||
| MDT / Medtronic plc | 0.01 | 17.44 | 0.97 | 14.00 | 0.2725 | -0.0064 | |||
| GPC / Genuine Parts Company | 0.01 | 24.20 | 0.97 | 26.47 | 0.2714 | 0.0211 | |||
| UPS / United Parcel Service, Inc. | 0.01 | 30.85 | 0.94 | 20.10 | 0.2657 | 0.0077 | |||
| LMT / Lockheed Martin Corporation | 0.00 | 21.39 | 0.88 | 25.90 | 0.2462 | 0.0181 | |||
| OMC / Omnicom Group Inc. | 0.01 | 27.79 | 0.77 | 10.97 | 0.2163 | -0.0112 | |||
| MSFT / Microsoft Corporation | 0.00 | 0.66 | 0.68 | 33.27 | 0.1917 | 0.0241 | |||
| AMAT / Applied Materials, Inc. | 0.00 | -1.40 | 0.59 | 24.63 | 0.1665 | 0.0104 | |||
| JNJ / Johnson & Johnson | 0.00 | -1.70 | 0.55 | -9.44 | 0.1539 | -0.0443 | |||
| APA / APA Corporation | 0.03 | -0.49 | 0.54 | -13.32 | 0.1519 | -0.0527 | |||
| ROKU / Roku, Inc. | 0.01 | 23.26 | 0.54 | 53.87 | 0.1512 | 0.0366 | |||
| ROK / Rockwell Automation, Inc. | 0.00 | -0.62 | 0.53 | 27.64 | 0.1494 | 0.0130 | |||
| ORCL / Oracle Corporation | 0.00 | 2.66 | 0.47 | 60.54 | 0.1327 | 0.0363 | |||
| DGX / Quest Diagnostics Incorporated | 0.00 | 0.00 | 0.45 | 6.15 | 0.1263 | -0.0124 | |||
| GJR / Strats Trust For Procter & Gambel Security - Preferred Security | 0.00 | 0.00 | 0.44 | -6.55 | 0.1244 | -0.0308 | |||
| CLMT / Calumet, Inc. | 0.03 | 12.14 | 0.42 | 39.27 | 0.1188 | 0.0194 | |||
| MCD / McDonald's Corporation | 0.00 | 0.00 | 0.39 | -6.51 | 0.1092 | -0.0269 | |||
| FC / Franklin Covey Co. | 0.02 | 35.65 | 0.39 | 12.21 | 0.1086 | -0.0044 | |||
| DIS / The Walt Disney Company | 0.00 | 2.91 | 0.33 | 29.13 | 0.0924 | 0.0091 | |||
| PM / Philip Morris International Inc. | 0.00 | -3.73 | 0.32 | 10.58 | 0.0913 | -0.0051 | |||
| BK / The Bank of New York Mellon Corporation | 0.00 | 1.12 | 0.29 | 9.96 | 0.0808 | -0.0050 | |||
| GOOG / Alphabet Inc. | 0.00 | 2.75 | 0.27 | 16.81 | 0.0764 | 0.0000 | |||
| BNL / Broadstone Net Lease, Inc. | 0.02 | 0.00 | 0.26 | -5.84 | 0.0728 | -0.0173 | |||
| GE / General Electric Company | 0.00 | 0.24 | 0.0685 | 0.0685 | |||||
| SCHW / The Charles Schwab Corporation | 0.00 | -1.11 | 0.24 | 15.71 | 0.0684 | -0.0008 | |||
| ITW / Illinois Tool Works Inc. | 0.00 | 0.00 | 0.23 | -0.43 | 0.0653 | -0.0111 | |||
| SEG / Seaport Entertainment Group Inc. | 0.01 | 0.23 | 0.0646 | 0.0646 | |||||
| ABT / Abbott Laboratories | 0.00 | 0.00 | 0.22 | 2.34 | 0.0618 | -0.0085 | |||
| META / Meta Platforms, Inc. | 0.00 | 0.22 | 0.0612 | 0.0612 | |||||
| MRK / Merck & Co., Inc. | 0.00 | 0.00 | 0.20 | -11.84 | 0.0566 | -0.0182 | |||
| MODG / Topgolf Callaway Brands Corp. | 0.01 | 0.11 | 0.0299 | 0.0299 | |||||
| TGNA / TEGNA Inc. | 0.00 | -100.00 | 0.00 | 0.0000 | |||||
| CVX / Chevron Corporation | 0.00 | -100.00 | 0.00 | 0.0000 | |||||
| CMCSA / Comcast Corporation | 0.00 | -100.00 | 0.00 | 0.0000 | |||||
| BMY / Bristol-Myers Squibb Company | 0.00 | -100.00 | 0.00 | 0.0000 |