Statistik Asas
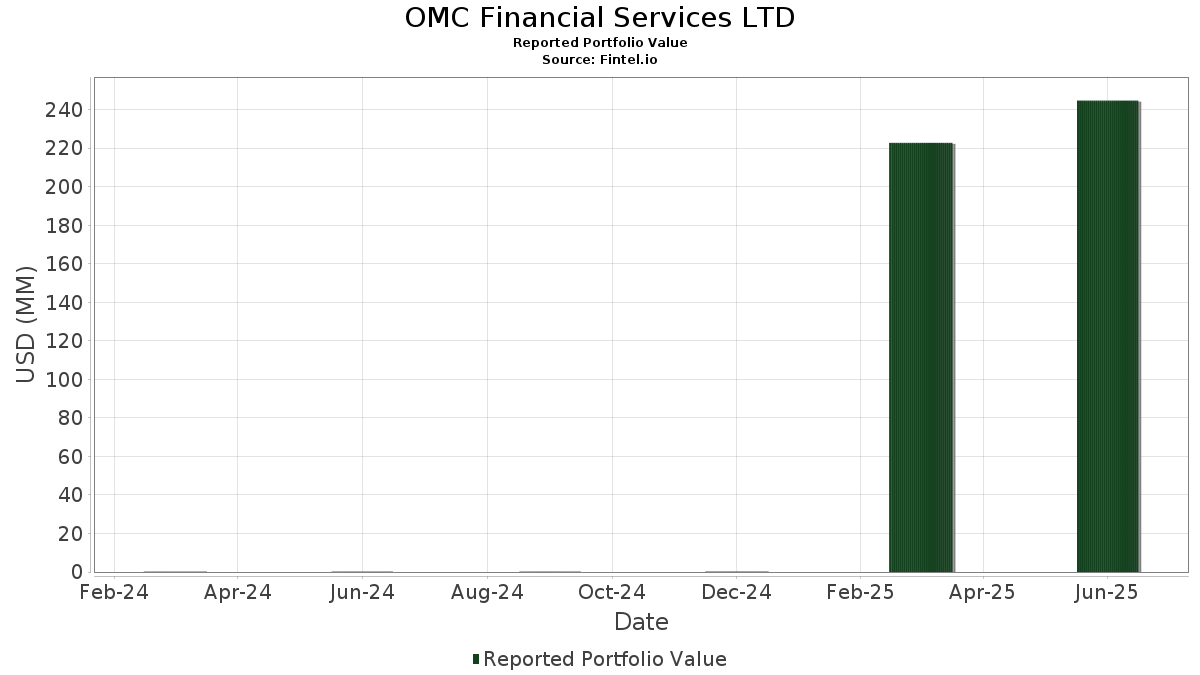
| Nilai Portfolio | $ 244,726,741 |
| Kedudukan Semasa | 65 |
Pegangan Terkini, Prestasi, AUM (dari 13F, 13D)
OMC Financial Services LTD telah mendedahkan 65 jumlah pegangan dalam pemfailan SEC terkini mereka. Nilai portfolio terkini dikira sebagai $ 244,726,741 USD. Aset Sebenar Di Bawah Pengurusan (AUM) ialah nilai ini ditambah dengan tunai (yang tidak didedahkan). Pegangan teratas OMC Financial Services LTD ialah NVIDIA Corporation (US:NVDA) , Apple Inc. (US:AAPL) , Mastercard Incorporated (US:MA) , Visa Inc. (US:V) , and Microsoft Corporation (US:MSFT) . Kedudukan baharu OMC Financial Services LTD termasuk GE Vernova Inc. (US:GEV) , Schwab Strategic Trust - Schwab International Dividend Equity ETF (US:SCHY) , General Electric Company (US:GE) , .
Kenaikan Teratas Suku Tahun Ini
Kami menggunakan perubahan dalam peruntukan portfolio kerana ini adalah metrik yang paling bermakna. Perubahan boleh disebabkan oleh perdagangan atau perubahan dalam harga saham.
| Sekuriti | Saham (MM) |
Nilai (MM$) |
Portfolio % | ΔPortfolio % |
|---|---|---|---|---|
| 0.21 | 33.14 | 13.5426 | 2.0215 | |
| 0.01 | 2.97 | 1.2130 | 1.2130 | |
| 0.09 | 2.55 | 1.0439 | 1.0439 | |
| 0.02 | 11.97 | 4.8911 | 0.7441 | |
| 0.05 | 6.90 | 2.8212 | 0.6542 | |
| 0.02 | 4.46 | 1.8242 | 0.6232 | |
| 0.01 | 5.49 | 2.2445 | 0.5045 | |
| 0.02 | 3.93 | 1.6044 | 0.4188 | |
| 0.01 | 7.02 | 2.8682 | 0.4053 | |
| 0.00 | 3.24 | 1.3242 | 0.2903 |
Penurunan Teratas Suku Tahun Ini
Kami menggunakan perubahan dalam peruntukan portfolio kerana ini adalah metrik yang paling bermakna. Perubahan boleh disebabkan oleh perdagangan atau perubahan dalam harga saham.
| Sekuriti | Saham (MM) |
Nilai (MM$) |
Portfolio % | ΔPortfolio % |
|---|---|---|---|---|
| 0.12 | 25.02 | 10.2228 | -2.5197 | |
| 0.05 | 9.56 | 3.9079 | -0.9820 | |
| 0.05 | 18.74 | 7.6572 | -0.9462 | |
| 0.04 | 10.68 | 4.3629 | -0.9238 | |
| 0.04 | 19.99 | 8.1685 | -0.8203 | |
| 0.02 | 5.68 | 2.3202 | -0.4434 | |
| 0.02 | 4.22 | 1.7247 | -0.3200 | |
| 0.02 | 2.10 | 0.8575 | -0.1673 | |
| 0.01 | 2.05 | 0.8381 | -0.1645 | |
| 0.01 | 0.95 | 0.3862 | -0.1625 |
13F dan Pemfailan Dana
Borang ini telah difailkan pada 2025-07-30 untuk tempoh pelaporan 2025-06-30. Klik ikon pautan untuk melihat sejarah transaksi penuh.
Tingkatkan untuk membuka data premium dan eksport ke Excel ![]() .
.
| Sekuriti | Jenis | Purata Harga Saham | Saham (MM) |
ΔSaham (%) |
ΔSaham (%) |
Nilai ($MM) |
Portfolio (%) |
ΔPortfolio (%) |
|
|---|---|---|---|---|---|---|---|---|---|
| NVDA / NVIDIA Corporation | 0.21 | -11.42 | 33.14 | 29.12 | 13.5426 | 2.0215 | |||
| AAPL / Apple Inc. | 0.12 | -4.59 | 25.02 | -11.88 | 10.2228 | -2.5197 | |||
| MA / Mastercard Incorporated | 0.04 | -2.63 | 19.99 | -0.18 | 8.1685 | -0.8203 | |||
| V / Visa Inc. | 0.05 | -3.50 | 18.74 | -2.23 | 7.6572 | -0.9462 | |||
| MSFT / Microsoft Corporation | 0.02 | -2.23 | 11.97 | 29.55 | 4.8911 | 0.7441 | |||
| GLD / SPDR Gold Trust | 0.04 | -14.31 | 10.68 | -9.35 | 4.3629 | -0.9238 | |||
| ABBV / AbbVie Inc. | 0.05 | -0.91 | 9.56 | -12.22 | 3.9079 | -0.9820 | |||
| META / Meta Platforms, Inc. | 0.01 | -0.11 | 7.02 | 27.92 | 2.8682 | 0.4053 | |||
| AMD / Advanced Micro Devices, Inc. | 0.05 | 3.54 | 6.90 | 43.03 | 2.8212 | 0.6542 | |||
| GOOGL / Alphabet Inc. | 0.03 | 1.20 | 5.90 | 15.34 | 2.4092 | 0.1145 | |||
| MCD / McDonald's Corporation | 0.02 | -1.41 | 5.68 | -7.78 | 2.3202 | -0.4434 | |||
| CRWD / CrowdStrike Holdings, Inc. | 0.01 | -1.91 | 5.49 | 41.69 | 2.2445 | 0.5045 | |||
| MAR / Marriott International, Inc. | 0.02 | -0.66 | 5.32 | 13.92 | 2.1734 | 0.0781 | |||
| AMZN / Amazon.com, Inc. | 0.02 | -3.40 | 5.08 | 11.40 | 2.0771 | 0.0287 | |||
| VST / Vistra Corp. | 0.02 | 1.10 | 4.46 | 66.88 | 1.8242 | 0.6232 | |||
| LOW / Lowe's Companies, Inc. | 0.02 | -2.60 | 4.22 | -7.35 | 1.7247 | -0.3200 | |||
| SNOW / Snowflake Inc. | 0.02 | -2.91 | 3.93 | 48.66 | 1.6044 | 0.4188 | |||
| NFLX / Netflix, Inc. | 0.00 | -2.02 | 3.24 | 40.69 | 1.3242 | 0.2903 | |||
| NOW / ServiceNow, Inc. | 0.00 | 2.01 | 3.18 | 31.72 | 1.2985 | 0.2157 | |||
| WMT / Walmart Inc. | 0.03 | -2.08 | 3.11 | 9.07 | 1.2722 | -0.0091 | |||
| CRM / Salesforce, Inc. | 0.01 | -0.99 | 3.06 | 0.59 | 1.2499 | -0.1148 | |||
| JPM / JPMorgan Chase & Co. | 0.01 | -0.14 | 3.03 | 18.05 | 1.2373 | 0.0857 | |||
| GEV / GE Vernova Inc. | 0.01 | 2.97 | 1.2130 | 1.2130 | |||||
| LMT / Lockheed Martin Corporation | 0.01 | -1.88 | 2.91 | 1.75 | 1.1875 | -0.0947 | |||
| SCHY / Schwab Strategic Trust - Schwab International Dividend Equity ETF | 0.09 | 2.55 | 1.0439 | 1.0439 | |||||
| HD / The Home Depot, Inc. | 0.01 | 4.87 | 2.35 | 4.91 | 0.9611 | -0.0452 | |||
| O / Realty Income Corporation | 0.04 | -0.60 | 2.29 | -1.29 | 0.9348 | -0.1054 | |||
| UNP / Union Pacific Corporation | 0.01 | -0.36 | 2.24 | -2.94 | 0.9166 | -0.1209 | |||
| SBUX / Starbucks Corporation | 0.02 | -1.61 | 2.10 | -8.10 | 0.8575 | -0.1673 | |||
| JNJ / Johnson & Johnson | 0.01 | -0.31 | 2.05 | -8.15 | 0.8381 | -0.1645 | |||
| TOL / Toll Brothers, Inc. | 0.02 | -4.09 | 2.01 | 3.71 | 0.8222 | -0.0490 | |||
| VYMI / Vanguard Whitehall Funds - Vanguard International High Dividend Yield ETF | 0.02 | -0.24 | 1.70 | 8.44 | 0.6933 | -0.0089 | |||
| VIGI / Vanguard Whitehall Funds - Vanguard International Dividend Appreciation ETF | 0.02 | 0.00 | 1.65 | 8.65 | 0.6724 | -0.0074 | |||
| AMGN / Amgen Inc. | 0.01 | 82.51 | 1.44 | 63.68 | 0.5893 | 0.1935 | |||
| BX / Blackstone Inc. | 0.01 | 1.12 | 1.37 | 8.22 | 0.5595 | -0.0085 | |||
| SCHZ / Schwab Strategic Trust - Schwab U.S. Aggregate Bond ETF | 0.06 | -4.62 | 1.32 | -4.35 | 0.5389 | -0.0796 | |||
| TSLA / Tesla, Inc. | 0.00 | -27.32 | 1.12 | -10.88 | 0.4586 | -0.1069 | |||
| GLW / Corning Incorporated | 0.02 | 0.00 | 1.01 | 14.89 | 0.4135 | 0.0181 | |||
| CVX / Chevron Corporation | 0.01 | -9.68 | 0.95 | -22.67 | 0.3862 | -0.1625 | |||
| XOM / Exxon Mobil Corporation | 0.01 | -0.24 | 0.89 | -9.55 | 0.3639 | -0.0782 | |||
| PG / The Procter & Gamble Company | 0.01 | 0.04 | 0.85 | -6.49 | 0.3476 | -0.0607 | |||
| SCHG / Schwab Strategic Trust - Schwab U.S. Large-Cap Growth ETF | 0.03 | -0.24 | 0.84 | 16.34 | 0.3436 | 0.0193 | |||
| F / Ford Motor Company | 0.08 | -5.52 | 0.82 | 2.25 | 0.3339 | -0.0250 | |||
| KO / The Coca-Cola Company | 0.01 | -1.78 | 0.78 | -2.99 | 0.3188 | -0.0421 | |||
| KMI / Kinder Morgan, Inc. | 0.02 | -0.82 | 0.71 | 2.16 | 0.2905 | -0.0217 | |||
| GD / General Dynamics Corporation | 0.00 | 0.00 | 0.69 | 6.99 | 0.2819 | -0.0075 | |||
| RTX / RTX Corporation | 0.00 | -6.84 | 0.62 | 2.67 | 0.2520 | -0.0175 | |||
| BDJ / BlackRock Enhanced Equity Dividend Trust | 0.07 | -1.33 | 0.60 | 2.06 | 0.2433 | -0.0187 | |||
| GOOG / Alphabet Inc. | 0.00 | 0.12 | 0.59 | 13.65 | 0.2416 | 0.0081 | |||
| ZTS / Zoetis Inc. | 0.00 | -3.81 | 0.59 | -8.80 | 0.2415 | -0.0497 | |||
| DGX / Quest Diagnostics Incorporated | 0.00 | 0.00 | 0.59 | 6.32 | 0.2407 | -0.0083 | |||
| SCHD / Schwab Strategic Trust - Schwab U.S. Dividend Equity ETF | 0.02 | -2.70 | 0.57 | -7.72 | 0.2347 | -0.0449 | |||
| VZ / Verizon Communications Inc. | 0.01 | -3.11 | 0.54 | -7.55 | 0.2203 | -0.0415 | |||
| SO / The Southern Company | 0.01 | 0.00 | 0.54 | -0.19 | 0.2202 | -0.0220 | |||
| ITW / Illinois Tool Works Inc. | 0.00 | 0.00 | 0.53 | -0.38 | 0.2172 | -0.0221 | |||
| NEM / Newmont Corporation | 0.01 | -0.83 | 0.52 | 19.72 | 0.2134 | 0.0175 | |||
| DIS / The Walt Disney Company | 0.00 | -7.18 | 0.40 | 16.67 | 0.1631 | 0.0095 | |||
| DUK / Duke Energy Corporation | 0.00 | 0.09 | 0.40 | -3.16 | 0.1630 | -0.0219 | |||
| PM / Philip Morris International Inc. | 0.00 | 0.00 | 0.39 | 14.84 | 0.1581 | 0.0067 | |||
| MO / Altria Group, Inc. | 0.01 | 0.00 | 0.30 | -2.28 | 0.1228 | -0.0153 | |||
| DOW / Dow Inc. | 0.01 | -3.30 | 0.27 | -26.76 | 0.1111 | -0.0553 | |||
| CL / Colgate-Palmolive Company | 0.00 | 0.00 | 0.26 | -3.00 | 0.1059 | -0.0140 | |||
| CAT / Caterpillar Inc. | 0.00 | 0.00 | 0.25 | 17.59 | 0.1039 | 0.0069 | |||
| GE / General Electric Company | 0.00 | 0.22 | 0.0903 | 0.0903 | |||||
| DVN / Devon Energy Corporation | 0.01 | -14.51 | 0.22 | -27.36 | 0.0881 | -0.0450 |