Statistik Asas
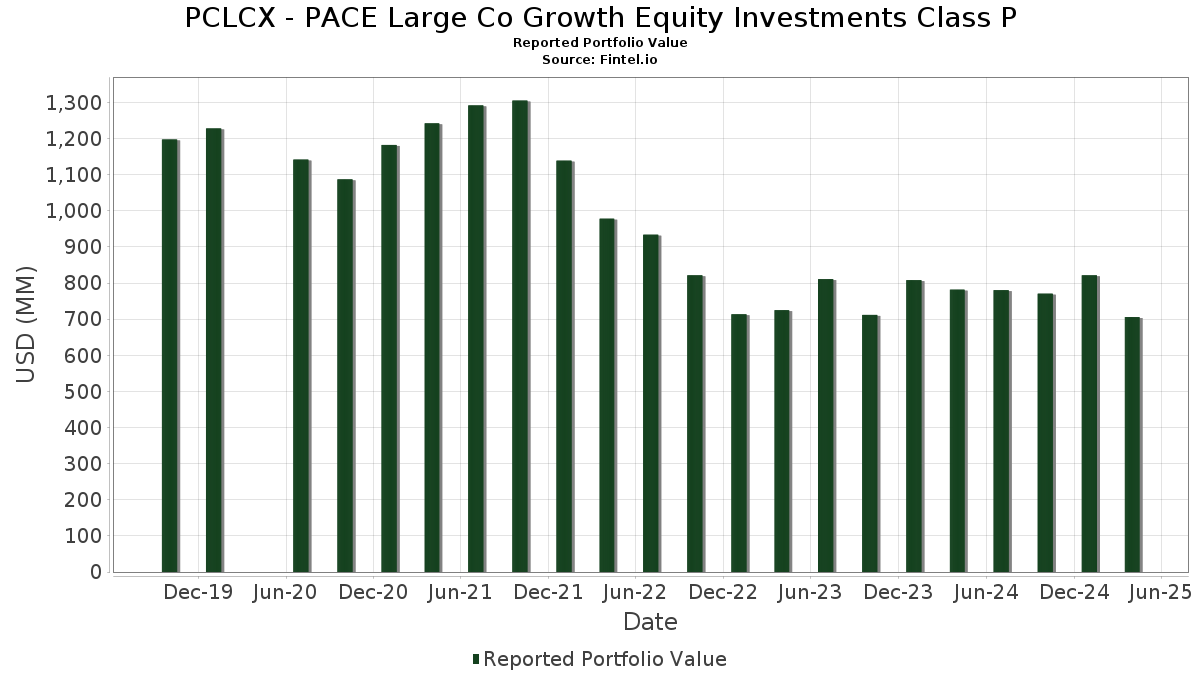
| Nilai Portfolio | $ 706,038,048 |
| Kedudukan Semasa | 111 |
Pegangan Terkini, Prestasi, AUM (dari 13F, 13D)
PCLCX - PACE Large Co Growth Equity Investments Class P telah mendedahkan 111 jumlah pegangan dalam pemfailan SEC terkini mereka. Nilai portfolio terkini dikira sebagai $ 706,038,048 USD. Aset Sebenar Di Bawah Pengurusan (AUM) ialah nilai ini ditambah dengan tunai (yang tidak didedahkan). Pegangan teratas PCLCX - PACE Large Co Growth Equity Investments Class P ialah Microsoft Corporation (US:MSFT) , Amazon.com, Inc. (US:AMZN) , State Street Institutional Investment Trust - State Street Institutional US Govt Money Market Fnd Premier Cls (US:GVMXX) , Alphabet Inc. (US:GOOG) , and NVIDIA Corporation (US:NVDA) . Kedudukan baharu PCLCX - PACE Large Co Growth Equity Investments Class P termasuk Expro Group Holdings N.V. (US:XPRO) , Aon plc (US:AON) , Gilead Sciences, Inc. (US:GILD) , Cincinnati Financial Corporation (US:CINF) , and CenterPoint Energy, Inc. (US:CNP) .
Kenaikan Teratas Suku Tahun Ini
Kami menggunakan perubahan dalam peruntukan portfolio kerana ini adalah metrik yang paling bermakna. Perubahan boleh disebabkan oleh perdagangan atau perubahan dalam harga saham.
| Sekuriti | Saham (MM) |
Nilai (MM$) |
Portfolio % | ΔPortfolio % |
|---|---|---|---|---|
| 0.08 | 14.01 | 1.9866 | 1.3447 | |
| 0.08 | 26.30 | 3.7286 | 1.1591 | |
| 0.03 | 6.10 | 0.8644 | 0.8644 | |
| 0.05 | 10.91 | 1.5471 | 0.7351 | |
| 0.01 | 5.13 | 0.7277 | 0.7277 | |
| 0.09 | 7.53 | 1.0673 | 0.6029 | |
| 0.11 | 10.21 | 1.4482 | 0.5833 | |
| 0.02 | 3.90 | 0.5529 | 0.5529 | |
| 0.01 | 3.70 | 0.5253 | 0.5253 | |
| 0.14 | 10.06 | 1.4259 | 0.5219 |
Penurunan Teratas Suku Tahun Ini
Kami menggunakan perubahan dalam peruntukan portfolio kerana ini adalah metrik yang paling bermakna. Perubahan boleh disebabkan oleh perdagangan atau perubahan dalam harga saham.
| Sekuriti | Saham (MM) |
Nilai (MM$) |
Portfolio % | ΔPortfolio % |
|---|---|---|---|---|
| 0.23 | 42.74 | 6.0602 | -2.0612 | |
| 0.02 | 5.53 | 0.7844 | -1.8961 | |
| 0.05 | 25.56 | 3.6248 | -1.4566 | |
| 33.69 | 33.69 | 4.7773 | -1.1406 | |
| 0.11 | 23.84 | 3.3810 | -1.0851 | |
| 0.01 | 1.20 | 0.1700 | -0.9544 | |
| 0.18 | 29.49 | 4.1816 | -0.8168 | |
| 0.00 | 0.38 | 0.0545 | -0.7944 | |
| 0.01 | 1.72 | 0.2435 | -0.5011 | |
| 0.26 | 28.49 | 4.0397 | -0.3641 |
13F dan Pemfailan Dana
Borang ini telah difailkan pada 2025-06-27 untuk tempoh pelaporan 2025-04-30. Klik ikon pautan untuk melihat sejarah transaksi penuh.
Tingkatkan untuk membuka data premium dan eksport ke Excel ![]() .
.
| Sekuriti | Jenis | Purata Harga Saham | Saham (MM) |
ΔSaham (%) |
ΔSaham (%) |
Nilai ($MM) |
Portfolio (%) |
ΔPortfolio (%) |
|
|---|---|---|---|---|---|---|---|---|---|
| MSFT / Microsoft Corporation | 0.12 | -10.72 | 46.38 | -14.98 | 6.5762 | -0.0804 | |||
| AMZN / Amazon.com, Inc. | 0.23 | -17.24 | 42.74 | -35.78 | 6.0602 | -2.0612 | |||
| GVMXX / State Street Institutional Investment Trust - State Street Institutional US Govt Money Market Fnd Premier Cls | 33.69 | -30.53 | 33.69 | -30.53 | 4.7773 | -1.1406 | |||
| GOOG / Alphabet Inc. | 0.18 | -7.99 | 29.49 | -28.00 | 4.1816 | -0.8168 | |||
| NVDA / NVIDIA Corporation | 0.26 | -12.97 | 28.49 | -21.05 | 4.0397 | -0.3641 | |||
| V / Visa Inc. | 0.08 | 23.55 | 26.30 | 24.89 | 3.7286 | 1.1591 | |||
| META / Meta Platforms, Inc. | 0.05 | -22.93 | 25.56 | -38.61 | 3.6248 | -1.4566 | |||
| MA / Mastercard Incorporated | 0.05 | -7.04 | 24.68 | -8.28 | 3.5001 | 0.2161 | |||
| NFLX / Netflix, Inc. | 0.02 | -17.59 | 24.61 | -4.52 | 3.4893 | 0.3443 | |||
| AAPL / Apple Inc. | 0.11 | -27.64 | 23.84 | -34.85 | 3.3810 | -1.0851 | |||
| LLY / Eli Lilly and Company | 0.02 | -21.78 | 21.79 | -13.30 | 3.0899 | 0.0227 | |||
| NOW / ServiceNow, Inc. | 0.02 | -1.73 | 14.77 | -7.85 | 2.0945 | 0.1384 | |||
| ABT / Abbott Laboratories | 0.11 | -2.41 | 14.43 | -0.26 | 2.0467 | 0.2807 | |||
| PM / Philip Morris International Inc. | 0.08 | 102.37 | 14.01 | 166.35 | 1.9866 | 1.3447 | |||
| ORCL / Oracle Corporation | 0.09 | -2.00 | 12.19 | -18.91 | 1.7283 | -0.1059 | |||
| SHOP / Shopify Inc. | 0.12 | -5.91 | 11.06 | -23.47 | 1.5677 | -0.1952 | |||
| IBM / International Business Machines Corporation | 0.05 | 73.38 | 10.91 | 63.98 | 1.5471 | 0.7351 | |||
| WMT / Walmart Inc. | 0.11 | 45.46 | 10.21 | 44.11 | 1.4482 | 0.5833 | |||
| KO / The Coca-Cola Company | 0.14 | 18.78 | 10.06 | 35.76 | 1.4259 | 0.5219 | |||
| AVGO / Broadcom Inc. | 0.05 | -8.36 | 9.82 | -20.29 | 1.3926 | -0.1108 | |||
| ZTS / Zoetis Inc. | 0.05 | -8.86 | 7.91 | -16.59 | 1.1219 | -0.0357 | |||
| SBUX / Starbucks Corporation | 0.09 | 166.05 | 7.53 | 97.82 | 1.0673 | 0.6029 | |||
| MMM / 3M Company | 0.05 | 31.50 | 7.01 | 20.02 | 0.9946 | 0.2814 | |||
| BRK.B / Berkshire Hathaway Inc. | 0.01 | -6.00 | 6.81 | 6.95 | 0.9662 | 0.1888 | |||
| TMO / Thermo Fisher Scientific Inc. | 0.01 | -8.67 | 6.39 | -34.46 | 0.9055 | -0.2835 | |||
| DASH / DoorDash, Inc. | 0.03 | 7.61 | 6.16 | 9.92 | 0.8740 | 0.1897 | |||
| XPRO / Expro Group Holdings N.V. | 0.03 | 6.10 | 0.8644 | 0.8644 | |||||
| JNJ / Johnson & Johnson | 0.04 | -5.86 | 6.02 | -3.30 | 0.8532 | 0.0940 | |||
| MSCI / MSCI Inc. | 0.01 | -8.90 | 5.91 | -16.79 | 0.8377 | -0.0287 | |||
| ADBE / Adobe Inc. | 0.02 | -8.80 | 5.85 | -21.83 | 0.8296 | -0.0837 | |||
| MCD / McDonald's Corporation | 0.02 | -5.84 | 5.71 | 4.27 | 0.8102 | 0.1414 | |||
| TSLA / Tesla, Inc. | 0.02 | -63.89 | 5.53 | -74.82 | 0.7844 | -1.8961 | |||
| ABNB / Airbnb, Inc. | 0.05 | -8.75 | 5.53 | -15.18 | 0.7841 | -0.0115 | |||
| MCK / McKesson Corporation | 0.01 | 8.99 | 5.46 | 30.61 | 0.7746 | 0.2642 | |||
| ACN / Accenture plc | 0.02 | -8.79 | 5.24 | -29.13 | 0.7436 | -0.1593 | |||
| CRM / Salesforce, Inc. | 0.02 | 2.18 | 5.20 | -19.64 | 0.7372 | -0.0524 | |||
| AON / Aon plc | 0.01 | 5.13 | 0.7277 | 0.7277 | |||||
| GS / The Goldman Sachs Group, Inc. | 0.01 | -32.26 | 5.09 | -42.08 | 0.7224 | -0.3509 | |||
| WDAY / Workday, Inc. | 0.02 | -8.86 | 5.07 | -14.81 | 0.7196 | -0.0072 | |||
| T / AT&T Inc. | 0.18 | 0.00 | 5.06 | 16.74 | 0.7180 | 0.1886 | |||
| ISRG / Intuitive Surgical, Inc. | 0.01 | -35.18 | 4.70 | -41.55 | 0.6668 | -0.3148 | |||
| UNP / Union Pacific Corporation | 0.02 | 3.58 | 4.60 | -9.86 | 0.6524 | 0.0296 | |||
| SPOT / Spotify Technology S.A. | 0.01 | -43.06 | 4.54 | -36.26 | 0.6441 | -0.2256 | |||
| MELI / MercadoLibre, Inc. | 0.00 | 7.51 | 4.54 | 30.35 | 0.6432 | 0.2186 | |||
| BABA / Alibaba Group Holding Limited - Depositary Receipt (Common Stock) | 0.04 | 68.30 | 4.46 | 103.38 | 0.6321 | 0.3646 | |||
| AZO / AutoZone, Inc. | 0.00 | 6.44 | 4.41 | 19.56 | 0.6258 | 0.1753 | |||
| DHI / D.R. Horton, Inc. | 0.03 | -35.91 | 4.37 | -42.94 | 0.6198 | -0.3150 | |||
| TDG / TransDigm Group Incorporated | 0.00 | -13.30 | 4.32 | -9.48 | 0.6123 | 0.0302 | |||
| BKNG / Booking Holdings Inc. | 0.00 | 34.92 | 4.04 | 45.25 | 0.5727 | 0.2333 | |||
| ABBV / AbbVie Inc. | 0.02 | 3.90 | 0.5529 | 0.5529 | |||||
| INTU / Intuit Inc. | 0.01 | -6.46 | 3.90 | -2.43 | 0.5525 | 0.0652 | |||
| VZ / Verizon Communications Inc. | 0.09 | 130.85 | 3.82 | 141.47 | 0.5417 | 0.3429 | |||
| IDXX / IDEXX Laboratories, Inc. | 0.01 | 3.70 | 0.5253 | 0.5253 | |||||
| PAYC / Paycom Software, Inc. | 0.02 | -8.86 | 3.61 | -0.61 | 0.5114 | 0.0687 | |||
| PGR / The Progressive Corporation | 0.01 | 15.26 | 3.29 | 31.77 | 0.4665 | 0.1618 | |||
| AEP / American Electric Power Company, Inc. | 0.03 | 50.49 | 3.22 | 65.79 | 0.4571 | 0.2198 | |||
| CSGP / CoStar Group, Inc. | 0.04 | 6.53 | 3.21 | 3.15 | 0.4554 | 0.0755 | |||
| CI / The Cigna Group | 0.01 | 0.00 | 3.10 | 15.60 | 0.4392 | 0.1122 | |||
| AIG / American International Group, Inc. | 0.04 | 6.67 | 3.09 | 68.05 | 0.4377 | 0.2409 | |||
| MO / Altria Group, Inc. | 0.05 | 2.99 | 0.4243 | 0.4243 | |||||
| SCHW / The Charles Schwab Corporation | 0.03 | 2.83 | 0.4019 | 0.4019 | |||||
| UNH / UnitedHealth Group Incorporated | 0.01 | -37.56 | 2.62 | -52.65 | 0.3716 | -0.3037 | |||
| PANW / Palo Alto Networks, Inc. | 0.01 | -6.48 | 2.50 | -5.20 | 0.3540 | 0.0326 | |||
| IT / Gartner, Inc. | 0.01 | -8.92 | 2.28 | -29.36 | 0.3235 | -0.0706 | |||
| TT / Trane Technologies plc | 0.01 | -5.83 | 2.25 | -0.49 | 0.3188 | 0.0431 | |||
| TSM / Taiwan Semiconductor Manufacturing Company Limited - Depositary Receipt (Common Stock) | 0.01 | -27.90 | 2.24 | -42.59 | 0.3183 | -0.1588 | |||
| HUBS / HubSpot, Inc. | 0.00 | -6.60 | 2.23 | -26.74 | 0.3155 | -0.0551 | |||
| APH / Amphenol Corporation | 0.03 | -5.91 | 2.19 | 2.29 | 0.3109 | 0.0493 | |||
| DUK / Duke Energy Corporation | 0.02 | 20.31 | 2.14 | 27.37 | 0.3030 | 0.0922 | |||
| FICO / Fair Isaac Corporation | 0.00 | -6.15 | 2.13 | -0.33 | 0.3016 | 0.0412 | |||
| GILD / Gilead Sciences, Inc. | 0.02 | 2.04 | 0.2888 | 0.2888 | |||||
| EXC / Exelon Corporation | 0.04 | 2.02 | 0.2860 | 0.2860 | |||||
| PWR / Quanta Services, Inc. | 0.01 | -6.07 | 2.00 | -10.60 | 0.2835 | 0.0105 | |||
| XOM / Exxon Mobil Corporation | 0.02 | 66.43 | 1.97 | 64.52 | 0.2789 | 0.1330 | |||
| COP / ConocoPhillips | 0.02 | 58.51 | 1.83 | 42.98 | 0.2600 | 0.1034 | |||
| GWW / W.W. Grainger, Inc. | 0.00 | -6.35 | 1.81 | -9.71 | 0.2572 | 0.0120 | |||
| ALL / The Allstate Corporation | 0.01 | 7.15 | 1.72 | 10.48 | 0.2437 | 0.0539 | |||
| BX / Blackstone Inc. | 0.01 | -62.15 | 1.72 | -71.86 | 0.2435 | -0.5011 | |||
| ANET / Arista Networks Inc | 0.02 | -47.03 | 1.66 | -62.19 | 0.2353 | -0.3002 | |||
| CINF / Cincinnati Financial Corporation | 0.01 | 1.56 | 0.2219 | 0.2219 | |||||
| NEE / NextEra Energy, Inc. | 0.02 | -3.41 | 1.56 | -9.73 | 0.2210 | 0.0103 | |||
| CME / CME Group Inc. | 0.01 | 1.56 | 0.2209 | 0.2209 | |||||
| LNG / Cheniere Energy, Inc. | 0.01 | 68.05 | 1.51 | 73.70 | 0.2136 | 0.1077 | |||
| CNP / CenterPoint Energy, Inc. | 0.04 | 1.46 | 0.2066 | 0.2066 | |||||
| UBER / Uber Technologies, Inc. | 0.02 | -6.16 | 1.42 | 13.72 | 0.2010 | 0.0489 | |||
| TWLO / Twilio Inc. | 0.01 | 99.10 | 1.40 | 31.34 | 0.1991 | 0.0687 | |||
| EW / Edwards Lifesciences Corporation | 0.02 | 47.78 | 1.38 | 53.98 | 0.1950 | 0.0860 | |||
| ETN / Eaton Corporation plc | 0.00 | -6.13 | 1.35 | -15.39 | 0.1918 | -0.0032 | |||
| KR / The Kroger Co. | 0.02 | 1.35 | 0.1916 | 0.1916 | |||||
| ICE / Intercontinental Exchange, Inc. | 0.01 | 38.76 | 1.35 | 49.56 | 0.1910 | 0.0778 | |||
| DE / Deere & Company | 0.00 | -0.10 | 1.34 | 18.31 | 0.1906 | 0.0449 | |||
| BDX / Becton, Dickinson and Company | 0.01 | 1.32 | 0.1876 | 0.1876 | |||||
| NTRA / Natera, Inc. | 0.01 | 22.54 | 1.30 | 4.59 | 0.1841 | 0.0325 | |||
| HD / The Home Depot, Inc. | 0.00 | -38.12 | 1.29 | -45.86 | 0.1826 | -0.1076 | |||
| RTX / RTX Corporation | 0.01 | 1.28 | 0.1810 | 0.1810 | |||||
| BMY / Bristol-Myers Squibb Company | 0.02 | 1.20 | 0.1707 | 0.1707 | |||||
| KKR / KKR & Co. Inc. | 0.01 | -80.98 | 1.20 | -87.00 | 0.1700 | -0.9544 | |||
| LRCX / Lam Research Corporation | 0.02 | -31.57 | 1.19 | -39.51 | 0.1685 | -0.0712 | |||
| ELV / Elevance Health, Inc. | 0.00 | 1.66 | 1.18 | -19.13 | 0.1680 | -0.0199 | |||
| SNPS / Synopsys, Inc. | 0.00 | -6.44 | 1.17 | -18.26 | 0.1664 | -0.0088 | |||
| SNOW / Snowflake Inc. | 0.01 | -27.02 | 1.03 | -35.91 | 0.1462 | -0.0500 | |||
| PPL / PPL Corporation | 0.03 | 1.02 | 0.1443 | 0.1443 | |||||
| XEL / Xcel Energy Inc. | 0.01 | 0.91 | 0.1285 | 0.1285 | |||||
| ATO / Atmos Energy Corporation | 0.00 | 0.68 | 0.0961 | 0.0961 | |||||
| MNST / Monster Beverage Corporation | 0.01 | -6.48 | 0.63 | 15.51 | 0.0898 | 0.0229 | |||
| APP / AppLovin Corporation | 0.00 | -92.42 | 0.38 | -94.48 | 0.0545 | -0.7944 | |||
| MDB / MongoDB, Inc. | 0.00 | -6.33 | 0.37 | -41.01 | 0.0531 | -0.0243 | |||
| FCX / Freeport-McMoRan Inc. | 0.01 | -6.49 | 0.29 | -6.11 | 0.0415 | 0.0035 | |||
| ASML / ASML Holding N.V. - Depositary Receipt (Common Stock) | 0.00 | -6.40 | 0.23 | -15.52 | 0.0333 | -0.0006 | |||
| CMG / Chipotle Mexican Grill, Inc. | 0.00 | -81.48 | 0.21 | -83.99 | 0.0304 | -0.1328 | |||
| TTD / The Trade Desk, Inc. | 0.00 | -84.70 | 0.14 | -93.09 | 0.0197 | -0.2258 | |||
| RBLX / Roblox Corporation | 0.00 | -100.00 | 0.00 | -100.00 | -0.0480 | ||||
| CCL / Carnival Corporation & plc | 0.00 | -100.00 | 0.00 | -100.00 | -0.1537 | ||||
| RDDT / Reddit, Inc. | 0.00 | -100.00 | 0.00 | -100.00 | -0.1324 | ||||
| NVO / Novo Nordisk A/S - Depositary Receipt (Common Stock) | 0.00 | -100.00 | 0.00 | -100.00 | -0.2065 | ||||
| AXON / Axon Enterprise, Inc. | 0.00 | -100.00 | 0.00 | -100.00 | -0.1577 | ||||
| IBKR / Interactive Brokers Group, Inc. | 0.00 | -100.00 | 0.00 | -100.00 | -0.0149 | ||||
| HOOD / Robinhood Markets, Inc. | 0.00 | -100.00 | 0.00 | -100.00 | -0.1912 |