Statistik Asas
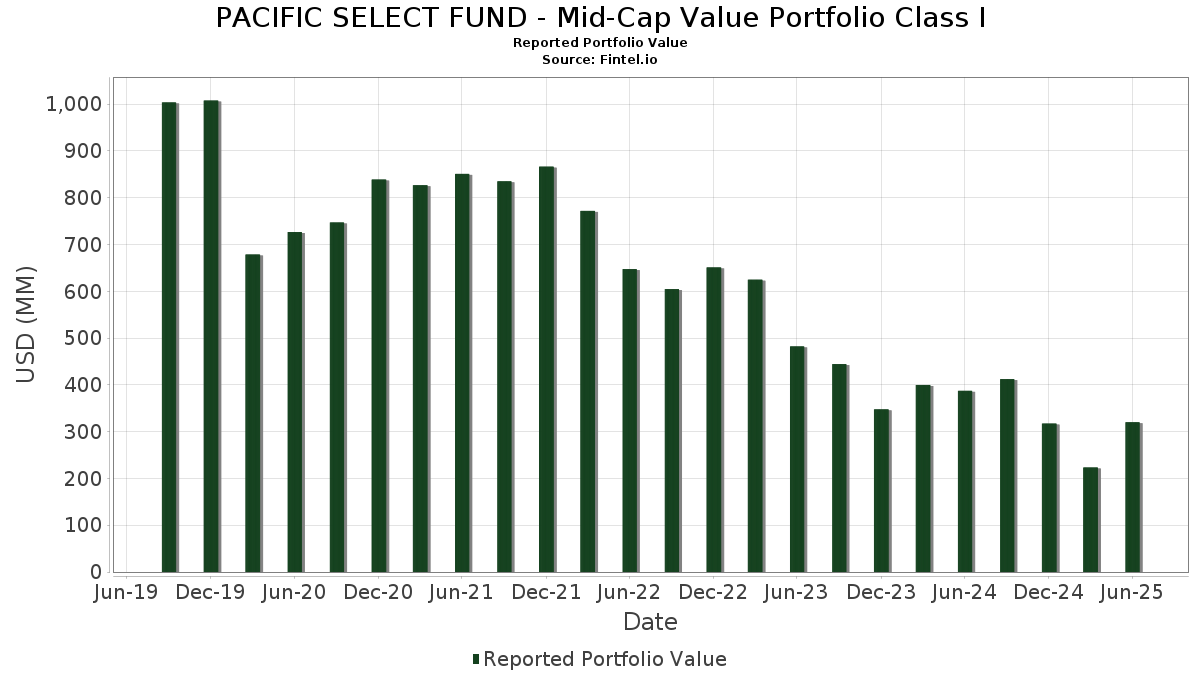
| Nilai Portfolio | $ 320,070,882 |
| Kedudukan Semasa | 131 |
Pegangan Terkini, Prestasi, AUM (dari 13F, 13D)
PACIFIC SELECT FUND - Mid-Cap Value Portfolio Class I telah mendedahkan 131 jumlah pegangan dalam pemfailan SEC terkini mereka. Nilai portfolio terkini dikira sebagai $ 320,070,882 USD. Aset Sebenar Di Bawah Pengurusan (AUM) ialah nilai ini ditambah dengan tunai (yang tidak didedahkan). Pegangan teratas PACIFIC SELECT FUND - Mid-Cap Value Portfolio Class I ialah Ameriprise Financial, Inc. (US:AMP) , LPL Financial Holdings Inc. (US:LPLA) , Howmet Aerospace Inc. (US:HWM) , AutoZone, Inc. (US:AZO) , and Norfolk Southern Corporation (US:NSC) . Kedudukan baharu PACIFIC SELECT FUND - Mid-Cap Value Portfolio Class I termasuk Jabil Inc. (US:JBL) , Stifel Financial Corp. (US:SF) , Seagate Technology Holdings plc (US:STX) , Brown & Brown, Inc. (US:BRO) , and Crocs, Inc. (US:CROX) .
Kenaikan Teratas Suku Tahun Ini
Kami menggunakan perubahan dalam peruntukan portfolio kerana ini adalah metrik yang paling bermakna. Perubahan boleh disebabkan oleh perdagangan atau perubahan dalam harga saham.
| Sekuriti | Saham (MM) |
Nilai (MM$) |
Portfolio % | ΔPortfolio % |
|---|---|---|---|---|
| 3.76 | 1.1721 | 1.1721 | ||
| 0.10 | 3.32 | 1.0348 | 0.8729 | |
| 0.01 | 2.71 | 0.8465 | 0.8465 | |
| 0.02 | 2.44 | 0.7618 | 0.7618 | |
| 0.01 | 2.00 | 0.6248 | 0.6248 | |
| 0.02 | 2.90 | 0.9044 | 0.6197 | |
| 0.02 | 3.19 | 0.9944 | 0.5532 | |
| 0.02 | 1.77 | 0.5526 | 0.5526 | |
| 0.02 | 1.73 | 0.5403 | 0.5403 | |
| 0.01 | 1.72 | 0.5369 | 0.5369 |
Penurunan Teratas Suku Tahun Ini
Kami menggunakan perubahan dalam peruntukan portfolio kerana ini adalah metrik yang paling bermakna. Perubahan boleh disebabkan oleh perdagangan atau perubahan dalam harga saham.
| Sekuriti | Saham (MM) |
Nilai (MM$) |
Portfolio % | ΔPortfolio % |
|---|---|---|---|---|
| 0.06 | 2.27 | 0.7092 | -0.6884 | |
| 0.01 | 4.34 | 1.3527 | -0.5523 | |
| 0.02 | 4.27 | 1.3308 | -0.4578 | |
| 0.04 | 1.65 | 0.5150 | -0.4131 | |
| 0.03 | 3.04 | 0.9472 | -0.3717 | |
| 0.00 | 0.00 | -0.2997 | ||
| 0.00 | 5.62 | 1.7549 | -0.2898 | |
| 0.00 | 1.80 | 0.5610 | -0.2891 | |
| 0.01 | 2.01 | 0.6277 | -0.2542 | |
| 0.01 | 1.31 | 0.4074 | -0.2424 |
13F dan Pemfailan Dana
Borang ini telah difailkan pada 2025-08-18 untuk tempoh pelaporan 2025-06-30. Klik ikon pautan untuk melihat sejarah transaksi penuh.
Tingkatkan untuk membuka data premium dan eksport ke Excel ![]() .
.
| Sekuriti | Jenis | Purata Harga Saham | Saham (MM) |
ΔSaham (%) |
ΔSaham (%) |
Nilai ($MM) |
Portfolio (%) |
ΔPortfolio (%) |
|
|---|---|---|---|---|---|---|---|---|---|
| AMP / Ameriprise Financial, Inc. | 0.01 | 39.10 | 6.58 | 53.38 | 2.0541 | 0.1810 | |||
| LPLA / LPL Financial Holdings Inc. | 0.02 | 39.87 | 6.24 | 60.35 | 1.9484 | 0.2489 | |||
| HWM / Howmet Aerospace Inc. | 0.03 | -7.85 | 5.77 | 32.21 | 1.7997 | -0.1039 | |||
| AZO / AutoZone, Inc. | 0.00 | 23.27 | 5.62 | 20.04 | 1.7549 | -0.2898 | |||
| NSC / Norfolk Southern Corporation | 0.02 | 32.22 | 5.08 | 42.93 | 1.5854 | 0.0338 | |||
| COR / Cencora, Inc. | 0.01 | -7.90 | 4.34 | -0.69 | 1.3527 | -0.5523 | |||
| CHKP / Check Point Software Technologies Ltd. | 0.02 | 7.19 | 4.27 | 4.08 | 1.3308 | -0.4578 | |||
| TXT / Textron Inc. | 0.05 | 32.21 | 4.25 | 46.91 | 1.3263 | 0.0639 | |||
| EVR / Evercore Inc. | 0.02 | 46.82 | 4.19 | 98.53 | 1.3078 | 0.3865 | |||
| SPG / Simon Property Group, Inc. | 0.03 | 32.22 | 4.04 | 28.01 | 1.2607 | -0.1168 | |||
| ALLE / Allegion plc | 0.03 | 32.22 | 3.90 | 46.05 | 1.2185 | 0.0519 | |||
| MKL / Markel Group Inc. | 0.00 | 32.21 | 3.90 | 41.22 | 1.2178 | 0.0120 | |||
| SGI / Somnigroup International Inc. | 0.06 | 37.28 | 3.86 | 56.00 | 1.2040 | 0.1247 | |||
| CLEAR STREET / RA (000000000) | 3.76 | 1.1721 | 1.1721 | ||||||
| HBAN / Huntington Bancshares Incorporated | 0.22 | 32.22 | 3.74 | 47.63 | 1.1655 | 0.0615 | |||
| USFD / US Foods Holding Corp. | 0.05 | 32.21 | 3.72 | 55.56 | 1.1611 | 0.1172 | |||
| CG / The Carlyle Group Inc. | 0.07 | 32.21 | 3.67 | 55.95 | 1.1445 | 0.1179 | |||
| EBAY / eBay Inc. | 0.05 | 32.21 | 3.64 | 45.35 | 1.1354 | 0.0430 | |||
| KEYS / Keysight Technologies, Inc. | 0.02 | 32.21 | 3.53 | 44.65 | 1.1000 | 0.0366 | |||
| RBA / RB Global, Inc. | 0.03 | 32.22 | 3.53 | 39.99 | 1.0999 | 0.0011 | |||
| DTE / DTE Energy Company | 0.03 | 19.55 | 3.48 | 14.51 | 1.0865 | -0.2402 | |||
| MAS / Masco Corporation | 0.05 | 60.47 | 3.46 | 48.52 | 1.0784 | 0.0630 | |||
| MPC / Marathon Petroleum Corporation | 0.02 | 32.22 | 3.44 | 50.72 | 1.0748 | 0.0778 | |||
| NVR / NVR, Inc. | 0.00 | 56.85 | 3.38 | 59.91 | 1.0555 | 0.1324 | |||
| FTI / TechnipFMC plc | 0.10 | 722.77 | 3.32 | 796.22 | 1.0348 | 0.8729 | |||
| RS / Reliance, Inc. | 0.01 | 32.21 | 3.29 | 43.75 | 1.0264 | 0.0277 | |||
| MCHP / Microchip Technology Incorporated | 0.05 | 59.96 | 3.26 | 132.64 | 1.0164 | 0.4051 | |||
| THC / Tenet Healthcare Corporation | 0.02 | 140.83 | 3.19 | 215.23 | 0.9944 | 0.5532 | |||
| EWBC / East West Bancorp, Inc. | 0.03 | 95.63 | 3.18 | 120.04 | 0.9938 | 0.3623 | |||
| SYF / Synchrony Financial | 0.05 | 16.79 | 3.13 | 47.22 | 0.9767 | 0.0490 | |||
| EQT / EQT Corporation | 0.05 | 19.76 | 3.05 | 30.72 | 0.9521 | -0.0665 | |||
| EXPD / Expeditors International of Washington, Inc. | 0.03 | 5.71 | 3.04 | 0.43 | 0.9472 | -0.3717 | |||
| ZBRA / Zebra Technologies Corporation | 0.01 | 32.22 | 3.01 | 44.26 | 0.9378 | 0.0289 | |||
| CF / CF Industries Holdings, Inc. | 0.03 | 15.00 | 2.99 | 35.37 | 0.9316 | -0.0307 | |||
| RRC / Range Resources Corporation | 0.07 | 32.21 | 2.93 | 34.65 | 0.9132 | -0.0351 | |||
| CDW / CDW Corporation | 0.02 | 212.88 | 2.90 | 147.06 | 0.9044 | 0.6197 | |||
| LAMR / Lamar Advertising Company | 0.02 | 32.21 | 2.86 | 41.01 | 0.8938 | 0.0075 | |||
| GNRC / Generac Holdings Inc. | 0.02 | 32.22 | 2.74 | 49.54 | 0.8544 | 0.0552 | |||
| JBL / Jabil Inc. | 0.01 | 2.71 | 0.8465 | 0.8465 | |||||
| SYY / Sysco Corporation | 0.04 | 17.28 | 2.68 | 18.37 | 0.8363 | -0.1516 | |||
| FTDR / Frontdoor, Inc. | 0.05 | 32.22 | 2.66 | 102.82 | 0.8291 | 0.2575 | |||
| PKG / Packaging Corporation of America | 0.01 | 32.21 | 2.63 | 25.80 | 0.8218 | -0.0916 | |||
| BYD / Boyd Gaming Corporation | 0.03 | 32.21 | 2.63 | 57.14 | 0.8204 | 0.0902 | |||
| OGE / OGE Energy Corp. | 0.06 | 59.00 | 2.63 | 53.54 | 0.8200 | 0.0731 | |||
| CACI / CACI International Inc | 0.01 | 115.30 | 2.62 | 179.79 | 0.8163 | 0.4082 | |||
| FLEX / Flex Ltd. | 0.05 | 32.21 | 2.61 | 99.54 | 0.8157 | 0.2440 | |||
| EFX / Equifax Inc. | 0.01 | 32.21 | 2.61 | 40.82 | 0.8139 | 0.0055 | |||
| DELL / Dell Technologies Inc. | 0.02 | 122.49 | 2.58 | 199.42 | 0.8035 | 0.4280 | |||
| REG / Regency Centers Corporation | 0.04 | 19.16 | 2.57 | 15.08 | 0.8027 | -0.1728 | |||
| SOLV / Solventum Corporation | 0.03 | 32.21 | 2.56 | 31.87 | 0.7994 | -0.0484 | |||
| SLM / SLM Corporation | 0.08 | 32.21 | 2.56 | 47.64 | 0.7990 | 0.0420 | |||
| ESS / Essex Property Trust, Inc. | 0.01 | 73.67 | 2.55 | 60.63 | 0.7945 | 0.1024 | |||
| GEN / Gen Digital Inc. | 0.09 | 32.21 | 2.54 | 46.49 | 0.7938 | 0.0359 | |||
| NTAP / NetApp, Inc. | 0.02 | 135.53 | 2.52 | 185.94 | 0.7871 | 0.4018 | |||
| LRCX / Lam Research Corporation | 0.03 | 105.03 | 2.52 | 174.56 | 0.7850 | 0.3851 | |||
| SF / Stifel Financial Corp. | 0.02 | 2.44 | 0.7618 | 0.7618 | |||||
| ETR / Entergy Corporation | 0.03 | 17.74 | 2.43 | 14.45 | 0.7588 | -0.1682 | |||
| MOS / The Mosaic Company | 0.06 | 15.98 | 2.36 | 56.66 | 0.7377 | 0.0791 | |||
| AMG / Affiliated Managers Group, Inc. | 0.01 | 32.21 | 2.34 | 54.82 | 0.7316 | 0.0708 | |||
| SSNC / SS&C Technologies Holdings, Inc. | 0.03 | 8.19 | 2.32 | 7.21 | 0.7245 | -0.2203 | |||
| PRMB / Primo Brands Corporation | 0.08 | 51.60 | 2.30 | 26.54 | 0.7188 | -0.0757 | |||
| WTS / Watts Water Technologies, Inc. | 0.01 | 32.22 | 2.29 | 59.42 | 0.7159 | 0.0880 | |||
| FITB / Fifth Third Bancorp | 0.06 | -32.37 | 2.27 | -29.04 | 0.7092 | -0.6884 | |||
| BLD / TopBuild Corp. | 0.01 | 169.74 | 2.27 | 186.35 | 0.7068 | 0.3616 | |||
| AME / AMETEK, Inc. | 0.01 | 1.57 | 2.22 | 6.77 | 0.6940 | -0.2149 | |||
| BALL / Ball Corporation | 0.04 | 32.21 | 2.20 | 42.38 | 0.6880 | 0.0124 | |||
| LDOS / Leidos Holdings, Inc. | 0.01 | 32.22 | 2.20 | 54.57 | 0.6861 | 0.0654 | |||
| TE Connectivity PLC / EC (IE000IVNQZ81) | 0.01 | 94.31 | 2.20 | 132.10 | 0.6860 | 0.2723 | |||
| COKE / Coca-Cola Consolidated, Inc. | 0.02 | 1,222.21 | 2.18 | 9.38 | 0.6804 | -0.1897 | |||
| RKT / Rocket Companies, Inc. | 0.15 | 58.45 | 2.16 | 86.23 | 0.6755 | 0.1680 | |||
| FAF / First American Financial Corporation | 0.04 | 57.22 | 2.15 | 47.13 | 0.6713 | 0.0330 | |||
| BXP / Boston Properties, Inc. | 0.03 | 53.70 | 2.11 | 54.36 | 0.6578 | 0.0618 | |||
| EGP / EastGroup Properties, Inc. | 0.01 | 32.22 | 2.07 | 25.44 | 0.6463 | -0.0742 | |||
| MAR / Marriott International, Inc. | 0.01 | 36.92 | 2.06 | 54.70 | 0.6427 | 0.2990 | |||
| RL / Ralph Lauren Corporation | 0.01 | -1.53 | 2.01 | 22.36 | 0.6287 | -0.0899 | |||
| FANG / Diamondback Energy, Inc. | 0.01 | 15.82 | 2.01 | -0.45 | 0.6277 | -0.2542 | |||
| EQH / Equitable Holdings, Inc. | 0.04 | 122.97 | 2.01 | 140.31 | 0.6270 | 0.2619 | |||
| STX / Seagate Technology Holdings plc | 0.01 | 2.00 | 0.6248 | 0.6248 | |||||
| IDCC / InterDigital, Inc. | 0.01 | 32.21 | 1.96 | 43.42 | 0.6123 | 0.0151 | |||
| VOYA / Voya Financial, Inc. | 0.03 | 168.96 | 1.96 | 181.99 | 0.6109 | 0.3078 | |||
| NRG / NRG Energy, Inc. | 0.01 | 44.61 | 1.95 | 143.20 | 0.6081 | 0.2585 | |||
| TRV / The Travelers Companies, Inc. | 0.01 | 13.95 | 1.94 | 15.29 | 0.6050 | -0.1289 | |||
| LHX / L3Harris Technologies, Inc. | 0.01 | -16.57 | 1.93 | 0.00 | 0.6030 | -0.2404 | |||
| UFPI / UFP Industries, Inc. | 0.02 | 69.07 | 1.89 | 56.93 | 0.5901 | 0.0643 | |||
| HRB / H&R Block, Inc. | 0.03 | 15.75 | 1.86 | 15.78 | 0.5816 | -0.1213 | |||
| CART / Maplebear Inc. | 0.04 | 161.49 | 1.86 | 196.81 | 0.5801 | 0.3065 | |||
| ELS / Equity LifeStyle Properties, Inc. | 0.03 | 32.21 | 1.84 | 22.27 | 0.5739 | -0.0826 | |||
| CMC / Commercial Metals Company | 0.04 | 32.21 | 1.81 | 40.59 | 0.5642 | 0.0028 | |||
| ROST / Ross Stores, Inc. | 0.01 | 15.39 | 1.80 | 15.14 | 0.5626 | -0.1203 | |||
| PH / Parker-Hannifin Corporation | 0.00 | -19.69 | 1.80 | -7.75 | 0.5610 | -0.2891 | |||
| ARW / Arrow Electronics, Inc. | 0.01 | 41.59 | 1.80 | 73.77 | 0.5603 | 0.1094 | |||
| CCEP / COCA COLA EUROPACIFIC COMPANY GUAR REGS 11/27 1.5 | 0.02 | 13.40 | 1.79 | 20.82 | 0.5596 | -0.0882 | |||
| DD / DuPont de Nemours, Inc. | 0.03 | 32.21 | 1.77 | 21.42 | 0.5536 | -0.0840 | |||
| BRO / Brown & Brown, Inc. | 0.02 | 1.77 | 0.5526 | 0.5526 | |||||
| DRI / Darden Restaurants, Inc. | 0.01 | 61.40 | 1.77 | 69.32 | 0.5512 | 0.0960 | |||
| CNP / CenterPoint Energy, Inc. | 0.05 | 13.92 | 1.75 | 15.48 | 0.5473 | -0.1152 | |||
| FCX / Freeport-McMoRan Inc. | 0.04 | 11.73 | 1.74 | 27.92 | 0.5435 | -0.0506 | |||
| CROX / Crocs, Inc. | 0.02 | 1.73 | 0.5403 | 0.5403 | |||||
| MMM / 3M Company | 0.01 | 1.72 | 0.5369 | 0.5369 | |||||
| EQR / Equity Residential | 0.03 | 32.21 | 1.69 | 24.65 | 0.5272 | -0.0642 | |||
| FE / FirstEnergy Corp. | 0.04 | -22.09 | 1.65 | -22.43 | 0.5150 | -0.4131 | |||
| DOV / Dover Corporation | 0.01 | 32.22 | 1.58 | 37.97 | 0.4922 | -0.0069 | |||
| MCK / McKesson Corporation | 0.00 | -5.29 | 1.57 | 3.15 | 0.4909 | -0.1748 | |||
| MOH / Molina Healthcare, Inc. | 0.01 | 31.53 | 1.57 | 18.97 | 0.4894 | -0.0860 | |||
| VVV / Valvoline Inc. | 0.04 | 122.91 | 1.57 | 142.64 | 0.4884 | 0.2068 | |||
| WH / Wyndham Hotels & Resorts, Inc. | 0.02 | 32.21 | 1.56 | 18.62 | 0.4871 | -0.0871 | |||
| RNR / RenaissanceRe Holdings Ltd. | 0.01 | -3.96 | 1.54 | -2.77 | 0.4819 | -0.2114 | |||
| MSM / MSC Industrial Direct Co., Inc. | 0.02 | 32.21 | 1.54 | 44.75 | 0.4817 | 0.0162 | |||
| EXR / Extra Space Storage Inc. | 0.01 | 9.40 | 1.54 | 8.63 | 0.4792 | -0.1377 | |||
| VICI / VICI Properties Inc. | 0.05 | 0.10 | 1.51 | 0.07 | 0.4716 | -0.1876 | |||
| LSTR / Landstar System, Inc. | 0.01 | 63.51 | 1.51 | 51.35 | 0.4710 | 0.0358 | |||
| CHRD / Chord Energy Corporation | 0.02 | 10.98 | 1.49 | -4.61 | 0.4652 | -0.2171 | |||
| LECO / Lincoln Electric Holdings, Inc. | 0.01 | 1.48 | 0.4610 | 0.4610 | |||||
| FIS / Fidelity National Information Services, Inc. | 0.02 | 32.21 | 1.45 | 44.15 | 0.4534 | 0.0135 | |||
| LW / Lamb Weston Holdings, Inc. | 0.03 | 7.21 | 1.45 | 4.25 | 0.4521 | -0.1541 | |||
| PSX / Phillips 66 | 0.01 | 32.22 | 1.41 | 27.74 | 0.4398 | -0.0417 | |||
| DGX / Quest Diagnostics Incorporated | 0.01 | 32.20 | 1.40 | 40.38 | 0.4374 | 0.0016 | |||
| REZI / Resideo Technologies, Inc. | 0.06 | 32.21 | 1.36 | 64.93 | 0.4256 | 0.0644 | |||
| GNTX / Gentex Corporation | 0.06 | 32.21 | 1.34 | 24.77 | 0.4169 | -0.0503 | |||
| OKE / ONEOK, Inc. | 0.02 | 105.91 | 1.31 | 69.38 | 0.4091 | 0.0714 | |||
| CHDN / Churchill Downs Incorporated | 0.01 | -3.57 | 1.31 | -12.36 | 0.4074 | -0.2424 | |||
| WEX / WEX Inc. | 0.01 | 1.30 | 0.4067 | 0.4067 | |||||
| PR / Permian Resources Corporation | 0.09 | 1.29 | 0.4032 | 0.4032 | |||||
| LKQ / LKQ Corporation | 0.03 | 50.91 | 1.24 | 31.26 | 0.3880 | -0.0253 | |||
| ITT / ITT Inc. | 0.01 | 32.21 | 1.12 | 60.43 | 0.3507 | 0.0452 | |||
| BLDR / Builders FirstSource, Inc. | 0.01 | 104.74 | 1.09 | 91.42 | 0.3411 | 0.0917 | |||
| HOG / Harley-Davidson, Inc. | 0.04 | 32.21 | 0.98 | 23.57 | 0.3044 | -0.0401 | |||
| SAIC / Science Applications International Corporation | 0.01 | -19.58 | 0.94 | -19.38 | 0.2936 | -0.2154 | |||
| MBC / MasterBrand, Inc. | 0.07 | 32.21 | 0.77 | 10.59 | 0.2415 | -0.0637 | |||
| CVCO / Cavco Industries, Inc. | 0.00 | 0.51 | 0.1590 | 0.1590 | |||||
| Pacific Life U.S. Government Fund Direct / STIV (000000000) | 0.46 | 0.46 | 0.1439 | 0.1439 | |||||
| MATX / Matson, Inc. | 0.00 | -100.00 | 0.00 | -100.00 | -0.2997 |