Statistik Asas
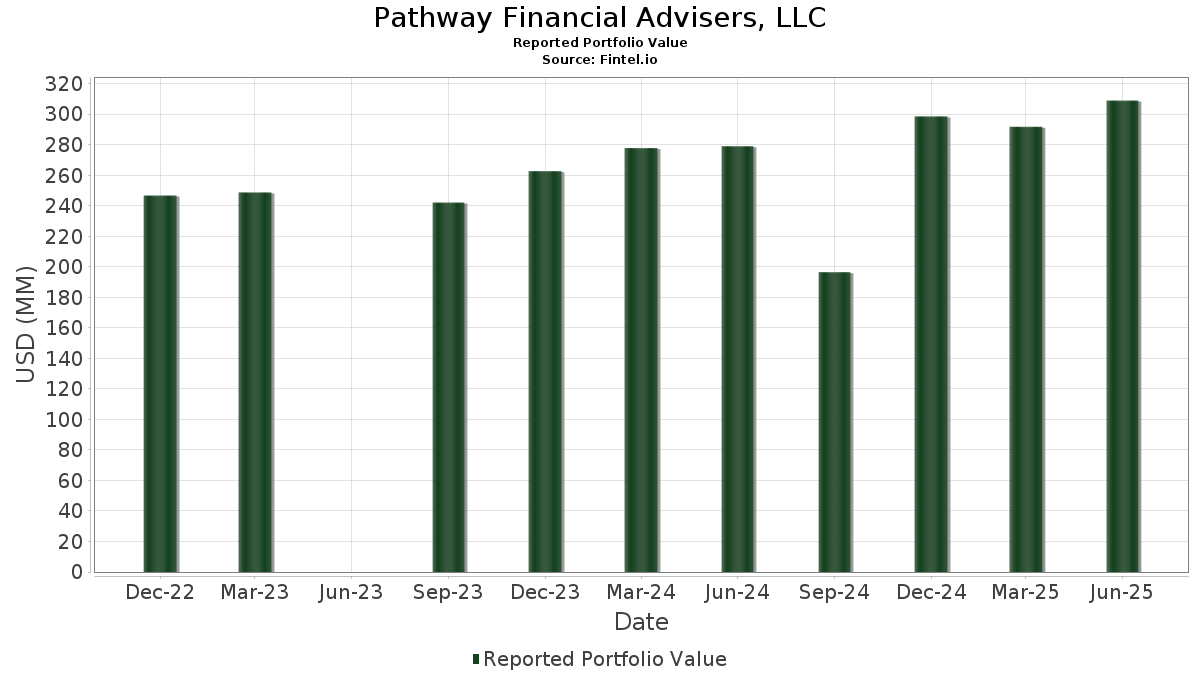
| Nilai Portfolio | $ 308,930,865 |
| Kedudukan Semasa | 163 |
Pegangan Terkini, Prestasi, AUM (dari 13F, 13D)
Pathway Financial Advisers, LLC telah mendedahkan 163 jumlah pegangan dalam pemfailan SEC terkini mereka. Nilai portfolio terkini dikira sebagai $ 308,930,865 USD. Aset Sebenar Di Bawah Pengurusan (AUM) ialah nilai ini ditambah dengan tunai (yang tidak didedahkan). Pegangan teratas Pathway Financial Advisers, LLC ialah Broadcom Inc. (US:AVGO) , JPMorgan Chase & Co. (US:JPM) , Enterprise Products Partners L.P. - Limited Partnership (US:EPD) , Duke Energy Corporation (US:DUK) , and International Business Machines Corporation (US:IBM) . Kedudukan baharu Pathway Financial Advisers, LLC termasuk Super Micro Computer, Inc. (US:SMCI) , .
Kenaikan Teratas Suku Tahun Ini
Kami menggunakan perubahan dalam peruntukan portfolio kerana ini adalah metrik yang paling bermakna. Perubahan boleh disebabkan oleh perdagangan atau perubahan dalam harga saham.
| Sekuriti | Saham (MM) |
Nilai (MM$) |
Portfolio % | ΔPortfolio % |
|---|---|---|---|---|
| 0.04 | 10.87 | 3.5171 | 1.2703 | |
| 0.01 | 5.09 | 1.6467 | 0.3894 | |
| 0.03 | 9.18 | 2.9727 | 0.3299 | |
| 0.02 | 2.44 | 0.7883 | 0.2545 | |
| 0.02 | 6.30 | 2.0379 | 0.2097 | |
| 0.00 | 0.58 | 0.1885 | 0.1885 | |
| 0.00 | 2.88 | 0.9330 | 0.1773 | |
| 0.00 | 0.48 | 0.1561 | 0.1561 | |
| 0.02 | 2.66 | 0.8603 | 0.1423 | |
| 0.01 | 0.39 | 0.1253 | 0.1253 |
Penurunan Teratas Suku Tahun Ini
Kami menggunakan perubahan dalam peruntukan portfolio kerana ini adalah metrik yang paling bermakna. Perubahan boleh disebabkan oleh perdagangan atau perubahan dalam harga saham.
| Sekuriti | Saham (MM) |
Nilai (MM$) |
Portfolio % | ΔPortfolio % |
|---|---|---|---|---|
| 0.01 | 2.25 | 0.7292 | -0.4850 | |
| 0.06 | 4.89 | 1.5816 | -0.4431 | |
| 0.28 | 8.70 | 2.8166 | -0.4005 | |
| 0.03 | 6.03 | 1.9524 | -0.3539 | |
| 0.03 | 4.00 | 1.2949 | -0.2868 | |
| 0.04 | 5.01 | 1.6209 | -0.2681 | |
| 0.06 | 6.71 | 2.1731 | -0.2317 | |
| 0.01 | 4.10 | 1.3277 | -0.2200 | |
| 0.02 | 4.95 | 1.6026 | -0.2077 | |
| 0.02 | 3.87 | 1.2512 | -0.1562 |
13F dan Pemfailan Dana
Borang ini telah difailkan pada 2025-08-21 untuk tempoh pelaporan 2025-06-30. Klik ikon pautan untuk melihat sejarah transaksi penuh.
Tingkatkan untuk membuka data premium dan eksport ke Excel ![]() .
.
| Sekuriti | Jenis | Purata Harga Saham | Saham (MM) |
ΔSaham (%) |
ΔSaham (%) |
Nilai ($MM) |
Portfolio (%) |
ΔPortfolio (%) |
|
|---|---|---|---|---|---|---|---|---|---|
| AVGO / Broadcom Inc. | 0.04 | 0.68 | 10.87 | 65.75 | 3.5171 | 1.2703 | |||
| JPM / JPMorgan Chase & Co. | 0.03 | 0.78 | 9.18 | 19.11 | 2.9727 | 0.3299 | |||
| EPD / Enterprise Products Partners L.P. - Limited Partnership | 0.28 | 2.06 | 8.70 | -7.29 | 2.8166 | -0.4005 | |||
| DUK / Duke Energy Corporation | 0.06 | -1.10 | 6.71 | -4.31 | 2.1731 | -0.2317 | |||
| IBM / International Business Machines Corporation | 0.02 | -0.43 | 6.30 | 18.04 | 2.0379 | 0.2097 | |||
| CSCO / Cisco Systems, Inc. | 0.09 | -0.06 | 6.16 | 12.36 | 1.9955 | 0.1150 | |||
| ABBV / AbbVie Inc. | 0.03 | 1.18 | 6.03 | -10.36 | 1.9524 | -0.3539 | |||
| ETY / Eaton Vance Tax-Managed Diversified Equity Income Fund | 0.39 | 3.55 | 5.97 | 12.34 | 1.9309 | 0.1109 | |||
| STLD / Steel Dynamics, Inc. | 0.05 | 0.69 | 5.78 | 3.03 | 1.8703 | -0.0516 | |||
| O / Realty Income Corporation | 0.09 | 2.68 | 5.44 | 1.97 | 1.7621 | -0.0677 | |||
| ENB / Enbridge Inc. | 0.12 | 2.00 | 5.40 | 4.33 | 1.7478 | -0.0262 | |||
| MSFT / Microsoft Corporation | 0.01 | 4.66 | 5.09 | 38.69 | 1.6467 | 0.3894 | |||
| PEP / PepsiCo, Inc. | 0.04 | 3.17 | 5.01 | -9.15 | 1.6209 | -0.2681 | |||
| AAPL / Apple Inc. | 0.02 | 1.48 | 4.95 | -6.27 | 1.6026 | -0.2077 | |||
| PM / Philip Morris International Inc. | 0.03 | -0.33 | 4.92 | 14.38 | 1.5917 | 0.1180 | |||
| OKE / ONEOK, Inc. | 0.06 | 0.54 | 4.89 | -17.30 | 1.5816 | -0.4431 | |||
| LMT / Lockheed Martin Corporation | 0.01 | 1.37 | 4.88 | 5.10 | 1.5797 | -0.0119 | |||
| SO / The Southern Company | 0.05 | 1.23 | 4.36 | 1.09 | 1.4102 | -0.0667 | |||
| VZ / Verizon Communications Inc. | 0.10 | 1.22 | 4.32 | -3.44 | 1.3991 | -0.1352 | |||
| SCHD / Schwab Strategic Trust - Schwab U.S. Dividend Equity ETF | 0.16 | 4.04 | 4.16 | -1.40 | 1.3468 | -0.0995 | |||
| AMGN / Amgen Inc. | 0.01 | 1.36 | 4.10 | -9.17 | 1.3277 | -0.2200 | |||
| VIG / Vanguard Specialized Funds - Vanguard Dividend Appreciation ETF | 0.02 | 3.87 | 4.03 | 9.59 | 1.3059 | 0.0441 | |||
| CVX / Chevron Corporation | 0.03 | 1.28 | 4.00 | -13.31 | 1.2949 | -0.2868 | |||
| RTX / RTX Corporation | 0.03 | -0.36 | 3.97 | 9.81 | 1.2860 | 0.0462 | |||
| PG / The Procter & Gamble Company | 0.02 | 0.69 | 3.87 | -5.87 | 1.2512 | -0.1562 | |||
| BNS / The Bank of Nova Scotia | 0.07 | -2.62 | 3.86 | 13.46 | 1.2498 | 0.0836 | |||
| WMT / Walmart Inc. | 0.04 | -1.32 | 3.73 | 9.91 | 1.2059 | 0.0441 | |||
| MCD / McDonald's Corporation | 0.01 | 1.32 | 3.54 | -5.23 | 1.1445 | -0.1342 | |||
| MDT / Medtronic plc | 0.04 | -1.38 | 3.45 | -4.33 | 1.1167 | -0.1192 | |||
| OHI / Omega Healthcare Investors, Inc. | 0.09 | 1.96 | 3.36 | -1.87 | 1.0881 | -0.0860 | |||
| VICI / VICI Properties Inc. | 0.10 | 2.80 | 3.32 | 2.75 | 1.0757 | -0.0330 | |||
| WM / Waste Management, Inc. | 0.01 | 1.75 | 3.31 | 0.55 | 1.0707 | -0.0566 | |||
| EVRG / Evergy, Inc. | 0.04 | -0.31 | 3.00 | -0.33 | 0.9696 | -0.0606 | |||
| PDT / John Hancock Premium Dividend Fund | 0.23 | 2.43 | 2.98 | 3.12 | 0.9642 | -0.0258 | |||
| JNJ / Johnson & Johnson | 0.02 | -0.13 | 2.95 | -8.03 | 0.9535 | -0.1441 | |||
| APD / Air Products and Chemicals, Inc. | 0.01 | 0.55 | 2.88 | -3.83 | 0.9337 | -0.0944 | |||
| GS / The Goldman Sachs Group, Inc. | 0.00 | 0.89 | 2.88 | 30.76 | 0.9330 | 0.1773 | |||
| FDVV / Fidelity Covington Trust - Fidelity High Dividend ETF | 0.05 | 5.49 | 2.68 | 10.64 | 0.8683 | 0.0373 | |||
| EMR / Emerson Electric Co. | 0.02 | 4.33 | 2.66 | 26.89 | 0.8603 | 0.1423 | |||
| TD / The Toronto-Dominion Bank | 0.03 | -1.93 | 2.45 | 20.15 | 0.7917 | 0.0941 | |||
| KO / The Coca-Cola Company | 0.03 | 2.14 | 2.45 | 0.91 | 0.7915 | -0.0391 | |||
| NVDA / NVIDIA Corporation | 0.02 | 7.28 | 2.44 | 56.39 | 0.7883 | 0.2545 | |||
| CMI / Cummins Inc. | 0.01 | 1.57 | 2.41 | 6.13 | 0.7798 | 0.0018 | |||
| QCOM / QUALCOMM Incorporated | 0.01 | 4.34 | 2.35 | 8.15 | 0.7606 | 0.0161 | |||
| WPC / W. P. Carey Inc. | 0.04 | 1.81 | 2.34 | 0.60 | 0.7587 | -0.0396 | |||
| WLKP / Westlake Chemical Partners LP - Limited Partnership | 0.11 | 2.43 | 2.34 | -2.01 | 0.7573 | -0.0610 | |||
| UL / Unilever PLC - Depositary Receipt (Common Stock) | 0.04 | 2.00 | 2.31 | 4.76 | 0.7489 | -0.0080 | |||
| UNH / UnitedHealth Group Incorporated | 0.01 | 6.76 | 2.25 | -36.42 | 0.7292 | -0.4850 | |||
| AEP / American Electric Power Company, Inc. | 0.02 | 3.09 | 2.24 | -2.14 | 0.7260 | -0.0593 | |||
| MET / MetLife, Inc. | 0.03 | 2.90 | 2.14 | 3.08 | 0.6938 | -0.0190 | |||
| DLR / Digital Realty Trust, Inc. | 0.01 | 3.68 | 2.13 | 26.14 | 0.6891 | 0.1107 | |||
| HD / The Home Depot, Inc. | 0.01 | 2.94 | 2.08 | 2.97 | 0.6736 | -0.0190 | |||
| MGK / Vanguard World Fund - Vanguard Mega Cap Growth ETF | 0.01 | 5.73 | 2.08 | 25.30 | 0.6720 | 0.1043 | |||
| TFC / Truist Financial Corporation | 0.05 | -0.44 | 2.01 | 4.04 | 0.6506 | -0.0117 | |||
| HYT / BlackRock Corporate High Yield Fund, Inc. | 0.20 | 4.79 | 1.98 | 6.67 | 0.6417 | 0.0046 | |||
| SPY / SPDR S&P 500 ETF | 0.00 | 18.72 | 1.97 | 31.23 | 0.6380 | 0.1229 | |||
| ET / Energy Transfer LP - Limited Partnership | 0.11 | 11.90 | 1.97 | 9.14 | 0.6378 | 0.0189 | |||
| AMZN / Amazon.com, Inc. | 0.01 | 7.95 | 1.92 | 24.48 | 0.6223 | 0.0929 | |||
| MRK / Merck & Co., Inc. | 0.02 | 7.45 | 1.92 | -5.23 | 0.6214 | -0.0730 | |||
| NOC / Northrop Grumman Corporation | 0.00 | 0.63 | 1.91 | -1.75 | 0.6186 | -0.0479 | |||
| WEC / WEC Energy Group, Inc. | 0.02 | -0.29 | 1.89 | -4.68 | 0.6131 | -0.0678 | |||
| UPS / United Parcel Service, Inc. | 0.02 | -0.17 | 1.83 | -8.40 | 0.5929 | -0.0923 | |||
| SLF / Sun Life Financial Inc. | 0.03 | -1.48 | 1.77 | 14.38 | 0.5718 | 0.0422 | |||
| MPLX / MPLX LP - Limited Partnership | 0.03 | 5.24 | 1.75 | 1.27 | 0.5671 | -0.0257 | |||
| NTR / Nutrien Ltd. | 0.03 | -3.67 | 1.70 | 12.91 | 0.5496 | 0.0344 | |||
| BRK.B / Berkshire Hathaway Inc. | 0.00 | 1.01 | 1.70 | -7.87 | 0.5495 | -0.0819 | |||
| V / Visa Inc. | 0.00 | 3.66 | 1.65 | 5.03 | 0.5338 | -0.0044 | |||
| UNP / Union Pacific Corporation | 0.01 | 8.48 | 1.54 | 5.64 | 0.4976 | -0.0012 | |||
| FDIS / Fidelity Covington Trust - Fidelity MSCI Consumer Discretionary Index ETF | 0.02 | 1.26 | 1.54 | 12.77 | 0.4975 | 0.0302 | |||
| KLAC / KLA Corporation | 0.00 | 1.96 | 1.54 | 34.27 | 0.4975 | 0.1052 | |||
| PLD / Prologis, Inc. | 0.01 | 9.51 | 1.53 | 2.96 | 0.4952 | -0.0140 | |||
| GD / General Dynamics Corporation | 0.01 | 0.04 | 1.51 | 7.00 | 0.4899 | 0.0052 | |||
| TXN / Texas Instruments Incorporated | 0.01 | 0.79 | 1.45 | 16.41 | 0.4709 | 0.0427 | |||
| PSX / Phillips 66 | 0.01 | -0.46 | 1.42 | -3.85 | 0.4608 | -0.0465 | |||
| LLY / Eli Lilly and Company | 0.00 | 7.39 | 1.39 | 1.38 | 0.4509 | -0.0202 | |||
| ADC / Agree Realty Corporation | 0.02 | 3.76 | 1.30 | -1.74 | 0.4206 | -0.0329 | |||
| GPC / Genuine Parts Company | 0.01 | 0.44 | 1.28 | 2.33 | 0.4131 | -0.0146 | |||
| GOOGL / Alphabet Inc. | 0.01 | 6.71 | 1.26 | 21.62 | 0.4080 | 0.0528 | |||
| USB / U.S. Bancorp | 0.03 | 8.18 | 1.24 | 15.95 | 0.4002 | 0.0347 | |||
| NOBL / ProShares Trust - ProShares S&P 500 Dividend Aristocrats ETF | 0.01 | 8.28 | 1.23 | 6.67 | 0.3987 | 0.0031 | |||
| GLW / Corning Incorporated | 0.02 | 0.15 | 1.21 | 14.98 | 0.3903 | 0.0311 | |||
| WTRG / Essential Utilities, Inc. | 0.03 | -3.42 | 1.20 | -9.26 | 0.3869 | -0.0646 | |||
| MRVL / Marvell Technology, Inc. | 0.02 | 2.27 | 1.18 | 28.57 | 0.3817 | 0.0673 | |||
| RY / Royal Bank of Canada | 0.01 | 6.10 | 1.17 | 23.86 | 0.3799 | 0.0550 | |||
| PRU / Prudential Financial, Inc. | 0.01 | 8.42 | 1.15 | 4.36 | 0.3717 | -0.0057 | |||
| ALL / The Allstate Corporation | 0.01 | 4.09 | 1.13 | 1.16 | 0.3667 | -0.0170 | |||
| NEE / NextEra Energy, Inc. | 0.02 | 8.46 | 1.13 | 6.21 | 0.3657 | 0.0011 | |||
| BLK / BlackRock, Inc. | 0.00 | -1.02 | 1.12 | 9.72 | 0.3618 | 0.0127 | |||
| LRCX / Lam Research Corporation | 0.01 | 0.85 | 1.11 | 35.08 | 0.3590 | 0.0775 | |||
| HIO / Western Asset High Income Opportunity Fund Inc. | 0.27 | 0.63 | 1.08 | 0.65 | 0.3501 | -0.0183 | |||
| AXP / American Express Company | 0.00 | 12.94 | 1.07 | 33.88 | 0.3470 | 0.0726 | |||
| BIP / Brookfield Infrastructure Partners L.P. - Limited Partnership | 0.03 | 2.85 | 1.07 | 15.68 | 0.3465 | 0.0293 | |||
| IRM / Iron Mountain Incorporated | 0.01 | -2.13 | 1.04 | 16.70 | 0.3371 | 0.0311 | |||
| PEBO / Peoples Bancorp Inc. | 0.03 | 0.72 | 1.01 | 3.70 | 0.3272 | -0.0069 | |||
| PFE / Pfizer Inc. | 0.04 | 4.35 | 1.01 | -0.20 | 0.3265 | -0.0199 | |||
| NSC / Norfolk Southern Corporation | 0.00 | 3.23 | 1.01 | 11.54 | 0.3256 | 0.0166 | |||
| ARE / Alexandria Real Estate Equities, Inc. | 0.01 | 2.39 | 0.98 | -19.59 | 0.3163 | -0.1004 | |||
| DE / Deere & Company | 0.00 | -1.82 | 0.96 | 6.42 | 0.3114 | 0.0014 | |||
| AMT / American Tower Corporation | 0.00 | -0.31 | 0.94 | 1.30 | 0.3034 | -0.0139 | |||
| DVY / iShares Trust - iShares Select Dividend ETF | 0.01 | 10.90 | 0.93 | 9.69 | 0.3006 | 0.0104 | |||
| SOFI / SoFi Technologies, Inc. | 0.05 | 1.15 | 0.86 | 58.27 | 0.2789 | 0.0924 | |||
| CEG / Constellation Energy Corporation | 0.00 | 20.51 | 0.85 | 92.97 | 0.2756 | 0.1243 | |||
| XYL / Xylem Inc. | 0.01 | 12.03 | 0.83 | 21.32 | 0.2671 | 0.0340 | |||
| GOOG / Alphabet Inc. | 0.00 | 11.52 | 0.78 | 26.55 | 0.2518 | 0.0412 | |||
| SBUX / Starbucks Corporation | 0.01 | -1.91 | 0.75 | -8.39 | 0.2439 | -0.0379 | |||
| FHLC / Fidelity Covington Trust - Fidelity MSCI Health Care Index ETF | 0.01 | -1.95 | 0.75 | -8.18 | 0.2435 | -0.0374 | |||
| XOM / Exxon Mobil Corporation | 0.01 | 12.65 | 0.73 | 2.09 | 0.2377 | -0.0088 | |||
| MAA / Mid-America Apartment Communities, Inc. | 0.00 | 7.28 | 0.72 | -5.27 | 0.2330 | -0.0274 | |||
| CVS / CVS Health Corporation | 0.01 | 2.22 | 0.71 | 4.13 | 0.2286 | -0.0040 | |||
| RSG / Republic Services, Inc. | 0.00 | -1.56 | 0.70 | 0.29 | 0.2260 | -0.0128 | |||
| ACN / Accenture plc | 0.00 | 16.31 | 0.67 | 11.42 | 0.2179 | 0.0108 | |||
| BAC / Bank of America Corporation | 0.01 | 0.28 | 0.67 | 13.78 | 0.2166 | 0.0149 | |||
| NOW / ServiceNow, Inc. | 0.00 | 4.04 | 0.66 | 34.55 | 0.2144 | 0.0455 | |||
| NNN / NNN REIT, Inc. | 0.02 | 1.84 | 0.66 | 3.14 | 0.2124 | -0.0057 | |||
| VOO / Vanguard Index Funds - Vanguard S&P 500 ETF | 0.00 | 6.40 | 0.65 | 17.51 | 0.2109 | 0.0210 | |||
| TMO / Thermo Fisher Scientific Inc. | 0.00 | 7.73 | 0.60 | -12.34 | 0.1958 | -0.0404 | |||
| WFC.PRL / Wells Fargo & Company - Preferred Stock | 0.00 | 1.58 | 0.60 | -0.66 | 0.1954 | -0.0129 | |||
| DLY / DoubleLine Yield Opportunities Fund | 0.04 | -0.91 | 0.58 | -4.12 | 0.1887 | -0.0195 | |||
| QQQ / Invesco QQQ Trust, Series 1 | 0.00 | 0.58 | 0.1885 | 0.1885 | |||||
| LKFN / Lakeland Financial Corporation | 0.01 | 0.00 | 0.58 | 3.41 | 0.1865 | -0.0045 | |||
| NUV / Nuveen Municipal Value Fund, Inc. | 0.06 | -0.89 | 0.54 | -1.64 | 0.1745 | -0.0136 | |||
| NI / NiSource Inc. | 0.01 | 0.29 | 0.52 | 0.97 | 0.1682 | -0.0083 | |||
| DOC / Healthpeak Properties, Inc. | 0.03 | 12.18 | 0.50 | -2.92 | 0.1615 | -0.0145 | |||
| CI / The Cigna Group | 0.00 | 2.32 | 0.50 | 2.90 | 0.1606 | -0.0048 | |||
| SOXX / iShares Trust - iShares Semiconductor ETF | 0.00 | 4.21 | 0.49 | 32.43 | 0.1586 | 0.0315 | |||
| REGL / ProShares Trust - ProShares S&P Midcap 400 Dividend Aristocrats ETF | 0.01 | 1.03 | 0.49 | 2.10 | 0.1578 | -0.0058 | |||
| TDIV / First Trust Exchange-Traded Fund VI - First Trust NASDAQ Technology Dividend Index Fund | 0.01 | -1.34 | 0.48 | 21.05 | 0.1564 | 0.0194 | |||
| SFY / Tidal Trust I - SoFi Select 500 ETF | 0.00 | 0.48 | 0.1561 | 0.1561 | |||||
| PFXF / VanEck ETF Trust - VanEck Preferred Securities ex Financials ETF | 0.03 | -5.78 | 0.48 | -3.63 | 0.1548 | -0.0155 | |||
| QTUM / ETF Series Solutions - Defiance Quantum ETF | 0.01 | 9.12 | 0.47 | 34.39 | 0.1507 | 0.0320 | |||
| BMY / Bristol-Myers Squibb Company | 0.01 | -0.93 | 0.44 | -24.83 | 0.1413 | -0.0577 | |||
| XLK / The Select Sector SPDR Trust - The Technology Select Sector SPDR Fund | 0.00 | -1.70 | 0.40 | 20.80 | 0.1280 | 0.0156 | |||
| SMCI / Super Micro Computer, Inc. | 0.01 | 0.39 | 0.1253 | 0.1253 | |||||
| KVUE / Kenvue Inc. | 0.02 | 2.05 | 0.38 | -10.93 | 0.1241 | -0.0234 | |||
| EQIX / Equinix, Inc. | 0.00 | 3.17 | 0.36 | 0.84 | 0.1173 | -0.0060 | |||
| GIS / General Mills, Inc. | 0.01 | -0.46 | 0.35 | -13.58 | 0.1133 | -0.0258 | |||
| CSX / CSX Corporation | 0.01 | -1.04 | 0.33 | 9.57 | 0.1077 | 0.0038 | |||
| YUM / Yum! Brands, Inc. | 0.00 | 0.00 | 0.32 | -5.56 | 0.1046 | -0.0130 | |||
| FIDU / Fidelity Covington Trust - Fidelity MSCI Industrials Index ETF | 0.00 | 6.20 | 0.30 | 20.33 | 0.0959 | 0.0115 | |||
| GLD / SPDR Gold Trust | 0.00 | -12.42 | 0.29 | -7.30 | 0.0947 | -0.0135 | |||
| AWR / American States Water Company | 0.00 | 0.59 | 0.29 | -2.03 | 0.0938 | -0.0075 | |||
| FLC / Flaherty & Crumrine Total Return Fund Inc. | 0.02 | -1.00 | 0.29 | 0.35 | 0.0924 | -0.0051 | |||
| LOW / Lowe's Companies, Inc. | 0.00 | 0.40 | 0.28 | -4.76 | 0.0909 | -0.0099 | |||
| TSLA / Tesla, Inc. | 0.00 | 0.28 | 0.0898 | 0.0898 | |||||
| COST / Costco Wholesale Corporation | 0.00 | 5.73 | 0.27 | 10.93 | 0.0887 | 0.0039 | |||
| MA / Mastercard Incorporated | 0.00 | 0.00 | 0.27 | 2.66 | 0.0875 | -0.0028 | |||
| ELV / Elevance Health, Inc. | 0.00 | 0.00 | 0.26 | -10.54 | 0.0853 | -0.0157 | |||
| FUTY / Fidelity Covington Trust - Fidelity MSCI Utilities Index ETF | 0.00 | 3.79 | 0.26 | 7.08 | 0.0834 | 0.0010 | |||
| EXR / Extra Space Storage Inc. | 0.00 | -3.08 | 0.25 | -3.85 | 0.0811 | -0.0081 | |||
| FSTA / Fidelity Covington Trust - Fidelity MSCI Consumer Staples Index ETF | 0.00 | 4.68 | 0.25 | 5.08 | 0.0803 | -0.0009 | |||
| FREL / Fidelity Covington Trust - Fidelity MSCI Real Estate Index ETF | 0.01 | -2.51 | 0.24 | -3.98 | 0.0781 | -0.0081 | |||
| BX / Blackstone Inc. | 0.00 | 0.64 | 0.24 | 7.80 | 0.0763 | 0.0013 | |||
| NAD / Nuveen Quality Municipal Income Fund | 0.02 | 0.13 | 0.24 | -2.08 | 0.0762 | -0.0060 | |||
| FRME / First Merchants Corporation | 0.01 | 1.01 | 0.22 | -4.31 | 0.0720 | -0.0077 | |||
| FTEC / Fidelity Covington Trust - Fidelity MSCI Information Technology Index ETF | 0.00 | 0.22 | 0.0706 | 0.0706 | |||||
| BIPC / Brookfield Infrastructure Corporation | 0.01 | 0.21 | 0.0692 | 0.0692 | |||||
| ABT / Abbott Laboratories | 0.00 | 0.21 | 0.0675 | 0.0675 | |||||
| LYB / LyondellBasell Industries N.V. | 0.00 | 15.61 | 0.20 | -5.12 | 0.0663 | -0.0076 | |||
| MYI / BlackRock MuniYield Quality Fund III, Inc. | 0.02 | -2.09 | 0.19 | -6.28 | 0.0628 | -0.0084 | |||
| RGTI / Rigetti Computing, Inc. | 0.02 | -16.20 | 0.18 | 25.52 | 0.0590 | 0.0092 | |||
| OIA / Invesco Municipal Income Opportunities Trust | 0.02 | 0.94 | 0.10 | -4.00 | 0.0313 | -0.0031 | |||
| JPC / Nuveen Preferred & Income Opportunities Fund | 0.01 | 0.98 | 0.10 | 1.06 | 0.0311 | -0.0013 | |||
| VRA / Vera Bradley, Inc. | 0.03 | 0.00 | 0.07 | -1.49 | 0.0214 | -0.0017 | |||
| TJX / The TJX Companies, Inc. | 0.00 | -100.00 | 0.00 | 0.0000 | |||||
| XIFR / XPLR Infrastructure, LP - Limited Partnership | 0.00 | -100.00 | 0.00 | 0.0000 |