Statistik Asas
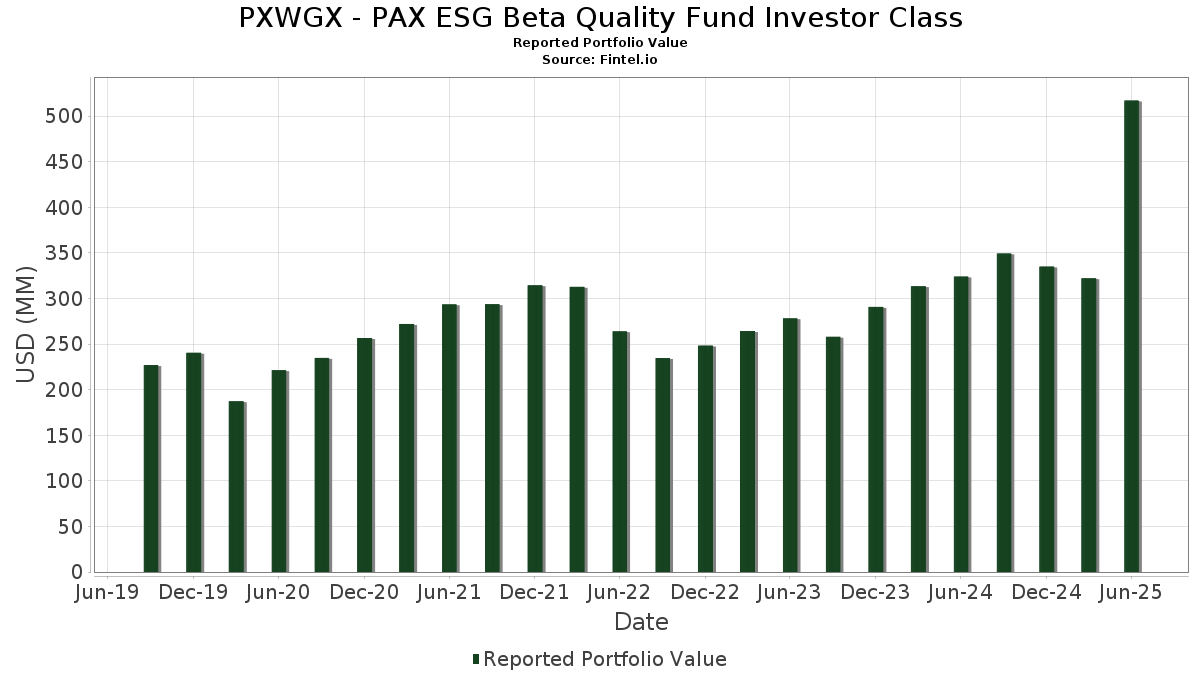
| Nilai Portfolio | $ 517,056,503 |
| Kedudukan Semasa | 131 |
Pegangan Terkini, Prestasi, AUM (dari 13F, 13D)
PXWGX - PAX ESG Beta Quality Fund Investor Class telah mendedahkan 131 jumlah pegangan dalam pemfailan SEC terkini mereka. Nilai portfolio terkini dikira sebagai $ 517,056,503 USD. Aset Sebenar Di Bawah Pengurusan (AUM) ialah nilai ini ditambah dengan tunai (yang tidak didedahkan). Pegangan teratas PXWGX - PAX ESG Beta Quality Fund Investor Class ialah NVIDIA Corporation (US:NVDA) , Microsoft Corporation (US:MSFT) , Apple Inc. (US:AAPL) , Broadcom Inc. (US:AVGO) , and Amazon.com, Inc. (US:AMZN) . Kedudukan baharu PXWGX - PAX ESG Beta Quality Fund Investor Class termasuk The Hanover Insurance Group, Inc. (US:THG) , Xylem Inc. (US:XYL) , Lincoln Electric Holdings, Inc. (US:LECO) , Howmet Aerospace Inc. (US:HWM) , and Principal Financial Group, Inc. (US:PFG) .
Kenaikan Teratas Suku Tahun Ini
Kami menggunakan perubahan dalam peruntukan portfolio kerana ini adalah metrik yang paling bermakna. Perubahan boleh disebabkan oleh perdagangan atau perubahan dalam harga saham.
| Sekuriti | Saham (MM) |
Nilai (MM$) |
Portfolio % | ΔPortfolio % |
|---|---|---|---|---|
| 0.07 | 16.19 | 3.1299 | 3.1299 | |
| 0.26 | 41.05 | 7.9349 | 2.4621 | |
| 0.05 | 10.55 | 2.0385 | 2.0385 | |
| 0.07 | 19.27 | 3.7260 | 1.9269 | |
| 0.03 | 8.82 | 1.7044 | 1.5037 | |
| 0.33 | 7.29 | 1.4095 | 1.2114 | |
| 0.06 | 8.92 | 1.7252 | 1.1797 | |
| 0.01 | 7.84 | 1.5147 | 1.1597 | |
| 0.07 | 33.60 | 6.4952 | 0.9866 | |
| 0.02 | 5.10 | 0.9864 | 0.7060 |
Penurunan Teratas Suku Tahun Ini
Kami menggunakan perubahan dalam peruntukan portfolio kerana ini adalah metrik yang paling bermakna. Perubahan boleh disebabkan oleh perdagangan atau perubahan dalam harga saham.
| Sekuriti | Saham (MM) |
Nilai (MM$) |
Portfolio % | ΔPortfolio % |
|---|---|---|---|---|
| 0.12 | 25.10 | 4.8520 | -1.8049 | |
| 0.00 | 1.04 | 0.2003 | -1.6014 | |
| 0.03 | 1.36 | 0.2628 | -1.0086 | |
| 0.00 | 1.05 | 0.2037 | -0.7934 | |
| 0.00 | 0.92 | 0.1785 | -0.7575 | |
| 0.01 | 4.29 | 0.8299 | -0.6602 | |
| 0.01 | 1.41 | 0.2732 | -0.6342 | |
| 0.01 | 4.97 | 0.9607 | -0.5485 | |
| 0.05 | 8.12 | 1.5698 | -0.5388 | |
| 0.04 | 4.74 | 0.9154 | -0.5181 |
13F dan Pemfailan Dana
Borang ini telah difailkan pada 2025-08-26 untuk tempoh pelaporan 2025-06-30. Klik ikon pautan untuk melihat sejarah transaksi penuh.
Tingkatkan untuk membuka data premium dan eksport ke Excel ![]() .
.
| Sekuriti | Jenis | Purata Harga Saham | Saham (MM) |
ΔSaham (%) |
ΔSaham (%) |
Nilai ($MM) |
Portfolio (%) |
ΔPortfolio (%) |
|
|---|---|---|---|---|---|---|---|---|---|
| NVDA / NVIDIA Corporation | 0.26 | 59.71 | 41.05 | 132.81 | 7.9349 | 2.4621 | |||
| MSFT / Microsoft Corporation | 0.07 | 42.88 | 33.60 | 89.33 | 6.4952 | 0.9866 | |||
| AAPL / Apple Inc. | 0.12 | 26.71 | 25.10 | 17.04 | 4.8520 | -1.8049 | |||
| AVGO / Broadcom Inc. | 0.07 | 101.99 | 19.27 | 232.54 | 3.7260 | 1.9269 | |||
| AMZN / Amazon.com, Inc. | 0.07 | 16.19 | 3.1299 | 3.1299 | |||||
| V / Visa Inc. | 0.04 | 49.22 | 12.89 | 51.18 | 2.4909 | -0.1548 | |||
| MA / Mastercard Incorporated | 0.02 | 77.33 | 12.10 | 81.81 | 2.3396 | 0.2732 | |||
| LLY / Eli Lilly and Company | 0.02 | 94.18 | 11.90 | 83.28 | 2.3013 | 0.2851 | |||
| ORCL / Oracle Corporation | 0.05 | 10.55 | 2.0385 | 2.0385 | |||||
| QCOM / QUALCOMM Incorporated | 0.06 | 389.77 | 8.92 | 407.91 | 1.7252 | 1.1797 | |||
| MCD / McDonald's Corporation | 0.03 | 1,357.83 | 8.82 | 1,264.71 | 1.7044 | 1.5037 | |||
| MRK / Merck & Co., Inc. | 0.11 | 164.36 | 8.76 | 133.18 | 1.6940 | 0.5273 | |||
| UNP / Union Pacific Corporation | 0.04 | 53.29 | 8.63 | 49.30 | 1.6680 | -0.1260 | |||
| GILD / Gilead Sciences, Inc. | 0.08 | 47.74 | 8.42 | 46.19 | 1.6270 | -0.1602 | |||
| PGR / The Progressive Corporation | 0.03 | 46.74 | 8.34 | 38.36 | 1.6128 | -0.2589 | |||
| GOOGL / Alphabet Inc. | 0.05 | 4.90 | 8.12 | 19.53 | 1.5698 | -0.5388 | |||
| SPGI / S&P Global Inc. | 0.01 | 560.15 | 7.84 | 585.48 | 1.5147 | 1.1597 | |||
| ZTS / Zoetis Inc. | 0.05 | 74.43 | 7.64 | 65.22 | 1.4760 | 0.0415 | |||
| RSG / Republic Services, Inc. | 0.03 | 130.01 | 7.52 | 134.24 | 1.4536 | 0.4572 | |||
| INTC / Intel Corporation | 0.33 | 1,058.66 | 7.29 | 1,044.58 | 1.4095 | 1.2114 | |||
| JNJ / Johnson & Johnson | 0.05 | 19.65 | 6.88 | 25.04 | 1.3303 | -0.3679 | |||
| AWK / American Water Works Company, Inc. | 0.05 | 38.45 | 6.77 | 30.54 | 1.3089 | -0.3009 | |||
| TT / Trane Technologies plc | 0.01 | 9.63 | 5.75 | 42.32 | 1.1119 | -0.1425 | |||
| DIS / The Walt Disney Company | 0.04 | 10.72 | 5.29 | 39.12 | 1.0223 | -0.1577 | |||
| GOOG / Alphabet Inc. | 0.03 | 39.61 | 5.22 | 58.51 | 1.0088 | -0.0131 | |||
| EMR / Emerson Electric Co. | 0.04 | 0.00 | 5.21 | 21.61 | 1.0063 | -0.3224 | |||
| MET / MetLife, Inc. | 0.06 | 8.25 | 5.21 | 8.44 | 1.0062 | -0.4839 | |||
| JPM / JPMorgan Chase & Co. | 0.02 | 378.03 | 5.10 | 465.01 | 0.9864 | 0.7060 | |||
| IBM / International Business Machines Corporation | 0.02 | 38.15 | 5.07 | 63.74 | 0.9805 | 0.0191 | |||
| AMGN / Amgen Inc. | 0.02 | 139.80 | 5.07 | 114.92 | 0.9802 | 0.2478 | |||
| LII / Lennox International Inc. | 0.01 | 0.00 | 4.97 | 2.20 | 0.9607 | -0.5485 | |||
| C / Citigroup Inc. | 0.06 | 10.58 | 4.97 | 32.59 | 0.9605 | -0.2026 | |||
| ADBE / Adobe Inc. | 0.01 | 458.18 | 4.90 | 463.29 | 0.9464 | 0.6765 | |||
| BK / The Bank of New York Mellon Corporation | 0.05 | 24.77 | 4.83 | 35.54 | 0.9342 | -0.1725 | |||
| ADI / Analog Devices, Inc. | 0.02 | 5.74 | 4.80 | 24.82 | 0.9276 | -0.2658 | |||
| IDXX / IDEXX Laboratories, Inc. | 0.01 | 0.00 | 4.75 | 27.74 | 0.9179 | -0.2361 | |||
| HIG / The Hartford Insurance Group, Inc. | 0.04 | 0.00 | 4.74 | 2.53 | 0.9154 | -0.5181 | |||
| AMAT / Applied Materials, Inc. | 0.02 | 9.88 | 4.50 | 38.61 | 0.8696 | -0.1377 | |||
| HD / The Home Depot, Inc. | 0.01 | 129.63 | 4.40 | 129.70 | 0.8508 | 0.2561 | |||
| ELV / Elevance Health, Inc. | 0.01 | 0.00 | 4.29 | -10.58 | 0.8299 | -0.6602 | |||
| APD / Air Products and Chemicals, Inc. | 0.02 | 35.22 | 4.24 | 29.33 | 0.8191 | -0.1979 | |||
| NOW / ServiceNow, Inc. | 0.00 | 0.00 | 4.14 | 29.13 | 0.8003 | -0.1948 | |||
| PLD / Prologis, Inc. | 0.04 | 11.76 | 3.94 | 5.09 | 0.7621 | -0.4024 | |||
| ADSK / Autodesk, Inc. | 0.01 | 0.00 | 3.91 | 18.25 | 0.7568 | -0.2709 | |||
| MTD / Mettler-Toledo International Inc. | 0.00 | 14.33 | 3.90 | 13.71 | 0.7537 | -0.3104 | |||
| LPLA / LPL Financial Holdings Inc. | 0.01 | 338.48 | 3.78 | 489.08 | 0.7301 | 0.5321 | |||
| JPMorgan Prime Money Market Fund / STIV (N/A) | 3.48 | 3.48 | 0.6718 | 0.6718 | |||||
| EIX / Edison International | 0.06 | 13.73 | 3.27 | -0.40 | 0.6315 | -0.3866 | |||
| CARR / Carrier Global Corporation | 0.04 | 0.00 | 2.93 | 15.42 | 0.5657 | -0.2212 | |||
| ECL / Ecolab Inc. | 0.01 | 23.74 | 2.70 | 31.51 | 0.5212 | -0.1152 | |||
| GIS / General Mills, Inc. | 0.05 | 20.79 | 2.61 | 4.69 | 0.5053 | -0.2699 | |||
| VTR / Ventas, Inc. | 0.04 | 20.71 | 2.50 | 10.90 | 0.4839 | -0.2170 | |||
| ROK / Rockwell Automation, Inc. | 0.01 | 34.43 | 2.21 | 72.88 | 0.4265 | 0.0302 | |||
| STT / State Street Corporation | 0.02 | 2.05 | 0.3958 | 0.3958 | |||||
| OTIS / Otis Worldwide Corporation | 0.02 | 35.38 | 1.99 | 29.88 | 0.3850 | -0.0909 | |||
| EW / Edwards Lifesciences Corporation | 0.02 | 28.26 | 1.81 | 38.43 | 0.3504 | -0.0561 | |||
| WAT / Waters Corporation | 0.01 | 118.17 | 1.78 | 106.72 | 0.3451 | 0.0769 | |||
| ITW / Illinois Tool Works Inc. | 0.01 | 118.66 | 1.77 | 118.25 | 0.3422 | 0.0901 | |||
| ACN / Accenture plc | 0.01 | 0.00 | 1.77 | -4.18 | 0.3414 | -0.2309 | |||
| AMD / Advanced Micro Devices, Inc. | 0.01 | 59.11 | 1.73 | 119.80 | 0.3348 | 0.0902 | |||
| THG / The Hanover Insurance Group, Inc. | 0.01 | 1.71 | 0.3308 | 0.3308 | |||||
| VLTO / Veralto Corporation | 0.02 | 151.15 | 1.68 | 160.40 | 0.3243 | 0.1241 | |||
| VRSK / Verisk Analytics, Inc. | 0.01 | 43.48 | 1.65 | 50.23 | 0.3181 | -0.0220 | |||
| AYI / Acuity Inc. | 0.01 | 49.92 | 1.64 | 69.89 | 0.3163 | 0.0173 | |||
| FITB / Fifth Third Bancorp | 0.04 | 47.98 | 1.56 | 55.27 | 0.3021 | -0.0103 | |||
| XYL / Xylem Inc. | 0.01 | 1.53 | 0.2955 | 0.2955 | |||||
| M / Macy's, Inc. | 0.13 | 51.90 | 1.52 | 40.98 | 0.2947 | -0.0409 | |||
| AMT / American Tower Corporation | 0.01 | 50.97 | 1.50 | 53.32 | 0.2903 | -0.0137 | |||
| CMCSA / Comcast Corporation | 0.04 | -2.11 | 1.50 | -16.35 | 0.2899 | -0.2329 | |||
| HPE / Hewlett Packard Enterprise Company | 0.07 | 56.38 | 1.48 | 107.30 | 0.2854 | 0.0643 | |||
| FDS / FactSet Research Systems Inc. | 0.00 | 1.47 | 0.2839 | 0.2839 | |||||
| VZ / Verizon Communications Inc. | 0.03 | 118.47 | 1.43 | 110.46 | 0.2764 | 0.0783 | |||
| LOW / Lowe's Companies, Inc. | 0.01 | -21.71 | 1.43 | -35.89 | 0.2760 | -0.3733 | |||
| INTU / Intuit Inc. | 0.00 | 0.00 | 1.42 | 28.29 | 0.2754 | -0.0693 | |||
| PG / The Procter & Gamble Company | 0.01 | -49.89 | 1.41 | -50.80 | 0.2732 | -0.6342 | |||
| TYIA / Johnson Controls International plc | 0.01 | 70.06 | 1.41 | 124.32 | 0.2728 | 0.0774 | |||
| PNR / Pentair plc | 0.01 | 57.15 | 1.37 | 84.50 | 0.2648 | 0.0343 | |||
| BMY / Bristol-Myers Squibb Company | 0.03 | -65.14 | 1.36 | -68.83 | 0.2628 | -1.0086 | |||
| CNC / Centene Corporation | 0.02 | 56.93 | 1.34 | 40.27 | 0.2594 | -0.0375 | |||
| ALL / The Allstate Corporation | 0.01 | 55.72 | 1.31 | 51.38 | 0.2542 | -0.0154 | |||
| SBAC / SBA Communications Corporation | 0.01 | 58.17 | 1.29 | 68.76 | 0.2497 | 0.0122 | |||
| CLX / The Clorox Company | 0.01 | 197.00 | 1.29 | 172.25 | 0.2484 | 0.0660 | |||
| AXTA / Axalta Coating Systems Ltd. | 0.04 | 1.27 | 0.2449 | 0.2449 | |||||
| LEA / Lear Corporation | 0.01 | 62.79 | 1.26 | 75.38 | 0.2439 | 0.0204 | |||
| BWA / BorgWarner Inc. | 0.04 | 67.05 | 1.26 | 95.35 | 0.2437 | 0.0433 | |||
| LRCX / Lam Research Corporation | 0.01 | 602.08 | 1.25 | -16.25 | 0.2411 | -0.1932 | |||
| GWW / W.W. Grainger, Inc. | 0.00 | 57.65 | 1.24 | 66.18 | 0.2403 | 0.0079 | |||
| WY / Weyerhaeuser Company | 0.05 | 59.57 | 1.20 | 40.05 | 0.2326 | -0.0342 | |||
| COR / Cencora, Inc. | 0.00 | 68.33 | 1.20 | 81.42 | 0.2323 | 0.0268 | |||
| MCO / Moody's Corporation | 0.00 | 72.84 | 1.19 | 86.12 | 0.2308 | 0.0317 | |||
| RYN / Rayonier Inc. | 0.05 | 51.35 | 1.19 | 20.47 | 0.2299 | -0.0767 | |||
| CBRE / CBRE Group, Inc. | 0.01 | 69.68 | 1.17 | 81.86 | 0.2269 | 0.0265 | |||
| TFC / Truist Financial Corporation | 0.03 | 0.00 | 1.14 | 4.48 | 0.2210 | -0.1187 | |||
| GEHC / GE HealthCare Technologies Inc. | 0.02 | 76.49 | 1.14 | 62.13 | 0.2210 | 0.0019 | |||
| CMI / Cummins Inc. | 0.00 | 74.81 | 1.14 | 82.85 | 0.2206 | 0.0267 | |||
| LECO / Lincoln Electric Holdings, Inc. | 0.01 | 1.14 | 0.2205 | 0.2205 | |||||
| CSCO / Cisco Systems, Inc. | 0.02 | 1.12 | 0.2161 | 0.2161 | |||||
| HWM / Howmet Aerospace Inc. | 0.01 | 1.09 | 0.2104 | 0.2104 | |||||
| AXP / American Express Company | 0.00 | 1.08 | 0.2093 | 0.2093 | |||||
| PNC / The PNC Financial Services Group, Inc. | 0.01 | 0.00 | 1.07 | 6.13 | 0.2077 | -0.1067 | |||
| PFG / Principal Financial Group, Inc. | 0.01 | 1.07 | 0.2065 | 0.2065 | |||||
| RF / Regions Financial Corporation | 0.05 | 8.84 | 1.06 | 32.08 | 0.2047 | -0.0718 | |||
| CMA / Comerica Incorporated | 0.02 | 1.06 | 0.2040 | 0.2040 | |||||
| NTAP / NetApp, Inc. | 0.01 | 1.05 | 0.2038 | 0.2038 | |||||
| ACM / AECOM | 0.01 | 1.05 | 0.2037 | 0.2037 | |||||
| CASY / Casey's General Stores, Inc. | 0.00 | -72.10 | 1.05 | -67.22 | 0.2037 | -0.7934 | |||
| MSI / Motorola Solutions, Inc. | 0.00 | 1.04 | 0.2011 | 0.2011 | |||||
| TXN / Texas Instruments Incorporated | 0.00 | -84.55 | 1.04 | -82.15 | 0.2003 | -1.6014 | |||
| GTM / ZoomInfo Technologies Inc. | 0.10 | 53.42 | 1.04 | 55.17 | 0.2002 | -0.0068 | |||
| ITT / ITT Inc. | 0.01 | 1.03 | 0.2000 | 0.2000 | |||||
| T / AT&T Inc. | 0.04 | 48,820.55 | 1.03 | 103,200.00 | 0.1998 | 0.1992 | |||
| CDNS / Cadence Design Systems, Inc. | 0.00 | -53.89 | 1.03 | -39.34 | 0.1985 | -0.4554 | |||
| DECK / Deckers Outdoor Corporation | 0.01 | 62.40 | 1.03 | 49.64 | 0.1983 | -0.0144 | |||
| TKR / The Timken Company | 0.01 | 1.03 | 0.1982 | 0.1982 | |||||
| KLAC / KLA Corporation | 0.00 | 1.02 | 0.1965 | 0.1965 | |||||
| BALL / Ball Corporation | 0.02 | 1.02 | 0.1965 | 0.1965 | |||||
| PANW / Palo Alto Networks, Inc. | 0.00 | 65.10 | 1.01 | 18.90 | 0.1959 | -0.0733 | |||
| USFD / US Foods Holding Corp. | 0.01 | -7.28 | 1.01 | 70.66 | 0.1957 | -0.0513 | |||
| LIN / Linde plc | 0.00 | 1.01 | 0.1956 | 0.1956 | |||||
| CLH / Clean Harbors, Inc. | 0.00 | 1.01 | 0.1954 | 0.1954 | |||||
| BR / Broadridge Financial Solutions, Inc. | 0.00 | 1.01 | 0.1950 | 0.1950 | |||||
| CZR / Caesars Entertainment, Inc. | 0.04 | 1.00 | 0.1939 | 0.1939 | |||||
| KSS / Kohl's Corporation | 0.12 | 1.00 | 0.1929 | 0.1929 | |||||
| Aptiv plc / EC (JE00BTDN8H13) | 0.01 | 5.17 | 1.00 | 20.56 | 0.1929 | -0.0640 | |||
| BBY / Best Buy Co., Inc. | 0.01 | 0.00 | 1.00 | -8.78 | 0.1928 | -0.1466 | |||
| ABBV / AbbVie Inc. | 0.01 | 40.32 | 0.99 | 51.92 | 0.1913 | -0.0098 | |||
| BJ / BJ's Wholesale Club Holdings, Inc. | 0.01 | 0.99 | 0.1905 | 0.1905 | |||||
| HST / Host Hotels & Resorts, Inc. | 0.06 | 311.89 | 0.96 | 304.62 | 0.1862 | 0.0958 | |||
| CPB / The Campbell's Company | 0.03 | 0.95 | 0.1845 | 0.1845 | |||||
| EQIX / Equinix, Inc. | 0.00 | -67.66 | 0.92 | -68.84 | 0.1785 | -0.7575 | |||
| CF / CF Industries Holdings, Inc. | 0.01 | -41.16 | 0.91 | -36.85 | 0.1759 | -0.3698 |