Statistik Asas
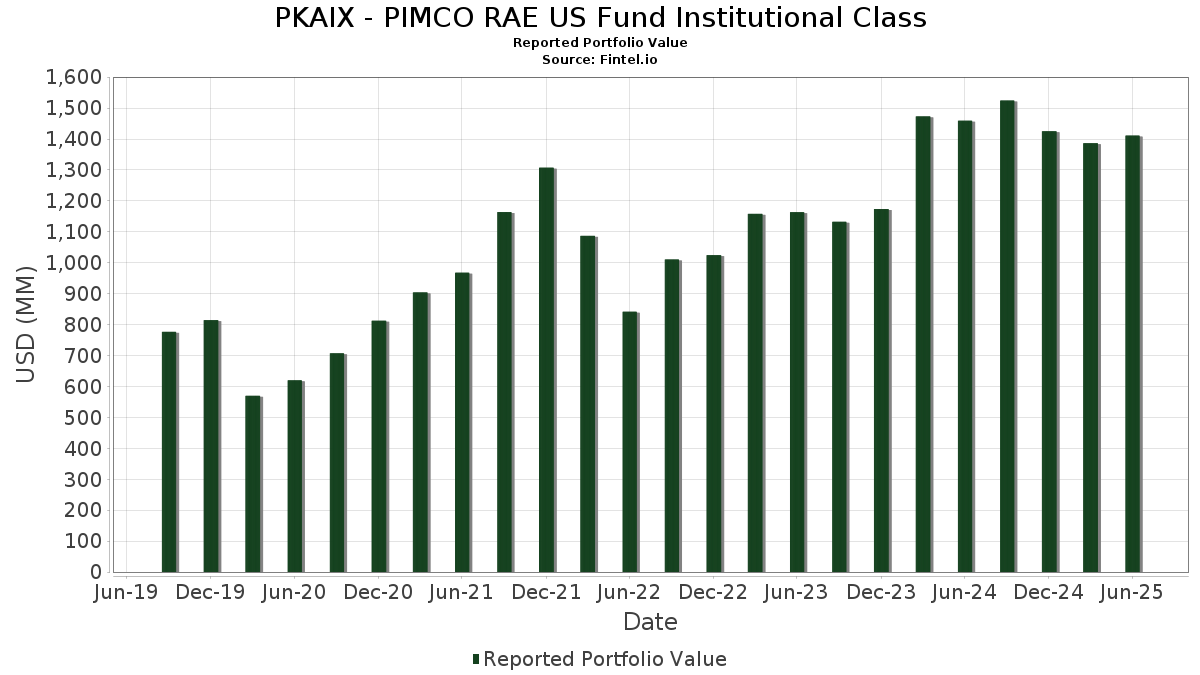
| Nilai Portfolio | $ 1,411,001,542 |
| Kedudukan Semasa | 142 |
Pegangan Terkini, Prestasi, AUM (dari 13F, 13D)
PKAIX - PIMCO RAE US Fund Institutional Class telah mendedahkan 142 jumlah pegangan dalam pemfailan SEC terkini mereka. Nilai portfolio terkini dikira sebagai $ 1,411,001,542 USD. Aset Sebenar Di Bawah Pengurusan (AUM) ialah nilai ini ditambah dengan tunai (yang tidak didedahkan). Pegangan teratas PKAIX - PIMCO RAE US Fund Institutional Class ialah Cisco Systems, Inc. (US:CSCO) , Gilead Sciences, Inc. (US:GILD) , Marathon Petroleum Corporation (US:MPC) , Apple Inc. (US:AAPL) , and Walmart Inc. (US:WMT) . Kedudukan baharu PKAIX - PIMCO RAE US Fund Institutional Class termasuk PIMCO GOVERNMENT MONEY MARKET FUND (US:US72202E5345) , Warner Bros. Discovery, Inc. (US:WBD) , PIMCO PRV SHORT TERM FLT III MUTUAL FUND (US:US72201W1541) , Olin Corporation (US:OLN) , and .
Kenaikan Teratas Suku Tahun Ini
Kami menggunakan perubahan dalam peruntukan portfolio kerana ini adalah metrik yang paling bermakna. Perubahan boleh disebabkan oleh perdagangan atau perubahan dalam harga saham.
| Sekuriti | Saham (MM) |
Nilai (MM$) |
Portfolio % | ΔPortfolio % |
|---|---|---|---|---|
| 0.16 | 24.63 | 1.7737 | 1.2184 | |
| 0.20 | 15.05 | 1.0839 | 0.9381 | |
| 0.05 | 22.34 | 1.6091 | 0.8790 | |
| 0.33 | 54.61 | 3.9327 | 0.8615 | |
| 0.11 | 43.31 | 3.1192 | 0.8280 | |
| 0.54 | 59.81 | 4.3071 | 0.7226 | |
| 0.71 | 8.19 | 0.5898 | 0.5898 | |
| 24.27 | 1.7480 | 0.5738 | ||
| 1.00 | 69.07 | 4.9745 | 0.5244 | |
| 0.03 | 5.74 | 0.4132 | 0.4132 |
Penurunan Teratas Suku Tahun Ini
Kami menggunakan perubahan dalam peruntukan portfolio kerana ini adalah metrik yang paling bermakna. Perubahan boleh disebabkan oleh perdagangan atau perubahan dalam harga saham.
| Sekuriti | Saham (MM) |
Nilai (MM$) |
Portfolio % | ΔPortfolio % |
|---|---|---|---|---|
| 1.13 | 27.37 | 1.9714 | -1.9128 | |
| 0.05 | 7.29 | 0.5249 | -1.6251 | |
| 0.03 | 6.09 | 0.4382 | -1.2510 | |
| 0.22 | 33.08 | 2.3821 | -0.6559 | |
| 0.13 | 15.07 | 1.0851 | -0.5733 | |
| 0.27 | 54.37 | 3.9158 | -0.5065 | |
| 0.02 | 6.43 | 0.4633 | -0.4934 | |
| 0.00 | 0.95 | 0.0684 | -0.4746 | |
| 0.07 | 3.45 | 0.2485 | -0.4403 | |
| 0.17 | 14.38 | 1.0358 | -0.4157 |
13F dan Pemfailan Dana
Borang ini telah difailkan pada 2025-08-29 untuk tempoh pelaporan 2025-06-30. Klik ikon pautan untuk melihat sejarah transaksi penuh.
Tingkatkan untuk membuka data premium dan eksport ke Excel ![]() .
.
| Sekuriti | Jenis | Purata Harga Saham | Saham (MM) |
ΔSaham (%) |
ΔSaham (%) |
Nilai ($MM) |
Portfolio (%) |
ΔPortfolio (%) |
|
|---|---|---|---|---|---|---|---|---|---|
| CSCO / Cisco Systems, Inc. | 1.00 | 0.61 | 69.07 | 13.11 | 4.9745 | 0.5244 | |||
| GILD / Gilead Sciences, Inc. | 0.54 | 22.88 | 59.81 | 21.59 | 4.3071 | 0.7226 | |||
| MPC / Marathon Petroleum Corporation | 0.33 | 13.65 | 54.61 | 29.58 | 3.9327 | 0.8615 | |||
| AAPL / Apple Inc. | 0.27 | -2.99 | 54.37 | -10.40 | 3.9158 | -0.5065 | |||
| WMT / Walmart Inc. | 0.54 | -3.01 | 52.43 | 8.03 | 3.7760 | 0.2390 | |||
| CHTR / Charter Communications, Inc. | 0.11 | 24.18 | 43.31 | 37.76 | 3.1192 | 0.8280 | |||
| VLO / Valero Energy Corporation | 0.30 | -3.03 | 40.54 | -1.30 | 2.9199 | -0.0738 | |||
| SYF / Synchrony Financial | 0.52 | -15.15 | 34.70 | 6.97 | 2.4991 | 0.1350 | |||
| MMM / 3M Company | 0.22 | -23.46 | 33.08 | -20.66 | 2.3821 | -0.6559 | |||
| MO / Altria Group, Inc. | 0.56 | -3.01 | 32.63 | -5.26 | 2.3501 | -0.1600 | |||
| KR / The Kroger Co. | 0.44 | -11.61 | 31.71 | -6.33 | 2.2838 | -0.1834 | |||
| BMY / Bristol-Myers Squibb Company | 0.63 | 59.76 | 28.94 | 21.25 | 2.0842 | 0.3449 | |||
| PFE / Pfizer Inc. | 1.13 | -46.31 | 27.37 | -48.64 | 1.9714 | -1.9128 | |||
| JNJ / Johnson & Johnson | 0.16 | 211.47 | 24.63 | 200.78 | 1.7737 | 1.2184 | |||
| US72202E5345 / PIMCO GOVERNMENT MONEY MARKET FUND | 24.27 | 50.64 | 1.7480 | 0.5738 | |||||
| EBAY / eBay Inc. | 0.31 | -3.03 | 22.92 | 6.60 | 1.6504 | 0.0838 | |||
| LMT / Lockheed Martin Corporation | 0.05 | 115.11 | 22.34 | 123.03 | 1.6091 | 0.8790 | |||
| STX / Seagate Technology Holdings plc | 0.14 | -32.42 | 19.91 | 14.82 | 1.4336 | 0.1702 | |||
| HPQ / HP Inc. | 0.80 | 14.27 | 19.57 | 0.94 | 1.4097 | -0.0035 | |||
| HPE / Hewlett Packard Enterprise Company | 0.95 | -3.50 | 19.34 | 27.89 | 1.3929 | 0.2908 | |||
| HUM / Humana Inc. | 0.08 | -2.91 | 18.78 | -10.29 | 1.3525 | -0.1732 | |||
| BBY / Best Buy Co., Inc. | 0.28 | 11.59 | 18.54 | 1.77 | 1.3354 | 0.0076 | |||
| CAH / Cardinal Health, Inc. | 0.11 | -28.84 | 18.44 | -13.22 | 1.3277 | -0.2205 | |||
| TGT / Target Corporation | 0.19 | -3.02 | 18.32 | -8.33 | 1.3196 | -0.1370 | |||
| CTSH / Cognizant Technology Solutions Corporation | 0.22 | 38.77 | 16.79 | 41.54 | 1.2089 | 0.3446 | |||
| DG / Dollar General Corporation | 0.14 | -3.55 | 15.84 | 25.46 | 1.1408 | 0.2207 | |||
| PSX / Phillips 66 | 0.13 | -31.47 | 15.07 | -33.79 | 1.0851 | -0.5733 | |||
| PYPL / PayPal Holdings, Inc. | 0.20 | 560.56 | 15.05 | 652.50 | 1.0839 | 0.9381 | |||
| AIG / American International Group, Inc. | 0.17 | -26.65 | 14.38 | -27.79 | 1.0358 | -0.4157 | |||
| WBA / Walgreens Boots Alliance, Inc. | 1.17 | 30.18 | 13.45 | 33.80 | 0.9684 | 0.2360 | |||
| FOXA / Fox Corporation | 0.21 | 64.26 | 11.77 | 62.63 | 0.8476 | 0.3202 | |||
| INTC / Intel Corporation | 0.52 | -3.50 | 11.72 | -4.82 | 0.8439 | -0.0533 | |||
| ALLY / Ally Financial Inc. | 0.28 | -3.49 | 11.03 | 3.06 | 0.7945 | 0.0145 | |||
| TROW / T. Rowe Price Group, Inc. | 0.11 | 39.51 | 10.80 | 46.55 | 0.7780 | 0.2408 | |||
| NTAP / NetApp, Inc. | 0.09 | -33.72 | 9.98 | -19.61 | 0.7185 | -0.1858 | |||
| DVA / DaVita Inc. | 0.07 | -18.75 | 9.83 | -24.34 | 0.7078 | -0.2388 | |||
| WDC / Western Digital Corporation | 0.15 | -47.11 | 9.75 | -16.28 | 0.7020 | -0.1465 | |||
| EVRG / Evergy, Inc. | 0.14 | -3.04 | 9.68 | -3.07 | 0.6973 | -0.0306 | |||
| QRVO / Qorvo, Inc. | 0.11 | 32.38 | 9.60 | 55.23 | 0.6915 | 0.2407 | |||
| CSX / CSX Corporation | 0.29 | -3.02 | 9.52 | 7.52 | 0.6857 | 0.0404 | |||
| UHS / Universal Health Services, Inc. | 0.05 | 10.83 | 9.49 | 6.84 | 0.6838 | 0.0362 | |||
| BIIB / Biogen Inc. | 0.08 | -29.01 | 9.46 | -34.84 | 0.6810 | -0.3766 | |||
| CHRW / C.H. Robinson Worldwide, Inc. | 0.10 | 12.67 | 9.33 | 5.58 | 0.6722 | 0.0279 | |||
| TPR / Tapestry, Inc. | 0.10 | 38.31 | 9.15 | 72.52 | 0.6589 | 0.2724 | |||
| EXPD / Expeditors International of Washington, Inc. | 0.08 | 39.21 | 8.83 | 32.26 | 0.6360 | 0.1494 | |||
| ARW / Arrow Electronics, Inc. | 0.07 | 13.39 | 8.82 | 39.17 | 0.6349 | 0.1732 | |||
| LUMN / Lumen Technologies, Inc. | 2.00 | 6.42 | 8.78 | 18.90 | 0.6324 | 0.0943 | |||
| PARA / Paramount Global | 0.67 | -1.66 | 8.63 | 6.08 | 0.6212 | 0.0286 | |||
| JNPR / Juniper Networks, Inc. | 0.21 | -20.81 | 8.42 | -12.62 | 0.6066 | -0.0959 | |||
| WBD / Warner Bros. Discovery, Inc. | 0.71 | 8.19 | 0.5898 | 0.5898 | |||||
| WY / Weyerhaeuser Company | 0.31 | 22.50 | 8.03 | 7.48 | 0.5782 | 0.0338 | |||
| KSS / Kohl's Corporation | 0.92 | 21.30 | 7.79 | 25.75 | 0.5609 | 0.1096 | |||
| M / Macy's, Inc. | 0.66 | -2.67 | 7.73 | -9.65 | 0.5564 | -0.0667 | |||
| LH / Labcorp Holdings Inc. | 0.03 | 97.88 | 7.43 | 123.22 | 0.5352 | 0.2926 | |||
| CBRE / CBRE Group, Inc. | 0.05 | -2.07 | 7.34 | 4.92 | 0.5283 | 0.0188 | |||
| QCOM / QUALCOMM Incorporated | 0.05 | -76.17 | 7.29 | -75.30 | 0.5249 | -1.6251 | |||
| CI / The Cigna Group | 0.02 | -3.21 | 6.98 | -2.74 | 0.5029 | -0.0203 | |||
| EA / Electronic Arts Inc. | 0.04 | -2.10 | 6.70 | 8.17 | 0.4824 | 0.0312 | |||
| JLL / Jones Lang LaSalle Incorporated | 0.03 | -3.37 | 6.60 | -0.30 | 0.4753 | -0.0071 | |||
| CNC / Centene Corporation | 0.12 | -3.09 | 6.47 | -13.36 | 0.4658 | -0.0782 | |||
| TRV / The Travelers Companies, Inc. | 0.02 | -51.56 | 6.43 | -50.99 | 0.4633 | -0.4934 | |||
| MOS / The Mosaic Company | 0.17 | 121.30 | 6.32 | 198.91 | 0.4553 | 0.3012 | |||
| CAR / Avis Budget Group, Inc. | 0.04 | 255.82 | 6.28 | 693.18 | 0.4524 | 0.3947 | |||
| SWKS / Skyworks Solutions, Inc. | 0.08 | 214.68 | 6.13 | 262.84 | 0.4417 | 0.3185 | |||
| AMAT / Applied Materials, Inc. | 0.03 | -79.19 | 6.09 | -73.75 | 0.4382 | -1.2510 | |||
| KD / Kyndryl Holdings, Inc. | 0.14 | -4.16 | 5.99 | 28.06 | 0.4312 | 0.0905 | |||
| ADM / Archer-Daniels-Midland Company | 0.11 | 140.49 | 5.81 | 164.44 | 0.4182 | 0.2582 | |||
| LYB / LyondellBasell Industries N.V. | 0.10 | -1.03 | 5.79 | -18.66 | 0.4170 | -0.1017 | |||
| AVT / Avnet, Inc. | 0.11 | -3.03 | 5.78 | 7.04 | 0.4163 | 0.0227 | |||
| TER / Teradyne, Inc. | 0.06 | -3.02 | 5.78 | 5.57 | 0.4162 | 0.0173 | |||
| GOOGL / Alphabet Inc. | 0.03 | 5.74 | 0.4132 | 0.4132 | |||||
| LRCX / Lam Research Corporation | 0.06 | -2.98 | 5.71 | 29.89 | 0.4110 | 0.0908 | |||
| AN / AutoNation, Inc. | 0.03 | -4.12 | 5.55 | 17.63 | 0.3994 | 0.0558 | |||
| PPL / PPL Corporation | 0.16 | -2.64 | 5.31 | -8.64 | 0.3822 | -0.0411 | |||
| TSN / Tyson Foods, Inc. | 0.09 | -31.57 | 5.29 | -40.01 | 0.3811 | -0.2617 | |||
| WHR / Whirlpool Corporation | 0.05 | 63.87 | 5.08 | 84.43 | 0.3659 | 0.1651 | |||
| LOW / Lowe's Companies, Inc. | 0.02 | -2.23 | 4.86 | -7.00 | 0.3500 | -0.0308 | |||
| UGI / UGI Corporation | 0.13 | -2.39 | 4.77 | 7.51 | 0.3432 | 0.0202 | |||
| NSC / Norfolk Southern Corporation | 0.02 | -55.70 | 4.71 | -52.12 | 0.3389 | -0.3774 | |||
| DGX / Quest Diagnostics Incorporated | 0.03 | -2.62 | 4.67 | 3.38 | 0.3366 | 0.0071 | |||
| HST / Host Hotels & Resorts, Inc. | 0.30 | 103.04 | 4.61 | 119.49 | 0.3318 | 0.1788 | |||
| CMCSA / Comcast Corporation | 0.13 | -2.65 | 4.59 | -5.85 | 0.3303 | -0.0247 | |||
| AAP / Advance Auto Parts, Inc. | 0.10 | -27.69 | 4.55 | -14.26 | 0.3274 | -0.0590 | |||
| STLD / Steel Dynamics, Inc. | 0.04 | -1.68 | 4.50 | 0.63 | 0.3239 | -0.0018 | |||
| RS / Reliance, Inc. | 0.01 | -2.76 | 4.43 | 5.73 | 0.3191 | 0.0137 | |||
| MAN / ManpowerGroup Inc. | 0.11 | 13.96 | 4.37 | -20.46 | 0.3147 | -0.0856 | |||
| ORCL / Oracle Corporation | 0.02 | -5.26 | 4.33 | 48.19 | 0.3121 | 0.0989 | |||
| LDOS / Leidos Holdings, Inc. | 0.03 | -1.16 | 4.02 | 15.54 | 0.2893 | 0.0360 | |||
| DOX / Amdocs Limited | 0.04 | 28.56 | 3.95 | 28.21 | 0.2848 | 0.0600 | |||
| WEC / WEC Energy Group, Inc. | 0.04 | 15.54 | 3.88 | 10.50 | 0.2796 | 0.0235 | |||
| IVZ / Invesco Ltd. | 0.24 | -2.18 | 3.72 | 1.67 | 0.2681 | 0.0013 | |||
| CF / CF Industries Holdings, Inc. | 0.04 | 3.59 | 0.2587 | 0.2587 | |||||
| OMF / OneMain Holdings, Inc. | 0.06 | 52.37 | 3.56 | 77.72 | 0.2562 | 0.1103 | |||
| IP / International Paper Company | 0.07 | -58.42 | 3.45 | -63.50 | 0.2485 | -0.4403 | |||
| MGM / MGM Resorts International | 0.10 | 1,238.47 | 3.37 | 1,496.21 | 0.2426 | 0.2173 | |||
| NVR / NVR, Inc. | 0.00 | -50.78 | 3.28 | -49.82 | 0.2362 | -0.2400 | |||
| BEN / Franklin Resources, Inc. | 0.14 | -3.50 | 3.26 | 19.58 | 0.2344 | 0.0360 | |||
| AFG / American Financial Group, Inc. | 0.03 | 35.64 | 3.25 | 30.39 | 0.2342 | 0.0524 | |||
| AFL / Aflac Incorporated | 0.03 | -5.42 | 3.19 | -10.31 | 0.2294 | -0.0294 | |||
| CVX / Chevron Corporation | 0.02 | 3.15 | 0.2265 | 0.2265 | |||||
| PVH / PVH Corp. | 0.04 | 109.81 | 3.08 | 122.74 | 0.2216 | 0.1209 | |||
| UNM / Unum Group | 0.04 | 0.00 | 3.04 | -0.85 | 0.2189 | -0.0045 | |||
| CLF / Cleveland-Cliffs Inc. | 0.39 | 583.83 | 2.94 | 532.26 | 0.2118 | 0.1779 | |||
| RHI / Robert Half Inc. | 0.07 | 55.06 | 2.93 | 16.66 | 0.2114 | 0.0281 | |||
| US72201W1541 / PIMCO PRV SHORT TERM FLT III MUTUAL FUND | 2.86 | -53.99 | 0.2061 | -0.2473 | |||||
| DD / DuPont de Nemours, Inc. | 0.04 | 7.12 | 2.75 | -1.61 | 0.1983 | -0.0056 | |||
| ED / Consolidated Edison, Inc. | 0.03 | 0.00 | 2.73 | -9.25 | 0.1965 | -0.0226 | |||
| ZION / Zions Bancorporation, National Association | 0.05 | 0.00 | 2.71 | 4.19 | 0.1953 | 0.0056 | |||
| CRBG / Corebridge Financial, Inc. | 0.08 | -40.22 | 2.70 | -32.79 | 0.1943 | -0.0982 | |||
| OGN / Organon & Co. | 0.28 | -2.46 | 2.69 | -36.60 | 0.1936 | -0.1153 | |||
| FL / Foot Locker, Inc. | 0.11 | -4.57 | 2.66 | 65.86 | 0.1917 | 0.0747 | |||
| FAF / First American Financial Corporation | 0.04 | 25.05 | 2.59 | 16.96 | 0.1863 | 0.0251 | |||
| EMN / Eastman Chemical Company | 0.03 | -2.00 | 2.55 | -16.97 | 0.1840 | -0.0402 | |||
| DKS / DICK'S Sporting Goods, Inc. | 0.01 | -1.60 | 2.43 | -3.46 | 0.1751 | -0.0084 | |||
| COF / Capital One Financial Corporation | 0.01 | -4.86 | 2.42 | 12.93 | 0.1743 | 0.0181 | |||
| HTZ / Hertz Global Holdings, Inc. | 0.34 | -9.49 | 2.31 | 56.87 | 0.1661 | 0.0590 | |||
| RL / Ralph Lauren Corporation | 0.01 | -2.36 | 2.27 | 21.34 | 0.1634 | 0.0271 | |||
| DXC / DXC Technology Company | 0.15 | 18.01 | 2.26 | 5.80 | 0.1629 | 0.0071 | |||
| T / AT&T Inc. | 0.08 | -74.06 | 2.24 | -55.28 | 0.1612 | -0.2648 | |||
| ORI / Old Republic International Corporation | 0.05 | 14.70 | 2.01 | 12.42 | 0.1447 | 0.0145 | |||
| SO / The Southern Company | 0.02 | -6.57 | 2.00 | -6.70 | 0.1444 | -0.0122 | |||
| XRX / Xerox Holdings Corporation | 0.37 | 20.79 | 1.93 | 31.83 | 0.1393 | 0.0323 | |||
| CMA / Comerica Incorporated | 0.03 | -52.18 | 1.91 | -51.71 | 0.1376 | -0.1507 | |||
| VZ / Verizon Communications Inc. | 0.04 | 1.87 | 0.1344 | 0.1344 | |||||
| VFC / V.F. Corporation | 0.15 | 22.02 | 1.79 | 6.23 | 0.1289 | 0.0135 | |||
| NRG / NRG Energy, Inc. | 0.01 | -84.73 | 1.46 | -74.32 | 0.1050 | -0.3088 | |||
| MAS / Masco Corporation | 0.02 | -4.26 | 1.45 | -11.40 | 0.1041 | -0.0148 | |||
| HUN / Huntsman Corporation | 0.13 | 0.00 | 1.39 | -34.00 | 0.0998 | -0.0533 | |||
| SOLV / Solventum Corporation | 0.02 | -27.97 | 1.35 | 3.29 | 0.0973 | 0.0077 | |||
| LBTYK / Liberty Global Ltd. | 0.12 | 12.99 | 1.26 | -2.71 | 0.0904 | -0.0036 | |||
| FDX / FedEx Corporation | 0.00 | -84.19 | 0.95 | -88.03 | 0.0684 | -0.4746 | |||
| HD / The Home Depot, Inc. | 0.00 | 0.94 | 0.0678 | 0.0678 | |||||
| CVS / CVS Health Corporation | 0.01 | 0.87 | 0.0626 | 0.0626 | |||||
| HON / Honeywell International Inc. | 0.00 | -5.35 | 0.82 | 4.17 | 0.0594 | 0.0017 | |||
| NWL / Newell Brands Inc. | 0.15 | 0.82 | 0.0588 | 0.0588 | |||||
| ABT / Abbott Laboratories | 0.01 | 0.77 | 0.0553 | 0.0553 | |||||
| WKC / World Kinect Corporation | 0.02 | 64.69 | 0.69 | 64.68 | 0.0497 | 0.0192 | |||
| ABBV / AbbVie Inc. | 0.00 | -86.92 | 0.66 | -82.08 | 0.0473 | -0.2378 | |||
| OLN / Olin Corporation | 0.03 | 0.56 | 0.0405 | 0.0405 | |||||
| PFG / Principal Financial Group, Inc. | 0.01 | -82.94 | 0.50 | -83.97 | 0.0363 | -0.1924 | |||
| JEF / Jefferies Financial Group Inc. | 0.00 | -87.45 | 0.25 | -87.21 | 0.0180 | -0.1245 | |||
| ATUS / Altice USA, Inc. | 0.06 | 0.12 | 0.0090 | 0.0090 |