Statistik Asas
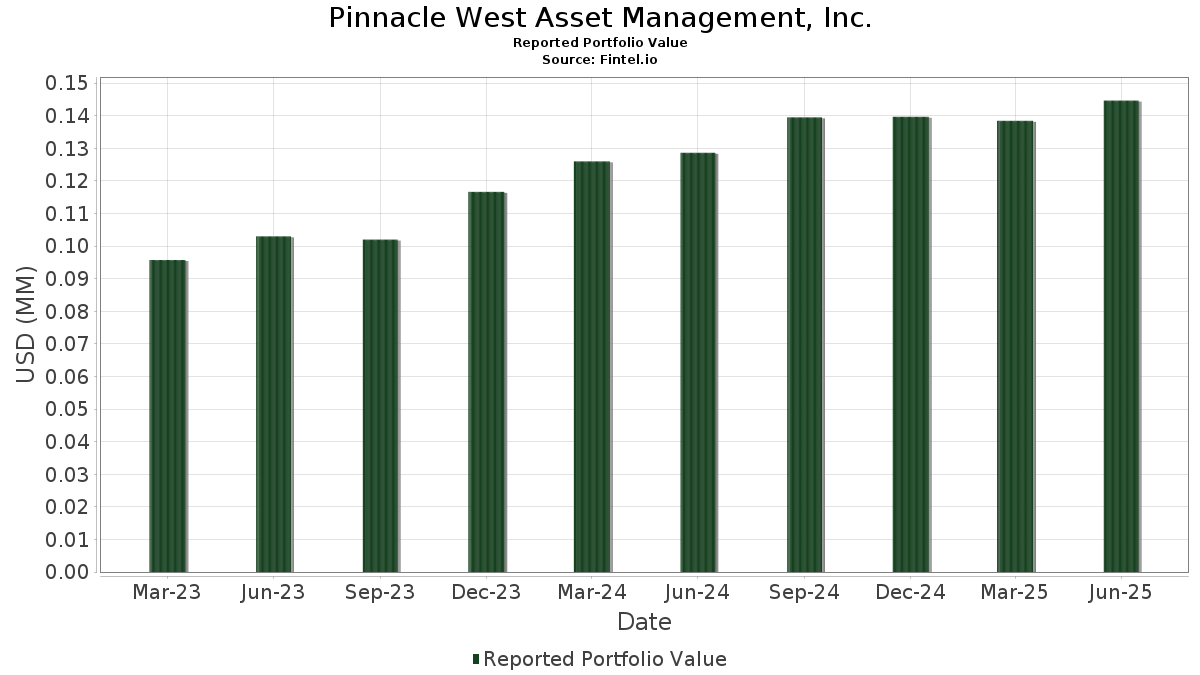
| Nilai Portfolio | $ 144,654 |
| Kedudukan Semasa | 113 |
Pegangan Terkini, Prestasi, AUM (dari 13F, 13D)
Pinnacle West Asset Management, Inc. telah mendedahkan 113 jumlah pegangan dalam pemfailan SEC terkini mereka. Nilai portfolio terkini dikira sebagai $ 144,654 USD. Aset Sebenar Di Bawah Pengurusan (AUM) ialah nilai ini ditambah dengan tunai (yang tidak didedahkan). Pegangan teratas Pinnacle West Asset Management, Inc. ialah Microsoft Corporation (US:MSFT) , Apple Inc. (US:AAPL) , NVIDIA Corporation (US:NVDA) , Amazon.com, Inc. (US:AMZN) , and JPMorgan Chase & Co. (US:JPM) . Kedudukan baharu Pinnacle West Asset Management, Inc. termasuk Bank of America Corporation (US:BAC) , .
Kenaikan Teratas Suku Tahun Ini
Kami menggunakan perubahan dalam peruntukan portfolio kerana ini adalah metrik yang paling bermakna. Perubahan boleh disebabkan oleh perdagangan atau perubahan dalam harga saham.
| Sekuriti | Saham (MM) |
Nilai (MM$) |
Portfolio % | ΔPortfolio % |
|---|---|---|---|---|
| 0.02 | 0.01 | 8.3848 | 1.7463 | |
| 0.03 | 0.00 | 3.1724 | 0.9030 | |
| 0.01 | 0.00 | 1.6412 | 0.5368 | |
| 0.01 | 0.00 | 2.8855 | 0.5085 | |
| 0.00 | 0.00 | 1.9813 | 0.3793 | |
| 0.01 | 0.00 | 2.9242 | 0.2799 | |
| 0.02 | 0.00 | 2.9367 | 0.2599 | |
| 0.01 | 0.00 | 0.6056 | 0.2531 | |
| 0.01 | 0.00 | 1.2312 | 0.2034 | |
| 0.01 | 0.00 | 0.1708 | 0.1708 |
Penurunan Teratas Suku Tahun Ini
Kami menggunakan perubahan dalam peruntukan portfolio kerana ini adalah metrik yang paling bermakna. Perubahan boleh disebabkan oleh perdagangan atau perubahan dalam harga saham.
| Sekuriti | Saham (MM) |
Nilai (MM$) |
Portfolio % | ΔPortfolio % |
|---|---|---|---|---|
| 0.01 | 0.00 | 1.5547 | -1.1365 | |
| 0.04 | 0.01 | 5.4247 | -0.7573 | |
| 0.02 | 0.00 | 1.5160 | -0.3446 | |
| 0.01 | 0.00 | 1.8541 | -0.3330 | |
| 0.02 | 0.00 | 1.2326 | -0.3326 | |
| 0.00 | 0.00 | 2.3753 | -0.2682 | |
| 0.01 | 0.00 | 1.5789 | -0.2427 | |
| 0.02 | 0.00 | 1.4967 | -0.2404 | |
| 0.06 | 0.00 | 1.2851 | -0.2013 | |
| 0.01 | 0.00 | 0.4376 | -0.1670 |
13F dan Pemfailan Dana
Borang ini telah difailkan pada 2025-07-24 untuk tempoh pelaporan 2025-06-30. Klik ikon pautan untuk melihat sejarah transaksi penuh.
Tingkatkan untuk membuka data premium dan eksport ke Excel ![]() .
.
| Sekuriti | Jenis | Purata Harga Saham | Saham (MM) |
ΔSaham (%) |
ΔSaham (%) |
Nilai ($MM) |
Portfolio (%) |
ΔPortfolio (%) |
|
|---|---|---|---|---|---|---|---|---|---|
| MSFT / Microsoft Corporation | 0.02 | -0.41 | 0.01 | 33.33 | 8.3848 | 1.7463 | |||
| AAPL / Apple Inc. | 0.04 | -0.74 | 0.01 | -12.50 | 5.4247 | -0.7573 | |||
| NVDA / NVIDIA Corporation | 0.03 | 0.17 | 0.00 | 33.33 | 3.1724 | 0.9030 | |||
| AMZN / Amazon.com, Inc. | 0.02 | -0.59 | 0.00 | 33.33 | 2.9367 | 0.2599 | |||
| JPM / JPMorgan Chase & Co. | 0.01 | -2.24 | 0.00 | 33.33 | 2.9242 | 0.2799 | |||
| META / Meta Platforms, Inc. | 0.01 | -0.96 | 0.00 | 33.33 | 2.8855 | 0.5085 | |||
| LLY / Eli Lilly and Company | 0.00 | -0.52 | 0.00 | 0.00 | 2.3753 | -0.2682 | |||
| WMB / The Williams Companies, Inc. | 0.05 | -0.18 | 0.00 | 0.00 | 2.3684 | 0.0094 | |||
| HD / The Home Depot, Inc. | 0.01 | -0.56 | 0.00 | 0.00 | 2.2523 | -0.1132 | |||
| WMT / Walmart Inc. | 0.03 | -1.25 | 0.00 | 50.00 | 2.1596 | 0.1084 | |||
| GS / The Goldman Sachs Group, Inc. | 0.00 | -0.25 | 0.00 | 0.00 | 1.9813 | 0.3793 | |||
| 0JR2 / Kinder Morgan, Inc. | 0.10 | -0.20 | 0.00 | 0.00 | 1.9557 | -0.0313 | |||
| C.WSA / Citigroup, Inc. | 0.00 | -1.06 | 0.00 | 0.00 | 1.8997 | 0.0904 | |||
| AMGN / Amgen Inc. | 0.01 | -1.18 | 0.00 | -33.33 | 1.8541 | -0.3330 | |||
| ORCL / Oracle Corporation | 0.01 | -0.69 | 0.00 | 100.00 | 1.6412 | 0.5368 | |||
| GOOGL / Alphabet Inc. | 0.01 | -1.37 | 0.00 | 0.00 | 1.5817 | 0.1111 | |||
| JNJ / Johnson & Johnson | 0.01 | -1.68 | 0.00 | 0.00 | 1.5789 | -0.2427 | |||
| UNH / UnitedHealth Group Incorporated | 0.01 | 1.34 | 0.00 | -33.33 | 1.5547 | -1.1365 | |||
| CVX / Chevron Corporation | 0.02 | -0.55 | 0.00 | 0.00 | 1.5160 | -0.3446 | |||
| XOM / Exxon Mobil Corporation | 0.02 | -0.69 | 0.00 | 0.00 | 1.4967 | -0.2404 | |||
| BX / Blackstone Inc. | 0.01 | -0.32 | 0.00 | 100.00 | 1.4490 | 0.0297 | |||
| DE / Deere & Company | 0.00 | -1.37 | 0.00 | 100.00 | 1.3951 | 0.0314 | |||
| COST / Costco Wholesale Corporation | 0.00 | 0.00 | 0.00 | 0.00 | 1.3688 | 0.0022 | |||
| MCD / McDonald's Corporation | 0.01 | -0.68 | 0.00 | -50.00 | 1.3349 | -0.1667 | |||
| CSCO / Cisco Systems, Inc. | 0.03 | -0.18 | 0.00 | 0.00 | 1.3107 | 0.0908 | |||
| CAT / Caterpillar Inc. | 0.00 | -0.51 | 0.00 | 0.00 | 1.3073 | 0.1415 | |||
| V / Visa Inc. | 0.01 | -1.03 | 0.00 | 0.00 | 1.3010 | -0.0547 | |||
| EPD / Enterprise Products Partners L.P. - Limited Partnership | 0.06 | -0.53 | 0.00 | -50.00 | 1.2851 | -0.2013 | |||
| IBM / International Business Machines Corporation | 0.01 | -0.55 | 0.00 | 0.00 | 1.2838 | 0.1462 | |||
| OKE / ONEOK, Inc. | 0.02 | 0.00 | 0.00 | -50.00 | 1.2326 | -0.3326 | |||
| DIS / The Walt Disney Company | 0.01 | -0.42 | 0.00 | 0.00 | 1.2312 | 0.2034 | |||
| UNP / Union Pacific Corporation | 0.01 | -0.39 | 0.00 | 0.00 | 1.2098 | -0.0932 | |||
| ADP / Automatic Data Processing, Inc. | 0.01 | -0.76 | 0.00 | 0.00 | 1.1130 | -0.0477 | |||
| TXN / Texas Instruments Incorporated | 0.01 | -0.59 | 0.00 | 0.00 | 1.0812 | 0.0975 | |||
| BRK.A / Berkshire Hathaway Inc. | 0.00 | -0.90 | 0.00 | 0.00 | 0.9236 | -0.1440 | |||
| ABT / Abbott Laboratories | 0.01 | -0.30 | 0.00 | 0.00 | 0.7763 | -0.0175 | |||
| HON / Honeywell International Inc. | 0.00 | -1.44 | 0.00 | 0.00 | 0.7722 | 0.0282 | |||
| INTU / Intuit Inc. | 0.00 | 0.00 | 0.00 | 0.7432 | 0.1379 | ||||
| GJR / Strats Trust For Procter & Gambel Security - Preferred Security | 0.01 | -1.66 | 0.00 | 0.00 | 0.7196 | -0.0980 | |||
| NSC / Norfolk Southern Corporation | 0.00 | -0.62 | 0.00 | 0.7141 | 0.0193 | ||||
| BA / The Boeing Company | 0.00 | -1.37 | 0.00 | 0.6802 | 0.0938 | ||||
| VZ / Verizon Communications Inc. | 0.02 | -3.40 | 0.00 | -100.00 | 0.6754 | -0.0902 | |||
| T / AT&T Inc. | 0.03 | -5.03 | 0.00 | 0.6616 | -0.0499 | ||||
| COP / ConocoPhillips | 0.01 | 0.49 | 0.00 | -100.00 | 0.6381 | -0.1384 | |||
| GPC / Genuine Parts Company | 0.01 | 0.89 | 0.00 | 0.6153 | -0.0102 | ||||
| 847 / Seagate Technology Holdings plc | 0.01 | 5.66 | 0.00 | 0.6056 | 0.2531 | ||||
| MMM / 3M Company | 0.01 | -0.54 | 0.00 | 0.5842 | -0.0074 | ||||
| QCOM / QUALCOMM Incorporated | 0.01 | -0.41 | 0.00 | 0.5821 | -0.0066 | ||||
| GOOGL / Alphabet Inc. | 0.00 | -0.42 | 0.00 | 0.5814 | 0.0440 | ||||
| AFL / Aflac Incorporated | 0.01 | -1.62 | 0.00 | 0.5752 | -0.0691 | ||||
| DRI / Darden Restaurants, Inc. | 0.00 | 2.04 | 0.00 | 0.5641 | 0.0137 | ||||
| KO / The Coca-Cola Company | 0.01 | -0.44 | 0.00 | 0.5510 | -0.0341 | ||||
| PEP / PepsiCo, Inc. | 0.01 | -0.92 | 0.00 | 0.5385 | -0.1065 | ||||
| MRK / Merck & Co., Inc. | 0.01 | -0.79 | 0.00 | 0.5157 | -0.0997 | ||||
| CL / Colgate-Palmolive Company | 0.01 | -0.61 | 0.00 | 0.5095 | -0.0431 | ||||
| ITW / Illinois Tool Works Inc. | 0.00 | -1.18 | 0.00 | 0.4991 | -0.0303 | ||||
| UPS / United Parcel Service, Inc. | 0.01 | -0.70 | 0.00 | 0.4950 | -0.0720 | ||||
| 1SBUX / Starbucks Corporation | 0.01 | -0.32 | 0.00 | 0.4908 | -0.0596 | ||||
| MDT / Medtronic plc | 0.01 | -0.92 | 0.00 | 0.4867 | -0.0420 | ||||
| LOW / Lowe's Companies, Inc. | 0.00 | 0.00 | 0.00 | 0.4756 | -0.0466 | ||||
| INTC / Intel Corporation | 0.03 | -0.52 | 0.00 | 0.4459 | -0.0294 | ||||
| BMY / Bristol-Myers Squibb Company | 0.01 | -0.36 | 0.00 | 0.4376 | -0.1670 | ||||
| LMT / Lockheed Martin Corporation | 0.00 | 0.00 | 0.00 | 0.4362 | -0.0037 | ||||
| 0KRX / Prudential Financial, Inc. | 0.01 | -1.74 | 0.00 | 0.4189 | -0.0448 | ||||
| NEE / NextEra Energy, Inc. | 0.01 | -2.44 | 0.00 | 0.4030 | -0.0376 | ||||
| PCAR / PACCAR Inc | 0.01 | 1.12 | 0.00 | 0.3857 | -0.0223 | ||||
| DUK / Duke Energy Corporation | 0.00 | -0.11 | 0.00 | 0.3781 | -0.0307 | ||||
| PM / Philip Morris International Inc. | 0.00 | 0.00 | 0.00 | 0.3775 | 0.0336 | ||||
| MDLZ / Mondelez International, Inc. | 0.01 | -0.74 | 0.00 | 0.3775 | -0.0220 | ||||
| ADBE / Adobe Inc. | 0.00 | 0.71 | 0.00 | 0.3775 | -0.0104 | ||||
| RY / Royal Bank of Canada | 0.00 | 0.00 | 0.00 | 0.3636 | 0.0379 | ||||
| LIN / Linde plc | 0.00 | -0.45 | 0.00 | 0.3567 | -0.0153 | ||||
| NVS / Novartis AG - Depositary Receipt (Common Stock) | 0.00 | 0.00 | 0.00 | 0.3539 | 0.0130 | ||||
| AEP / American Electric Power Company, Inc. | 0.00 | -0.82 | 0.00 | 0.3484 | -0.0380 | ||||
| DHR / Danaher Corporation | 0.00 | 0.60 | 0.00 | 0.3457 | -0.0270 | ||||
| SO / The Southern Company | 0.01 | -0.19 | 0.00 | 0.3422 | -0.0168 | ||||
| IP / International Paper Company | 0.01 | -1.85 | 0.00 | 0.3346 | -0.0713 | ||||
| GD / General Dynamics Corporation | 0.00 | 0.00 | 0.00 | 0.3304 | 0.0076 | ||||
| RTX / RTX Corporation | 0.00 | 0.31 | 0.00 | 0.3298 | 0.0184 | ||||
| BHP / BHP Group Limited - Depositary Receipt (Common Stock) | 0.01 | -1.31 | 0.00 | 0.3132 | -0.0220 | ||||
| BDX / Becton, Dickinson and Company | 0.00 | 1.73 | 0.00 | 0.2807 | -0.1021 | ||||
| PFE / Pfizer Inc. | 0.02 | -3.16 | 0.00 | 0.2620 | -0.0334 | ||||
| ABBV / AbbVie Inc. | 0.00 | 0.00 | 0.00 | 0.2565 | -0.0462 | ||||
| HII / Huntington Ingalls Industries, Inc. | 0.00 | 0.00 | 0.00 | 0.2509 | 0.0292 | ||||
| WM / Waste Management, Inc. | 0.00 | 2.30 | 0.00 | 0.2461 | -0.0081 | ||||
| HSY / The Hershey Company | 0.00 | 0.00 | 0.00 | 0.2316 | -0.0176 | ||||
| SYK / Stryker Corporation | 0.00 | 1.20 | 0.00 | 0.2309 | 0.0063 | ||||
| CRM / Salesforce, Inc. | 0.00 | 4.78 | 0.00 | 0.2274 | 0.0043 | ||||
| DEO / Diageo plc - Depositary Receipt (Common Stock) | 0.00 | -0.77 | 0.00 | 0.2240 | -0.0216 | ||||
| AXP / American Express Company | 0.00 | 0.00 | 0.00 | 0.2205 | 0.0262 | ||||
| SNN / Smith & Nephew plc - Depositary Receipt (Common Stock) | 0.01 | 1.47 | 0.00 | 0.2185 | 0.0097 | ||||
| CTVA / Corteva, Inc. | 0.00 | -0.78 | 0.00 | 0.2171 | 0.0242 | ||||
| ED / Consolidated Edison, Inc. | 0.00 | -0.80 | 0.00 | 0.2157 | -0.0349 | ||||
| FAST / Fastenal Company | 0.01 | 102.76 | 0.00 | 0.2136 | 0.0107 | ||||
| ATO / Atmos Energy Corporation | 0.00 | 0.00 | 0.00 | 0.2102 | -0.0101 | ||||
| NSRGY / Nestlé S.A. - Depositary Receipt (Common Stock) | 0.00 | -0.33 | 0.00 | 0.2074 | -0.0143 | ||||
| TGT / Target Corporation | 0.00 | 0.00 | 0.00 | 0.2046 | -0.0214 | ||||
| WAFD / WaFd, Inc | 0.01 | 0.00 | 0.00 | 0.2026 | -0.0040 | ||||
| BKH / Black Hills Corporation | 0.01 | -1.61 | 0.00 | 0.2019 | -0.0300 | ||||
| WY / Weyerhaeuser Company | 0.01 | -0.88 | 0.00 | 0.1998 | -0.0400 | ||||
| SWKS / Skyworks Solutions, Inc. | 0.00 | 6.31 | 0.00 | 0.1949 | 0.0288 | ||||
| OGE / OGE Energy Corp. | 0.01 | -1.32 | 0.00 | 0.1949 | -0.0188 | ||||
| WEC / WEC Energy Group, Inc. | 0.00 | 0.00 | 0.00 | 0.1846 | -0.0177 | ||||
| CHKP / Check Point Software Technologies Ltd. | 0.00 | 0.00 | 0.00 | 0.1832 | -0.0147 | ||||
| BAC / Bank of America Corporation | 0.01 | 0.00 | 0.1708 | 0.1708 | |||||
| SIEGY / Siemens Aktiengesellschaft - Depositary Receipt (Common Stock) | 0.00 | 2.70 | 0.00 | 0.1694 | 0.0155 | ||||
| D / Dominion Energy, Inc. | 0.00 | -0.58 | 0.00 | 0.1666 | -0.0075 | ||||
| SNY / Sanofi - Depositary Receipt (Common Stock) | 0.00 | 1.53 | 0.00 | 0.1659 | -0.0305 | ||||
| GIS / General Mills, Inc. | 0.00 | -0.86 | 0.00 | 0.1652 | -0.0356 | ||||
| AWK / American Water Works Company, Inc. | 0.00 | 0.00 | 0.00 | 0.1597 | -0.0173 | ||||
| YUM / Yum! Brands, Inc. | 0.00 | 0.00 | 0.00 | 0.1535 | -0.0170 | ||||
| DD / DuPont de Nemours, Inc. | 0.00 | -7.84 | 0.00 | 0.1459 | -0.0340 | ||||
| CLX / The Clorox Company | 0.00 | 1.45 | 0.00 | 0.1459 | -0.0383 |