Statistik Asas
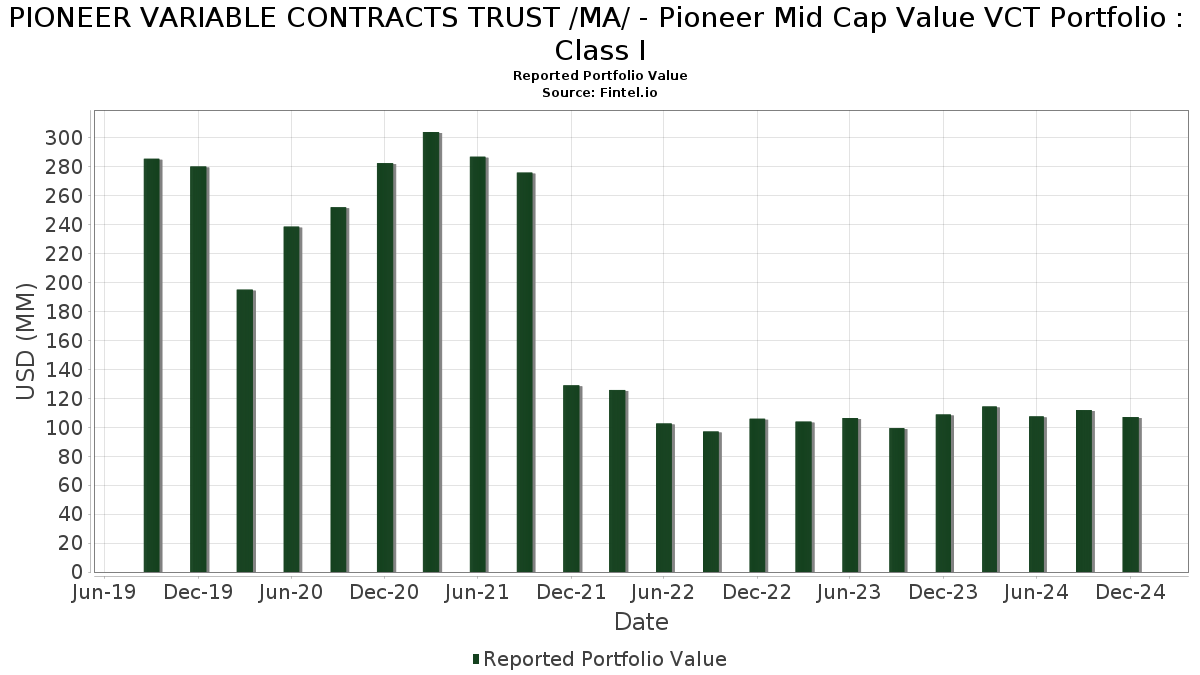
| Nilai Portfolio | $ 107,075,207 |
| Kedudukan Semasa | 67 |
Pegangan Terkini, Prestasi, AUM (dari 13F, 13D)
PIONEER VARIABLE CONTRACTS TRUST /MA/ - Pioneer Mid Cap Value VCT Portfolio : Class I telah mendedahkan 67 jumlah pegangan dalam pemfailan SEC terkini mereka. Nilai portfolio terkini dikira sebagai $ 107,075,207 USD. Aset Sebenar Di Bawah Pengurusan (AUM) ialah nilai ini ditambah dengan tunai (yang tidak didedahkan). Pegangan teratas PIONEER VARIABLE CONTRACTS TRUST /MA/ - Pioneer Mid Cap Value VCT Portfolio : Class I ialah State Street Corporation (US:STT) , Raymond James Financial, Inc. (US:RJF) , Cabot Oil & Gas Corp. (US:COG) , Regions Financial Corporation (US:RF) , and eBay Inc. (US:EBAY) . Kedudukan baharu PIONEER VARIABLE CONTRACTS TRUST /MA/ - Pioneer Mid Cap Value VCT Portfolio : Class I termasuk Target Corporation (US:TGT) , Humana Inc. (US:HUM) , Valero Energy Corporation (US:VLO) , .
Kenaikan Teratas Suku Tahun Ini
Kami menggunakan perubahan dalam peruntukan portfolio kerana ini adalah metrik yang paling bermakna. Perubahan boleh disebabkan oleh perdagangan atau perubahan dalam harga saham.
| Sekuriti | Saham (MM) |
Nilai (MM$) |
Portfolio % | ΔPortfolio % |
|---|---|---|---|---|
| 0.01 | 1.35 | 1.2595 | 1.2595 | |
| 0.01 | 2.26 | 2.1054 | 1.1559 | |
| 0.03 | 1.97 | 1.8392 | 1.0321 | |
| 0.02 | 0.84 | 0.7859 | 0.7859 | |
| 0.03 | 3.96 | 3.6946 | 0.7133 | |
| 0.05 | 1.73 | 1.6172 | 0.5098 | |
| 0.00 | 0.53 | 0.4969 | 0.4969 | |
| 0.01 | 1.69 | 1.5810 | 0.4938 | |
| 0.13 | 3.44 | 3.2080 | 0.4496 | |
| 0.00 | 0.48 | 0.4481 | 0.4481 |
Penurunan Teratas Suku Tahun Ini
Kami menggunakan perubahan dalam peruntukan portfolio kerana ini adalah metrik yang paling bermakna. Perubahan boleh disebabkan oleh perdagangan atau perubahan dalam harga saham.
| Sekuriti | Saham (MM) |
Nilai (MM$) |
Portfolio % | ΔPortfolio % |
|---|---|---|---|---|
| 0.03 | 2.15 | 2.0068 | -1.1084 | |
| 0.01 | 0.75 | 0.6995 | -1.0447 | |
| 0.00 | 1.89 | 1.7659 | -0.8545 | |
| 0.01 | 1.13 | 1.0531 | -0.8280 | |
| 0.00 | 0.00 | -0.7479 | ||
| 0.05 | 2.94 | 2.7471 | -0.5924 | |
| 0.04 | 1.64 | 1.5280 | -0.4911 | |
| 0.01 | 0.52 | 0.4814 | -0.4308 | |
| 0.02 | 1.57 | 1.4674 | -0.3718 | |
| 0.03 | 2.40 | 2.2390 | -0.3699 |
13F dan Pemfailan Dana
Borang ini telah difailkan pada 2025-02-25 untuk tempoh pelaporan 2024-12-31. Klik ikon pautan untuk melihat sejarah transaksi penuh.
Tingkatkan untuk membuka data premium dan eksport ke Excel ![]() .
.
| Sekuriti | Jenis | Purata Harga Saham | Saham (MM) |
ΔSaham (%) |
ΔSaham (%) |
Nilai ($MM) |
Portfolio (%) |
ΔPortfolio (%) |
|
|---|---|---|---|---|---|---|---|---|---|
| STT / State Street Corporation | 0.05 | -6.34 | 4.44 | 3.91 | 4.1446 | 0.3306 | |||
| RJF / Raymond James Financial, Inc. | 0.03 | -6.57 | 3.96 | 18.51 | 3.6946 | 0.7133 | |||
| COG / Cabot Oil & Gas Corp. | 0.13 | 4.28 | 3.44 | 11.23 | 3.2080 | 0.4496 | |||
| RF / Regions Financial Corporation | 0.13 | -1.49 | 2.94 | -0.71 | 2.7474 | 0.1021 | |||
| EBAY / eBay Inc. | 0.05 | -17.33 | 2.94 | -21.34 | 2.7471 | -0.5924 | |||
| MTB / M&T Bank Corporation | 0.02 | -1.48 | 2.82 | 3.98 | 2.6362 | 0.2120 | |||
| AIG / American International Group, Inc. | 0.04 | 11.11 | 2.82 | 10.46 | 2.6325 | 0.3535 | |||
| ZBH / Zimmer Biomet Holdings, Inc. | 0.03 | -1.49 | 2.71 | -3.59 | 2.5302 | 0.0202 | |||
| NTRS / Northern Trust Corporation | 0.02 | -9.28 | 2.49 | 3.28 | 2.3232 | 0.1723 | |||
| TFC / Truist Financial Corporation | 0.06 | -1.49 | 2.47 | -0.08 | 2.3066 | 0.0990 | |||
| GEHC / GE HealthCare Technologies Inc. | 0.03 | -1.49 | 2.40 | -17.93 | 2.2390 | -0.3699 | |||
| KVUE / Kenvue Inc. | 0.11 | -1.49 | 2.36 | -9.05 | 2.2045 | -0.1138 | |||
| ROK / Rockwell Automation, Inc. | 0.01 | 99.17 | 2.26 | 112.14 | 2.1054 | 1.1559 | |||
| PEG / Public Service Enterprise Group Incorporated | 0.03 | -34.96 | 2.15 | -38.41 | 2.0068 | -1.1084 | |||
| CNP / CenterPoint Energy, Inc. | 0.07 | -1.49 | 2.14 | 6.21 | 1.9967 | 0.1996 | |||
| CHRD / Chord Energy Corporation | 0.02 | 14.53 | 2.11 | 2.88 | 1.9690 | 0.1380 | |||
| AER / AerCap Holdings N.V. | 0.02 | -1.48 | 2.09 | -0.48 | 1.9519 | 0.0767 | |||
| GPK / Graphic Packaging Holding Company | 0.08 | -1.49 | 2.07 | -9.57 | 1.9323 | -0.1112 | |||
| ES / Eversource Energy | 0.03 | 158.22 | 1.97 | 118.05 | 1.8392 | 1.0321 | |||
| AGCO / AGCO Corporation | 0.02 | -1.48 | 1.96 | -5.90 | 1.8335 | -0.0295 | |||
| FOXA / Fox Corporation | 0.04 | -14.65 | 1.96 | -2.10 | 1.8326 | 0.0435 | |||
| CFG / Citizens Financial Group, Inc. | 0.04 | -1.49 | 1.95 | 5.01 | 1.8215 | 0.1621 | |||
| MSI / Motorola Solutions, Inc. | 0.00 | -37.32 | 1.89 | -35.57 | 1.7659 | -0.8545 | |||
| AVB / AvalonBay Communities, Inc. | 0.01 | -1.49 | 1.81 | -3.78 | 1.6883 | 0.0102 | |||
| RRC / Range Resources Corporation | 0.05 | 19.39 | 1.73 | 39.68 | 1.6172 | 0.5098 | |||
| EXPE / Expedia Group, Inc. | 0.01 | -1.48 | 1.71 | 24.06 | 1.5938 | 0.3649 | |||
| JBHT / J.B. Hunt Transport Services, Inc. | 0.01 | 40.41 | 1.69 | 39.11 | 1.5810 | 0.4938 | |||
| TAP / Molson Coors Beverage Company | 0.03 | -1.49 | 1.64 | -1.80 | 1.5295 | 0.0397 | |||
| DOW / Dow Inc. | 0.04 | -1.49 | 1.64 | -27.64 | 1.5280 | -0.4911 | |||
| HPQ / HP Inc. | 0.05 | -1.49 | 1.59 | -10.40 | 1.4805 | -0.0993 | |||
| WBD / Warner Bros. Discovery, Inc. | 0.15 | -1.49 | 1.58 | 26.18 | 1.4723 | 0.3568 | |||
| LYB / LyondellBasell Industries N.V. | 0.02 | -1.49 | 1.57 | -23.74 | 1.4674 | -0.3718 | |||
| WHR / Whirlpool Corporation | 0.01 | 21.20 | 1.50 | 29.70 | 1.3987 | 0.3673 | |||
| IR / Ingersoll Rand Inc. | 0.02 | -1.48 | 1.41 | -9.21 | 1.3166 | -0.0701 | |||
| GLPI / Gaming and Leisure Properties, Inc. | 0.03 | -1.49 | 1.38 | -7.77 | 1.2851 | -0.0476 | |||
| TGT / Target Corporation | 0.01 | 1.35 | 1.2595 | 1.2595 | |||||
| BKR / Baker Hughes Company | 0.03 | -1.49 | 1.35 | 11.71 | 1.2566 | 0.1816 | |||
| SYY / Sysco Corporation | 0.02 | 50.01 | 1.30 | 47.01 | 1.2179 | 0.4253 | |||
| WDC / Western Digital Corporation | 0.02 | 58.56 | 1.29 | 38.54 | 1.2081 | 0.3737 | |||
| EXC / Exelon Corporation | 0.03 | -1.49 | 1.27 | -8.54 | 1.1895 | -0.0544 | |||
| KIM / Kimco Realty Corporation | 0.05 | -1.49 | 1.26 | -0.55 | 1.1749 | 0.0447 | |||
| ORI / Old Republic International Corporation | 0.03 | -1.49 | 1.25 | 0.73 | 1.1651 | 0.0583 | |||
| EXR / Extra Space Storage Inc. | 0.01 | -1.46 | 1.25 | -18.23 | 1.1650 | -0.1967 | |||
| CDW / CDW Corporation | 0.01 | -1.48 | 1.23 | -24.20 | 1.1465 | -0.3004 | |||
| RL / Ralph Lauren Corporation | 0.01 | -1.49 | 1.19 | 17.40 | 1.1151 | 0.2066 | |||
| EMR / Emerson Electric Co. | 0.01 | -52.76 | 1.13 | -46.46 | 1.0531 | -0.8280 | |||
| GPC / Genuine Parts Company | 0.01 | -1.49 | 1.12 | -17.68 | 1.0481 | -0.1690 | |||
| DAL / Delta Air Lines, Inc. | 0.02 | -1.48 | 1.03 | 17.39 | 0.9586 | 0.1775 | |||
| BHF / Brighthouse Financial, Inc. | 0.02 | -1.48 | 0.95 | 5.07 | 0.8913 | 0.0804 | |||
| WCC / WESCO International, Inc. | 0.01 | -1.48 | 0.95 | 6.03 | 0.8878 | 0.0879 | |||
| BCO / The Brink's Company | 0.01 | -1.47 | 0.94 | -20.97 | 0.8799 | -0.1846 | |||
| F / Ford Motor Company | 0.09 | -1.49 | 0.93 | -7.65 | 0.8688 | -0.0308 | |||
| NEM / Newmont Corporation | 0.02 | -1.49 | 0.92 | -31.42 | 0.8586 | -0.3383 | |||
| FR / First Industrial Realty Trust, Inc. | 0.02 | -1.49 | 0.91 | -11.74 | 0.8497 | -0.0713 | |||
| HST / Host Hotels & Resorts, Inc. | 0.05 | -1.49 | 0.86 | -1.94 | 0.8030 | 0.0200 | |||
| CPB / The Campbell's Company | 0.02 | 0.84 | 0.7859 | 0.7859 | |||||
| ZM / Zoom Communications Inc. | 0.01 | -1.49 | 0.83 | 15.24 | 0.7775 | 0.1326 | |||
| ON / ON Semiconductor Corporation | 0.01 | -94.16 | 0.75 | -84.91 | 0.6995 | -1.0447 | |||
| HSY / The Hershey Company | 0.00 | -1.44 | 0.73 | -12.90 | 0.6806 | -0.0672 | |||
| LEA / Lear Corporation | 0.01 | -1.47 | 0.65 | -14.51 | 0.6111 | -0.0725 | |||
| DOC / Healthpeak Properties, Inc. | 0.03 | -1.49 | 0.62 | -12.68 | 0.5790 | -0.0551 | |||
| HUM / Humana Inc. | 0.00 | 0.53 | 0.4969 | 0.4969 | |||||
| PYPL / PayPal Holdings, Inc. | 0.01 | -53.87 | 0.52 | -49.56 | 0.4814 | -0.4308 | |||
| VLO / Valero Energy Corporation | 0.00 | 0.48 | 0.4481 | 0.4481 | |||||
| DGCXX / Dreyfus Government Cash Management Funds - Dreyfus Government Cash Management Fund Institutional Shares | 0.44 | 10.33 | 0.44 | 10.41 | 0.4065 | 0.0542 | |||
| CLF / Cleveland-Cliffs Inc. | 0.04 | -1.49 | 0.40 | -27.49 | 0.3750 | -0.1195 | |||
| PCAR / PACCAR Inc | 0.00 | -1.44 | 0.21 | 3.88 | 0.1999 | 0.0159 | |||
| TT / Trane Technologies plc | 0.00 | -100.00 | 0.00 | -100.00 | -0.7479 |