Statistik Asas
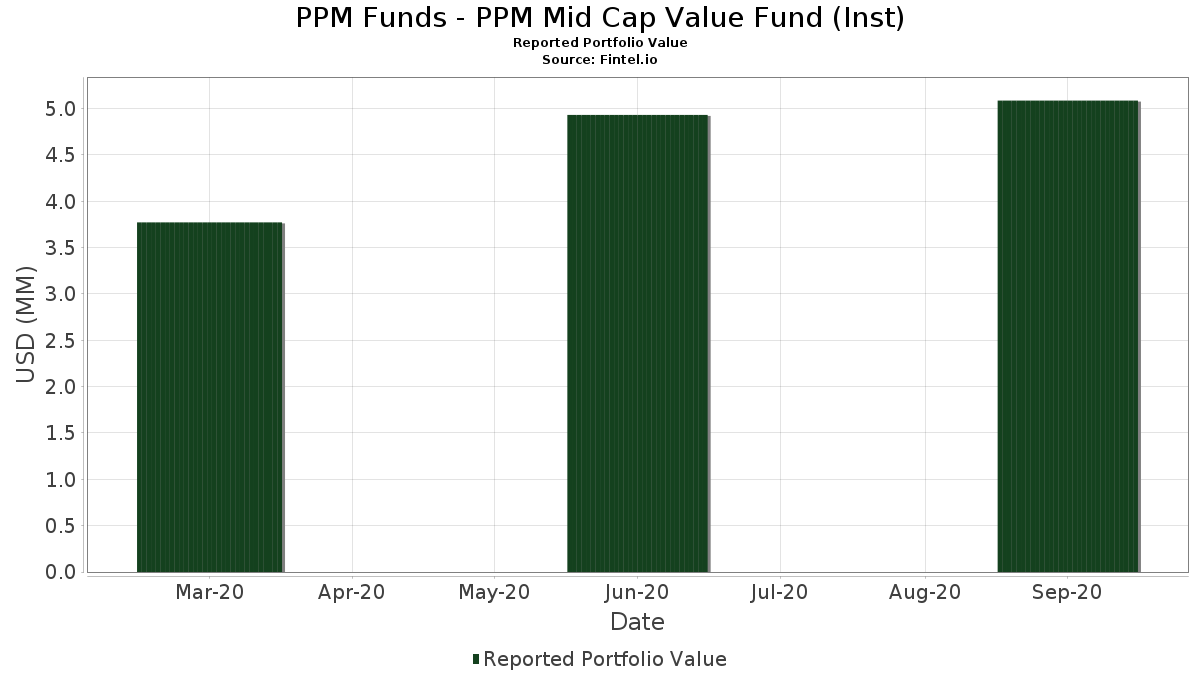
| Nilai Portfolio | $ 5,086,355 |
| Kedudukan Semasa | 56 |
Pegangan Terkini, Prestasi, AUM (dari 13F, 13D)
PPM Funds - PPM Mid Cap Value Fund (Inst) telah mendedahkan 56 jumlah pegangan dalam pemfailan SEC terkini mereka. Nilai portfolio terkini dikira sebagai $ 5,086,355 USD. Aset Sebenar Di Bawah Pengurusan (AUM) ialah nilai ini ditambah dengan tunai (yang tidak didedahkan). Pegangan teratas PPM Funds - PPM Mid Cap Value Fund (Inst) ialah Textron Inc. (US:TXT) , The AES Corporation (US:AES) , Helen of Troy Limited (US:HELE) , Healthpeak Properties, Inc. (US:DOC) , and American Financial Group, Inc. (US:AFG) . Kedudukan baharu PPM Funds - PPM Mid Cap Value Fund (Inst) termasuk Hologic, Inc. (US:HOLX) , Cimarex Energy Co. (US:XEC) , .
Kenaikan Teratas Suku Tahun Ini
Kami menggunakan perubahan dalam peruntukan portfolio kerana ini adalah metrik yang paling bermakna. Perubahan boleh disebabkan oleh perdagangan atau perubahan dalam harga saham.
| Sekuriti | Saham (MM) |
Nilai (MM$) |
Portfolio % | ΔPortfolio % |
|---|---|---|---|---|
| 0.00 | 0.09 | 1.6972 | 1.6972 | |
| 0.00 | 0.08 | 1.5292 | 1.5292 | |
| 0.00 | 0.12 | 2.3463 | 0.9525 | |
| 0.00 | 0.13 | 2.6311 | 0.8338 | |
| 0.00 | 0.08 | 1.6362 | 0.6017 | |
| 0.01 | 0.14 | 2.6677 | 0.4692 | |
| 0.00 | 0.10 | 1.9666 | 0.4249 | |
| 0.01 | 0.13 | 2.4865 | 0.4144 | |
| 0.00 | 0.10 | 1.8716 | 0.3754 | |
| 0.00 | 0.12 | 2.4050 | 0.2925 |
Penurunan Teratas Suku Tahun Ini
Kami menggunakan perubahan dalam peruntukan portfolio kerana ini adalah metrik yang paling bermakna. Perubahan boleh disebabkan oleh perdagangan atau perubahan dalam harga saham.
| Sekuriti | Saham (MM) |
Nilai (MM$) |
Portfolio % | ΔPortfolio % |
|---|---|---|---|---|
| 0.00 | 0.09 | 1.7048 | -0.7456 | |
| 0.00 | 0.06 | 1.1082 | -0.6835 | |
| 0.00 | 0.10 | 1.8811 | -0.5590 | |
| 0.00 | 0.05 | 1.0506 | -0.4654 | |
| 0.00 | 0.05 | 0.9420 | -0.3742 | |
| 0.00 | 0.06 | 1.1142 | -0.3387 | |
| 0.00 | 0.11 | 2.2296 | -0.2890 | |
| 0.00 | 0.10 | 1.9964 | -0.2813 | |
| 0.00 | 0.03 | 0.6584 | -0.2585 | |
| 0.00 | 0.04 | 0.8284 | -0.2220 |
13F dan Pemfailan Dana
Borang ini telah difailkan pada 2020-11-24 untuk tempoh pelaporan 2020-09-30. Klik ikon pautan untuk melihat sejarah transaksi penuh.
Tingkatkan untuk membuka data premium dan eksport ke Excel ![]() .
.
| Sekuriti | Jenis | Purata Harga Saham | Saham (MM) |
ΔSaham (%) |
ΔSaham (%) |
Nilai ($MM) |
Portfolio (%) |
ΔPortfolio (%) |
|
|---|---|---|---|---|---|---|---|---|---|
| TXT / Textron Inc. | 0.00 | -5.00 | 0.14 | 4.58 | 2.6936 | 0.0305 | |||
| AES / The AES Corporation | 0.01 | 0.00 | 0.14 | 25.00 | 2.6677 | 0.4692 | |||
| HELE / Helen of Troy Limited | 0.00 | 0.00 | 0.14 | 3.05 | 2.6606 | -0.0095 | |||
| DOC / Healthpeak Properties, Inc. | 0.01 | 0.00 | 0.13 | 2.29 | 2.6383 | -0.0199 | |||
| AFG / American Financial Group, Inc. | 0.00 | 42.86 | 0.13 | 51.14 | 2.6311 | 0.8338 | |||
| JHG / Janus Henderson Group plc | 0.01 | 0.00 | 0.13 | 3.17 | 2.5596 | -0.0088 | |||
| MGLN / Magellan Health Inc | 0.00 | 0.00 | 0.13 | 3.23 | 2.5303 | 0.0204 | |||
| HUN / Huntsman Corporation | 0.01 | 0.00 | 0.13 | 23.53 | 2.4865 | 0.4144 | |||
| KMT / Kennametal Inc. | 0.00 | 0.00 | 0.12 | 0.81 | 2.4442 | -0.0533 | |||
| RS / Reliance, Inc. | 0.00 | 9.09 | 0.12 | 17.31 | 2.4050 | 0.2925 | |||
| VST / Vistra Corp. | 0.01 | 0.00 | 0.12 | 0.84 | 2.3707 | -0.0400 | |||
| PEAK / Healthpeak Properties, Inc. | 0.00 | 76.00 | 0.12 | 75.00 | 2.3463 | 0.9525 | |||
| MCK / McKesson Corporation | 0.00 | 0.00 | 0.12 | -2.46 | 2.3401 | -0.1428 | |||
| INGR / Ingredion Incorporated | 0.00 | 0.00 | 0.11 | -8.87 | 2.2296 | -0.2890 | |||
| ALL / The Allstate Corporation | 0.00 | 0.00 | 0.11 | -3.45 | 2.2188 | -0.1357 | |||
| KR / The Kroger Co. | 0.00 | 0.00 | 0.11 | 0.00 | 2.1313 | -0.0600 | |||
| / ViacomCBS Inc | 0.00 | -17.39 | 0.11 | -0.93 | 2.0905 | -0.0796 | |||
| DAL / Delta Air Lines, Inc. | 0.00 | -10.53 | 0.10 | -2.83 | 2.0421 | -0.1142 | |||
| PNM / PNM Resources, Inc. | 0.00 | 0.00 | 0.10 | 7.29 | 2.0294 | 0.0853 | |||
| CI / The Cigna Group | 0.00 | 0.00 | 0.10 | -9.82 | 1.9964 | -0.2813 | |||
| CPB / The Campbell's Company | 0.00 | 0.00 | 0.10 | -2.88 | 1.9951 | -0.1134 | |||
| MTZ / MasTec, Inc. | 0.00 | 0.00 | 0.10 | -5.61 | 1.9892 | -0.1893 | |||
| EXC / Exelon Corporation | 0.00 | 33.33 | 0.10 | 31.58 | 1.9666 | 0.4249 | |||
| HIG / The Hartford Insurance Group, Inc. | 0.00 | 0.00 | 0.10 | -4.81 | 1.9547 | -0.1509 | |||
| FL / Foot Locker, Inc. | 0.00 | 0.00 | 0.10 | 13.10 | 1.8813 | 0.1706 | |||
| 872307903 / TCF Financial Corporation | 0.00 | 0.00 | 0.10 | -20.83 | 1.8811 | -0.5590 | |||
| SMTC / Semtech Corporation | 0.00 | -5.26 | 0.10 | -4.04 | 1.8723 | -0.1348 | |||
| RHI / Robert Half Inc. | 0.00 | 28.57 | 0.10 | 30.14 | 1.8716 | 0.3754 | |||
| REG / Regency Centers Corporation | 0.00 | 25.00 | 0.10 | 4.40 | 1.8669 | 0.0102 | |||
| BBY / Best Buy Co., Inc. | 0.00 | -15.00 | 0.09 | 8.05 | 1.8580 | 0.0925 | |||
| NWL / Newell Brands Inc. | 0.01 | 0.00 | 0.09 | 8.05 | 1.8537 | 0.0868 | |||
| RGA / Reinsurance Group of America, Incorporated | 0.00 | 0.00 | 0.09 | 21.62 | 1.7761 | 0.2686 | |||
| BERY / Berry Global Group, Inc. | 0.00 | 0.00 | 0.09 | 8.86 | 1.7083 | 0.0944 | |||
| SNV / Synovus Financial Corp. | 0.00 | -30.51 | 0.09 | -28.93 | 1.7048 | -0.7456 | |||
| HOLX / Hologic, Inc. | 0.00 | 0.09 | 1.6972 | 1.6972 | |||||
| HOMB / Home Bancshares, Inc. (Conway, AR) | 0.01 | 0.00 | 0.08 | -1.19 | 1.6377 | -0.0736 | |||
| CTSH / Cognizant Technology Solutions Corporation | 0.00 | 33.33 | 0.08 | 62.75 | 1.6362 | 0.6017 | |||
| PAG / Penske Automotive Group, Inc. | 0.00 | -19.05 | 0.08 | 0.00 | 1.5913 | -0.0532 | |||
| STLD / Steel Dynamics, Inc. | 0.00 | 0.00 | 0.08 | 9.59 | 1.5745 | 0.0967 | |||
| TER / Teradyne, Inc. | 0.00 | 0.00 | 0.08 | -5.95 | 1.5607 | -0.1490 | |||
| XEC / Cimarex Energy Co. | 0.00 | 0.08 | 1.5292 | 1.5292 | |||||
| HBAN / Huntington Bancshares Incorporated | 0.01 | 0.00 | 0.07 | 1.47 | 1.3688 | -0.0203 | |||
| BDC / Belden Inc. | 0.00 | 0.00 | 0.07 | -4.23 | 1.3447 | -0.1040 | |||
| TEX / Terex Corporation | 0.00 | 0.00 | 0.07 | 3.13 | 1.3119 | 0.0018 | |||
| RCL / Royal Caribbean Cruises Ltd. | 0.00 | -25.00 | 0.06 | -3.33 | 1.1442 | -0.0769 | |||
| SPR / Spirit AeroSystems Holdings, Inc. | 0.00 | 0.00 | 0.06 | -21.13 | 1.1142 | -0.3387 | |||
| NUAN / Nuance Communications Inc | 0.00 | -51.43 | 0.06 | -36.36 | 1.1082 | -0.6835 | |||
| LDOS / Leidos Holdings, Inc. | 0.00 | -25.00 | 0.05 | -28.38 | 1.0506 | -0.4654 | |||
| CACI / CACI International Inc | 0.00 | -25.00 | 0.05 | -27.69 | 0.9420 | -0.3742 | |||
| SRE / Sempra | 0.00 | 0.00 | 0.05 | 2.17 | 0.9299 | -0.0187 | |||
| AVT / Avnet, Inc. | 0.00 | 0.00 | 0.05 | -8.00 | 0.9135 | -0.1019 | |||
| STL / Sterling Bancorp. | 0.00 | 0.00 | 0.04 | -10.42 | 0.8472 | -0.1249 | |||
| HAL / Halliburton Company | 0.00 | -12.50 | 0.04 | -17.65 | 0.8284 | -0.2220 | |||
| WDC / Western Digital Corporation | 0.00 | 0.00 | 0.04 | -18.18 | 0.7179 | -0.1753 | |||
| GVMXX / State Street Institutional Investment Trust - State Street Institutional US Govt Money Market Fnd Premier Cls | 0.04 | -0.51 | 0.04 | 0.00 | 0.7023 | -0.0247 | |||
| NOV / NOV Inc. | 0.00 | 0.00 | 0.03 | -26.67 | 0.6584 | -0.2585 |