Statistik Asas
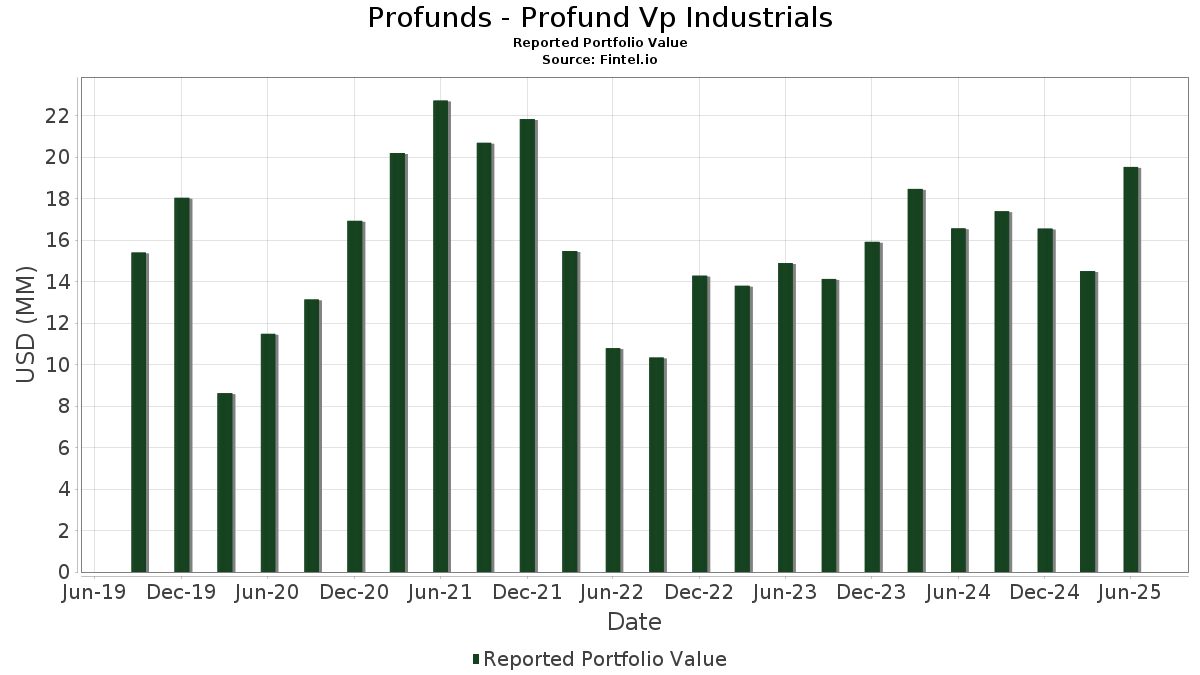
| Nilai Portfolio | $ 19,523,084 |
| Kedudukan Semasa | 87 |
Pegangan Terkini, Prestasi, AUM (dari 13F, 13D)
Profunds - Profund Vp Industrials telah mendedahkan 87 jumlah pegangan dalam pemfailan SEC terkini mereka. Nilai portfolio terkini dikira sebagai $ 19,523,084 USD. Aset Sebenar Di Bawah Pengurusan (AUM) ialah nilai ini ditambah dengan tunai (yang tidak didedahkan). Pegangan teratas Profunds - Profund Vp Industrials ialah General Electric Company (US:GE) , Uber Technologies, Inc. (US:UBER) , RTX Corporation (US:RTX) , Caterpillar Inc. (US:CAT) , and The Boeing Company (US:BA) . Kedudukan baharu Profunds - Profund Vp Industrials termasuk Ralliant Corporation (US:RAL) , .
Kenaikan Teratas Suku Tahun Ini
Kami menggunakan perubahan dalam peruntukan portfolio kerana ini adalah metrik yang paling bermakna. Perubahan boleh disebabkan oleh perdagangan atau perubahan dalam harga saham.
| Sekuriti | Saham (MM) |
Nilai (MM$) |
Portfolio % | ΔPortfolio % |
|---|---|---|---|---|
| 0.00 | 0.61 | 3.1120 | 1.0485 | |
| 0.16 | 0.8140 | 0.8140 | ||
| 0.00 | 1.16 | 5.9148 | 0.6517 | |
| 0.11 | 0.5494 | 0.5494 | ||
| 0.01 | 0.83 | 4.2040 | 0.4753 | |
| 0.00 | 0.26 | 1.3184 | 0.3863 | |
| 0.00 | 0.59 | 3.0094 | 0.3784 | |
| 0.00 | 0.32 | 1.6192 | 0.3324 | |
| 0.00 | 0.24 | 1.2079 | 0.2895 | |
| 0.05 | 0.2747 | 0.2747 |
Penurunan Teratas Suku Tahun Ini
Kami menggunakan perubahan dalam peruntukan portfolio kerana ini adalah metrik yang paling bermakna. Perubahan boleh disebabkan oleh perdagangan atau perubahan dalam harga saham.
| Sekuriti | Saham (MM) |
Nilai (MM$) |
Portfolio % | ΔPortfolio % |
|---|---|---|---|---|
| 0.00 | 0.58 | 2.9626 | -0.5346 | |
| 0.00 | 0.31 | 1.5960 | -0.3744 | |
| 0.00 | 0.53 | 2.6970 | -0.3483 | |
| 0.00 | 0.18 | 0.9297 | -0.2859 | |
| 0.00 | 0.35 | 1.8055 | -0.2666 | |
| 0.00 | 0.29 | 1.4575 | -0.2483 | |
| 0.00 | 0.21 | 1.0801 | -0.2428 | |
| 0.00 | 0.08 | 0.3819 | -0.2299 | |
| 0.00 | 0.41 | 2.0805 | -0.2117 | |
| 0.00 | 0.20 | 1.0049 | -0.2064 |
13F dan Pemfailan Dana
Borang ini telah difailkan pada 2025-08-26 untuk tempoh pelaporan 2025-06-30. Klik ikon pautan untuk melihat sejarah transaksi penuh.
Tingkatkan untuk membuka data premium dan eksport ke Excel ![]() .
.
| Sekuriti | Jenis | Purata Harga Saham | Saham (MM) |
ΔSaham (%) |
ΔSaham (%) |
Nilai ($MM) |
Portfolio (%) |
ΔPortfolio (%) |
|
|---|---|---|---|---|---|---|---|---|---|
| GE / General Electric Company | 0.00 | 18.00 | 1.16 | 51.70 | 5.9148 | 0.6517 | |||
| UBER / Uber Technologies, Inc. | 0.01 | 18.89 | 0.83 | 52.40 | 4.2040 | 0.4753 | |||
| RTX / RTX Corporation | 0.01 | 19.09 | 0.83 | 31.32 | 4.2031 | -0.1198 | |||
| CAT / Caterpillar Inc. | 0.00 | 16.90 | 0.77 | 37.79 | 3.9342 | 0.0738 | |||
| BA / The Boeing Company | 0.00 | 19.36 | 0.67 | 46.71 | 3.4036 | 0.2697 | |||
| HON / Honeywell International Inc. | 0.00 | 17.38 | 0.63 | 28.92 | 3.2249 | -0.1482 | |||
| GEV / GE Vernova Inc. | 0.00 | 17.48 | 0.61 | 103.67 | 3.1120 | 1.0485 | |||
| ETN / Eaton Corporation plc | 0.00 | 17.60 | 0.59 | 54.31 | 3.0094 | 0.3784 | |||
| UNP / Union Pacific Corporation | 0.00 | 17.45 | 0.58 | 14.34 | 2.9626 | -0.5346 | |||
| DE / Deere & Company | 0.00 | 18.38 | 0.54 | 28.37 | 2.7654 | -0.1460 | |||
| ADP / Automatic Data Processing, Inc. | 0.00 | 18.47 | 0.53 | 19.64 | 2.6970 | -0.3483 | |||
| TT / Trane Technologies plc | 0.00 | 18.12 | 0.41 | 53.53 | 2.1029 | 0.2514 | |||
| LMT / Lockheed Martin Corporation | 0.00 | 18.21 | 0.41 | 22.52 | 2.0805 | -0.2117 | |||
| PH / Parker-Hannifin Corporation | 0.00 | 17.86 | 0.38 | 35.13 | 1.9224 | 0.0058 | |||
| TDG / TransDigm Group Incorporated | 0.00 | 19.00 | 0.36 | 30.80 | 1.8412 | -0.0592 | |||
| WM / Waste Management, Inc. | 0.00 | 19.03 | 0.35 | 17.61 | 1.8055 | -0.2666 | |||
| MMM / 3M Company | 0.00 | 17.72 | 0.35 | 21.83 | 1.7651 | -0.1880 | |||
| CTAS / Cintas Corporation | 0.00 | 18.89 | 0.32 | 29.08 | 1.6486 | -0.0781 | |||
| HWM / Howmet Aerospace Inc. | 0.00 | 18.42 | 0.32 | 70.05 | 1.6192 | 0.3324 | |||
| EMR / Emerson Electric Co. | 0.00 | 18.45 | 0.32 | 44.09 | 1.6157 | 0.1011 | |||
| UPS / United Parcel Service, Inc. | 0.00 | 19.17 | 0.31 | 9.44 | 1.5960 | -0.3744 | |||
| GD / General Dynamics Corporation | 0.00 | 17.90 | 0.31 | 26.42 | 1.5832 | -0.1113 | |||
| JCI / Johnson Controls International plc | 0.00 | 18.39 | 0.29 | 56.38 | 1.4975 | 0.2021 | |||
| NOC / Northrop Grumman Corporation | 0.00 | 18.14 | 0.29 | 15.32 | 1.4575 | -0.2483 | |||
| ITW / Illinois Tool Works Inc. | 0.00 | 18.59 | 0.28 | 18.22 | 1.4201 | -0.2017 | |||
| CSX / CSX Corporation | 0.01 | 15.69 | 0.26 | 28.22 | 1.3207 | -0.0696 | |||
| AXON / Axon Enterprise, Inc. | 0.00 | 21.32 | 0.26 | 91.85 | 1.3184 | 0.3863 | |||
| CARR / Carrier Global Corporation | 0.00 | 17.26 | 0.25 | 35.71 | 1.2574 | 0.0031 | |||
| NSC / Norfolk Southern Corporation | 0.00 | 18.19 | 0.24 | 27.75 | 1.2436 | -0.0710 | |||
| PWR / Quanta Services, Inc. | 0.00 | 19.39 | 0.24 | 78.20 | 1.2079 | 0.2895 | |||
| FDX / FedEx Corporation | 0.00 | 18.23 | 0.21 | 10.42 | 1.0801 | -0.2428 | |||
| RSG / Republic Services, Inc. | 0.00 | 18.78 | 0.21 | 21.14 | 1.0790 | -0.1254 | |||
| PCAR / PACCAR Inc | 0.00 | 18.88 | 0.21 | 15.93 | 1.0751 | -0.1757 | |||
| URI / United Rentals, Inc. | 0.00 | 18.03 | 0.21 | 41.78 | 1.0540 | 0.0510 | |||
| FAST / Fastenal Company | 0.00 | 137.60 | 0.20 | 29.11 | 1.0382 | -0.0512 | |||
| LHX / L3Harris Technologies, Inc. | 0.00 | 17.86 | 0.20 | 41.43 | 1.0107 | 0.0445 | |||
| PAYX / Paychex, Inc. | 0.00 | 18.81 | 0.20 | 11.93 | 1.0049 | -0.2064 | |||
| GWW / W.W. Grainger, Inc. | 0.00 | 17.09 | 0.19 | 23.08 | 0.9790 | -0.0931 | |||
| CMI / Cummins Inc. | 0.00 | 18.98 | 0.19 | 24.18 | 0.9714 | -0.0837 | |||
| VRSK / Verisk Analytics, Inc. | 0.00 | 17.46 | 0.18 | 22.67 | 0.9382 | -0.0922 | |||
| CPRT / Copart, Inc. | 0.00 | 19.09 | 0.18 | 3.41 | 0.9297 | -0.2859 | |||
| AME / AMETEK, Inc. | 0.00 | 18.55 | 0.18 | 23.94 | 0.9004 | -0.0752 | |||
| OTIS / Otis Worldwide Corporation | 0.00 | 18.25 | 0.17 | 13.79 | 0.8423 | -0.1601 | |||
| HSBC SECURITIES (USA), INC. B 4.3 , 7/01/2025 / RA (N/A) | 0.16 | 0.8140 | 0.8140 | ||||||
| ROK / Rockwell Automation, Inc. | 0.00 | 18.36 | 0.16 | 51.92 | 0.8061 | 0.0908 | |||
| WAB / Westinghouse Air Brake Technologies Corporation | 0.00 | 19.05 | 0.15 | 37.27 | 0.7722 | 0.0135 | |||
| IR / Ingersoll Rand Inc. | 0.00 | 18.93 | 0.14 | 23.48 | 0.7232 | -0.0668 | |||
| EFX / Equifax Inc. | 0.00 | 19.00 | 0.14 | 27.10 | 0.6941 | -0.0454 | |||
| DAL / Delta Air Lines, Inc. | 0.00 | 20.85 | 0.14 | 36.36 | 0.6918 | 0.0065 | |||
| XYL / Xylem Inc. | 0.00 | 19.05 | 0.13 | 29.13 | 0.6785 | -0.0321 | |||
| ODFL / Old Dominion Freight Line, Inc. | 0.00 | 17.61 | 0.13 | 15.45 | 0.6506 | -0.1108 | |||
| BR / Broadridge Financial Solutions, Inc. | 0.00 | 19.18 | 0.12 | 18.81 | 0.6145 | -0.0800 | |||
| UAL / United Airlines Holdings, Inc. | 0.00 | 17.90 | 0.11 | 37.50 | 0.5603 | 0.0039 | |||
| SOCIETE' GENERALE 4.26 , 7/01/2025 / RA (N/A) | 0.11 | 0.5494 | 0.5494 | ||||||
| DOV / Dover Corporation | 0.00 | 18.81 | 0.11 | 24.71 | 0.5416 | -0.0485 | |||
| VLTO / Veralto Corporation | 0.00 | 19.05 | 0.11 | 23.53 | 0.5393 | -0.0512 | |||
| HUBB / Hubbell Incorporated | 0.00 | 18.32 | 0.09 | 46.03 | 0.4696 | 0.0354 | |||
| LDOS / Leidos Holdings, Inc. | 0.00 | 16.45 | 0.09 | 34.92 | 0.4374 | 0.0036 | |||
| LUV / Southwest Airlines Co. | 0.00 | 14.19 | 0.08 | 11.43 | 0.3984 | -0.0892 | |||
| LII / Lennox International Inc. | 0.00 | 18.42 | 0.08 | 22.22 | 0.3937 | -0.0455 | |||
| FTV / Fortive Corporation | 0.00 | 18.32 | 0.08 | -15.73 | 0.3819 | -0.2299 | |||
| PNR / Pentair plc | 0.00 | 18.34 | 0.07 | 39.22 | 0.3640 | 0.0101 | |||
| SNA / Snap-on Incorporated | 0.00 | 18.18 | 0.07 | 7.94 | 0.3499 | -0.0830 | |||
| ROL / Rollins, Inc. | 0.00 | 18.86 | 0.07 | 24.07 | 0.3419 | -0.0300 | |||
| J / Jacobs Solutions Inc. | 0.00 | 16.48 | 0.07 | 26.92 | 0.3404 | -0.0225 | |||
| EXPD / Expeditors International of Washington, Inc. | 0.00 | 16.23 | 0.07 | 10.00 | 0.3371 | -0.0751 | |||
| TXT / Textron Inc. | 0.00 | 17.51 | 0.06 | 29.79 | 0.3125 | -0.0106 | |||
| MAS / Masco Corporation | 0.00 | 18.12 | 0.06 | 9.62 | 0.2924 | -0.0687 | |||
| IEX / IDEX Corporation | 0.00 | 18.52 | 0.06 | 16.67 | 0.2858 | -0.0498 | |||
| BLDR / Builders FirstSource, Inc. | 0.00 | 14.15 | 0.05 | 5.88 | 0.2778 | -0.0741 | |||
| CREDIT AGRICOLE CIB NY 4.26 , 7/01/2025 / RA (N/A) | 0.05 | 0.2747 | 0.2747 | ||||||
| ALLE / Allegion plc | 0.00 | 17.42 | 0.05 | 30.00 | 0.2669 | -0.0109 | |||
| NDSN / Nordson Corporation | 0.00 | 18.65 | 0.05 | 28.95 | 0.2497 | -0.0177 | |||
| CHRW / C.H. Robinson Worldwide, Inc. | 0.00 | 18.91 | 0.05 | 11.63 | 0.2455 | -0.0520 | |||
| JBHT / J.B. Hunt Transport Services, Inc. | 0.00 | 17.31 | 0.05 | 14.63 | 0.2425 | -0.0451 | |||
| PAYC / Paycom Software, Inc. | 0.00 | 22.62 | 0.05 | 30.56 | 0.2425 | -0.0096 | |||
| UMB FINANCIAL CORP. B 4.1 , 7/01/2025 / RA (N/A) | 0.05 | 0.2391 | 0.2391 | ||||||
| SWK / Stanley Black & Decker, Inc. | 0.00 | 19.09 | 0.04 | 4.76 | 0.2258 | -0.0647 | |||
| NATWEST MARKETS PLC 4.24 , 7/01/2025 / RA (N/A) | 0.04 | 0.2238 | 0.2238 | ||||||
| HII / Huntington Ingalls Industries, Inc. | 0.00 | 18.57 | 0.04 | 42.86 | 0.2039 | 0.0077 | |||
| DAY / Dayforce Inc. | 0.00 | 19.40 | 0.04 | 12.12 | 0.1908 | -0.0364 | |||
| GNRC / Generac Holdings Inc. | 0.00 | 17.37 | 0.04 | 34.62 | 0.1821 | -0.0032 | |||
| AOS / A. O. Smith Corporation | 0.00 | 16.86 | 0.03 | 18.52 | 0.1641 | -0.0249 | |||
| ROYAL BANK OF CANADA 4.15 , 7/01/2025 / RA (N/A) | 0.03 | 0.1374 | 0.1374 | ||||||
| RAL / Ralliant Corporation | 0.00 | 0.00 | 0.0002 | 0.0002 | |||||
| VPIN_IXI_GOLDMAN / DE (N/A) | -0.00 | -0.0114 | -0.0114 | ||||||
| VPIN_IXI_GOLDMAN / DE (N/A) | -0.00 | -0.0114 | -0.0114 |