Statistik Asas
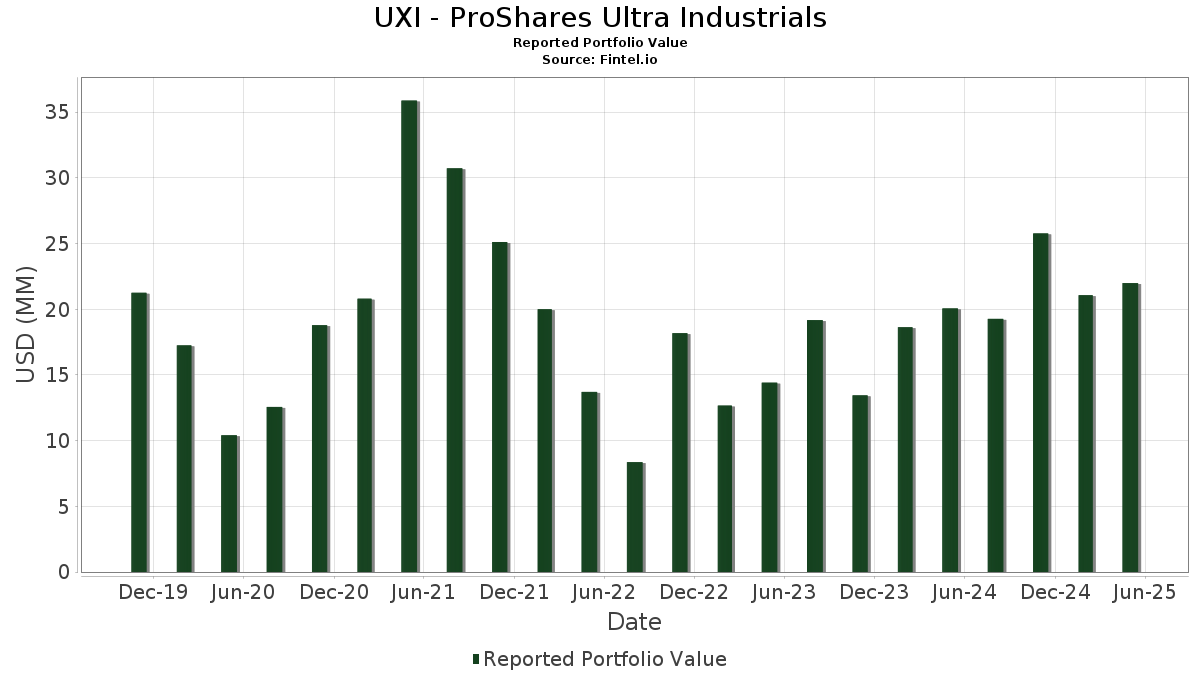
| Nilai Portfolio | $ 21,991,880 |
| Kedudukan Semasa | 93 |
Pegangan Terkini, Prestasi, AUM (dari 13F, 13D)
UXI - ProShares Ultra Industrials telah mendedahkan 93 jumlah pegangan dalam pemfailan SEC terkini mereka. Nilai portfolio terkini dikira sebagai $ 21,991,880 USD. Aset Sebenar Di Bawah Pengurusan (AUM) ialah nilai ini ditambah dengan tunai (yang tidak didedahkan). Pegangan teratas UXI - ProShares Ultra Industrials ialah General Electric Company (US:GE) , RTX Corporation (US:RTX) , Uber Technologies, Inc. (US:UBER) , Caterpillar Inc. (US:CAT) , and The Boeing Company (US:BA) .
Kenaikan Teratas Suku Tahun Ini
Kami menggunakan perubahan dalam peruntukan portfolio kerana ini adalah metrik yang paling bermakna. Perubahan boleh disebabkan oleh perdagangan atau perubahan dalam harga saham.
| Sekuriti | Saham (MM) |
Nilai (MM$) |
Portfolio % | ΔPortfolio % |
|---|---|---|---|---|
| 3.00 | 13.2183 | 13.2183 | ||
| 0.55 | 2.4187 | 2.4187 | ||
| 0.38 | 1.6931 | 1.6931 | ||
| 0.33 | 1.4512 | 1.4512 | ||
| 0.33 | 1.4487 | 1.4487 | ||
| 0.33 | 1.4487 | 1.4487 | ||
| 0.27 | 1.2094 | 1.2094 | ||
| 0.19 | 0.8466 | 0.8466 | ||
| 0.19 | 0.8466 | 0.8466 | ||
| 0.16 | 0.7256 | 0.7256 |
Penurunan Teratas Suku Tahun Ini
Kami menggunakan perubahan dalam peruntukan portfolio kerana ini adalah metrik yang paling bermakna. Perubahan boleh disebabkan oleh perdagangan atau perubahan dalam harga saham.
| Sekuriti | Saham (MM) |
Nilai (MM$) |
Portfolio % | ΔPortfolio % |
|---|---|---|---|---|
| 0.00 | 0.26 | 1.1604 | -0.2533 | |
| 0.00 | 0.49 | 2.1777 | -0.2504 | |
| 0.00 | 0.18 | 0.7864 | -0.1738 | |
| 0.00 | 0.11 | 0.5051 | -0.1209 | |
| 0.00 | 0.18 | 0.8004 | -0.1128 | |
| 0.00 | 0.16 | 0.7184 | -0.1028 | |
| 0.00 | 0.24 | 1.0651 | -0.0877 | |
| 0.00 | 0.10 | 0.4251 | -0.0757 | |
| 0.00 | 0.30 | 1.3097 | -0.0624 | |
| 0.00 | 0.09 | 0.3895 | -0.0590 |
13F dan Pemfailan Dana
Borang ini telah difailkan pada 2025-07-28 untuk tempoh pelaporan 2025-05-31. Klik ikon pautan untuk melihat sejarah transaksi penuh.
Tingkatkan untuk membuka data premium dan eksport ke Excel ![]() .
.
| Sekuriti | Jenis | Purata Harga Saham | Saham (MM) |
ΔSaham (%) |
ΔSaham (%) |
Nilai ($MM) |
Portfolio (%) |
ΔPortfolio (%) |
|
|---|---|---|---|---|---|---|---|---|---|
| U.S. Treasury Bills / STIV (US912797NP82) | 3.00 | 13.2183 | 13.2183 | ||||||
| GE / General Electric Company | 0.00 | -3.51 | 0.97 | 14.72 | 4.2933 | 0.6556 | |||
| RTX / RTX Corporation | 0.00 | -2.65 | 0.67 | -0.15 | 2.9573 | 0.0819 | |||
| UBER / Uber Technologies, Inc. | 0.01 | -3.48 | 0.65 | 6.75 | 2.8600 | 0.2605 | |||
| CAT / Caterpillar Inc. | 0.00 | -3.66 | 0.61 | -2.54 | 2.7060 | 0.0097 | |||
| BA / The Boeing Company | 0.00 | -2.36 | 0.57 | 15.76 | 2.5294 | 0.4098 | |||
| Repurchase Agreement / RA (000000000) | 0.55 | 2.4187 | 2.4187 | ||||||
| HON / Honeywell International Inc. | 0.00 | -2.72 | 0.54 | 3.63 | 2.3968 | 0.1492 | |||
| UNP / Union Pacific Corporation | 0.00 | -3.04 | 0.49 | -12.87 | 2.1777 | -0.2504 | |||
| ADP / Automatic Data Processing, Inc. | 0.00 | -2.85 | 0.49 | 0.41 | 2.1537 | 0.0689 | |||
| GEV / GE Vernova Inc. | 0.00 | -2.68 | 0.48 | 37.43 | 2.1223 | 0.6212 | |||
| DE / Deere & Company | 0.00 | -3.11 | 0.47 | 2.16 | 2.0864 | 0.1000 | |||
| ETN / Eaton Corporation plc | 0.00 | -2.67 | 0.47 | 6.15 | 2.0577 | 0.1765 | |||
| Repurchase Agreement / RA (000000000) | 0.38 | 1.6931 | 1.6931 | ||||||
| LMT / Lockheed Martin Corporation | 0.00 | -3.50 | 0.37 | 3.33 | 1.6435 | 0.0991 | |||
| TT / Trane Technologies plc | 0.00 | -3.04 | 0.36 | 17.88 | 1.5703 | 0.2771 | |||
| Repurchase Agreement / RA (000000000) | 0.33 | 1.4512 | 1.4512 | ||||||
| Total Return Swap / DE (N/A) | 0.33 | 1.4487 | 1.4487 | ||||||
| Total Return Swap / DE (N/A) | 0.33 | 1.4487 | 1.4487 | ||||||
| WM / Waste Management, Inc. | 0.00 | -2.67 | 0.32 | 0.62 | 1.4317 | 0.0514 | |||
| PH / Parker-Hannifin Corporation | 0.00 | -2.66 | 0.32 | -3.37 | 1.3916 | -0.0051 | |||
| TDG / TransDigm Group Incorporated | 0.00 | -2.82 | 0.30 | 4.12 | 1.3398 | 0.0930 | |||
| MMM / 3M Company | 0.00 | -3.05 | 0.30 | -7.19 | 1.3097 | -0.0624 | |||
| CTAS / Cintas Corporation | 0.00 | -2.62 | 0.29 | 6.32 | 1.2639 | 0.1090 | |||
| Repurchase Agreement / RA (000000000) | 0.27 | 1.2094 | 1.2094 | ||||||
| UPS / United Parcel Service, Inc. | 0.00 | -2.70 | 0.26 | -20.30 | 1.1604 | -0.2533 | |||
| GD / General Dynamics Corporation | 0.00 | -4.49 | 0.26 | 5.26 | 1.1489 | 0.0891 | |||
| HWM / Howmet Aerospace Inc. | 0.00 | -2.99 | 0.25 | 20.48 | 1.1195 | 0.2183 | |||
| EMR / Emerson Electric Co. | 0.00 | -3.75 | 0.25 | -5.34 | 1.0950 | -0.0307 | |||
| JCI / Johnson Controls International plc | 0.00 | -3.91 | 0.25 | 13.36 | 1.0884 | 0.1587 | |||
| NOC / Northrop Grumman Corporation | 0.00 | -3.65 | 0.24 | 1.25 | 1.0726 | 0.0427 | |||
| ITW / Illinois Tool Works Inc. | 0.00 | -3.33 | 0.24 | -10.41 | 1.0651 | -0.0877 | |||
| CSX / CSX Corporation | 0.01 | -2.75 | 0.22 | -4.27 | 0.9908 | -0.0119 | |||
| CARR / Carrier Global Corporation | 0.00 | -5.87 | 0.21 | 3.41 | 0.9352 | 0.0569 | |||
| NSC / Norfolk Southern Corporation | 0.00 | -2.79 | 0.21 | -2.37 | 0.9106 | 0.0058 | |||
| AXON / Axon Enterprise, Inc. | 0.00 | -2.55 | 0.20 | 38.89 | 0.8831 | 0.2631 | |||
| RSG / Republic Services, Inc. | 0.00 | -3.10 | 0.19 | 4.92 | 0.8494 | 0.0650 | |||
| Repurchase Agreement / RA (000000000) | 0.19 | 0.8466 | 0.8466 | ||||||
| Repurchase Agreement / RA (000000000) | 0.19 | 0.8466 | 0.8466 | ||||||
| PAYX / Paychex, Inc. | 0.00 | -2.71 | 0.19 | 1.09 | 0.8234 | 0.0338 | |||
| PWR / Quanta Services, Inc. | 0.00 | -2.68 | 0.19 | 28.28 | 0.8229 | 0.2004 | |||
| PCAR / PACCAR Inc | 0.00 | -2.71 | 0.18 | -15.02 | 0.8004 | -0.1128 | |||
| FDX / FedEx Corporation | 0.00 | -4.10 | 0.18 | -20.54 | 0.7864 | -0.1738 | |||
| GWW / W.W. Grainger, Inc. | 0.00 | -2.38 | 0.18 | 4.09 | 0.7861 | 0.0516 | |||
| FAST / Fastenal Company | 0.00 | 94.75 | 0.17 | 6.10 | 0.7711 | 0.0666 | |||
| URI / United Rentals, Inc. | 0.00 | -3.21 | 0.17 | 6.92 | 0.7525 | 0.0677 | |||
| LHX / L3Harris Technologies, Inc. | 0.00 | -3.47 | 0.17 | 14.19 | 0.7485 | 0.1131 | |||
| CPRT / Copart, Inc. | 0.00 | -2.71 | 0.17 | -8.79 | 0.7343 | -0.0461 | |||
| Repurchase Agreement / RA (000000000) | 0.16 | 0.7256 | 0.7256 | ||||||
| VRSK / Verisk Analytics, Inc. | 0.00 | -2.80 | 0.16 | 2.52 | 0.7214 | 0.0400 | |||
| CMI / Cummins Inc. | 0.00 | -2.69 | 0.16 | -15.18 | 0.7184 | -0.1028 | |||
| AME / AMETEK, Inc. | 0.00 | -2.62 | 0.15 | -8.43 | 0.6728 | -0.0380 | |||
| OTIS / Otis Worldwide Corporation | 0.00 | -3.43 | 0.14 | -7.95 | 0.6149 | -0.0323 | |||
| ROK / Rockwell Automation, Inc. | 0.00 | -2.80 | 0.13 | 6.50 | 0.5800 | 0.0526 | |||
| WAB / Westinghouse Air Brake Technologies Corporation | 0.00 | -3.23 | 0.13 | 5.83 | 0.5618 | 0.0452 | |||
| IR / Ingersoll Rand Inc. | 0.00 | -2.75 | 0.12 | -6.20 | 0.5351 | -0.0199 | |||
| EFX / Equifax Inc. | 0.00 | -2.76 | 0.12 | 4.35 | 0.5333 | 0.0389 | |||
| DAL / Delta Air Lines, Inc. | 0.00 | -2.63 | 0.11 | -21.92 | 0.5051 | -0.1209 | |||
| XYL / Xylem Inc. | 0.00 | -2.71 | 0.11 | -6.67 | 0.4978 | -0.0183 | |||
| ODFL / Old Dominion Freight Line, Inc. | 0.00 | -2.67 | 0.11 | -12.00 | 0.4892 | -0.0488 | |||
| BR / Broadridge Financial Solutions, Inc. | 0.00 | -2.26 | 0.10 | -1.89 | 0.4624 | 0.0059 | |||
| UAL / United Airlines Holdings, Inc. | 0.00 | -2.65 | 0.10 | -17.24 | 0.4251 | -0.0757 | |||
| VLTO / Veralto Corporation | 0.00 | -2.77 | 0.09 | -1.08 | 0.4066 | 0.0055 | |||
| DOV / Dover Corporation | 0.00 | -2.88 | 0.09 | -13.59 | 0.3964 | -0.0469 | |||
| FTV / Fortive Corporation | 0.00 | -4.40 | 0.09 | -15.38 | 0.3895 | -0.0590 | |||
| HUBB / Hubbell Incorporated | 0.00 | -2.46 | 0.08 | 2.67 | 0.3400 | 0.0170 | |||
| LUV / Southwest Airlines Co. | 0.00 | -3.95 | 0.07 | 4.29 | 0.3218 | 0.0190 | |||
| LDOS / Leidos Holdings, Inc. | 0.00 | -4.54 | 0.07 | 9.23 | 0.3168 | 0.0347 | |||
| LII / Lennox International Inc. | 0.00 | -2.48 | 0.07 | -8.33 | 0.2936 | -0.0178 | |||
| SNA / Snap-on Incorporated | 0.00 | -3.02 | 0.06 | -8.96 | 0.2729 | -0.0178 | |||
| PNR / Pentair plc | 0.00 | -2.56 | 0.06 | 3.45 | 0.2667 | 0.0142 | |||
| ROL / Rollins, Inc. | 0.00 | -2.81 | 0.06 | 7.27 | 0.2614 | 0.0223 | |||
| EXPD / Expeditors International of Washington, Inc. | 0.00 | -2.45 | 0.06 | -6.45 | 0.2569 | -0.0094 | |||
| J / Jacobs Solutions Inc. | 0.00 | -4.24 | 0.06 | -5.00 | 0.2516 | -0.0073 | |||
| IEX / IDEX Corporation | 0.00 | -2.45 | 0.05 | -9.09 | 0.2225 | -0.0155 | |||
| TXT / Textron Inc. | 0.00 | -4.13 | 0.05 | -5.77 | 0.2199 | -0.0050 | |||
| MAS / Masco Corporation | 0.00 | -4.52 | 0.05 | -21.31 | 0.2151 | -0.0485 | |||
| ALLE / Allegion plc | 0.00 | -2.43 | 0.05 | 7.14 | 0.2019 | 0.0206 | |||
| BLDR / Builders FirstSource, Inc. | 0.00 | -2.97 | 0.05 | -25.00 | 0.2017 | -0.0589 | |||
| PAYC / Paycom Software, Inc. | 0.00 | -5.95 | 0.05 | 12.50 | 0.1987 | 0.0249 | |||
| NDSN / Nordson Corporation | 0.00 | -2.91 | 0.04 | -2.33 | 0.1869 | 0.0014 | |||
| CHRW / C.H. Robinson Worldwide, Inc. | 0.00 | -2.01 | 0.04 | -6.67 | 0.1853 | -0.0092 | |||
| JBHT / J.B. Hunt Transport Services, Inc. | 0.00 | -2.98 | 0.04 | -16.67 | 0.1793 | -0.0291 | |||
| SWK / Stanley Black & Decker, Inc. | 0.00 | -2.74 | 0.04 | -26.00 | 0.1641 | -0.0526 | |||
| Total Return Swap / DE (N/A) | 0.04 | 0.1547 | 0.1547 | ||||||
| DAY / Dayforce Inc. | 0.00 | -2.00 | 0.03 | -8.11 | 0.1529 | -0.0061 | |||
| HII / Huntington Ingalls Industries, Inc. | 0.00 | -2.04 | 0.03 | 28.00 | 0.1416 | 0.0311 | |||
| AOS / A. O. Smith Corporation | 0.00 | -3.54 | 0.03 | -6.67 | 0.1236 | -0.0051 | |||
| Repurchase Agreement / RA (000000000) | 0.03 | 0.1209 | 0.1209 | ||||||
| GNRC / Generac Holdings Inc. | 0.00 | -3.08 | 0.03 | -13.33 | 0.1184 | -0.0139 | |||
| Total Return Swap / DE (N/A) | 0.01 | 0.0604 | 0.0604 | ||||||
| Total Return Swap / DE (N/A) | 0.01 | 0.0466 | 0.0466 | ||||||
| AMTM / Amentum Holdings, Inc. | 0.00 | 0.00 | 0.0047 | 0.0047 |