Statistik Asas
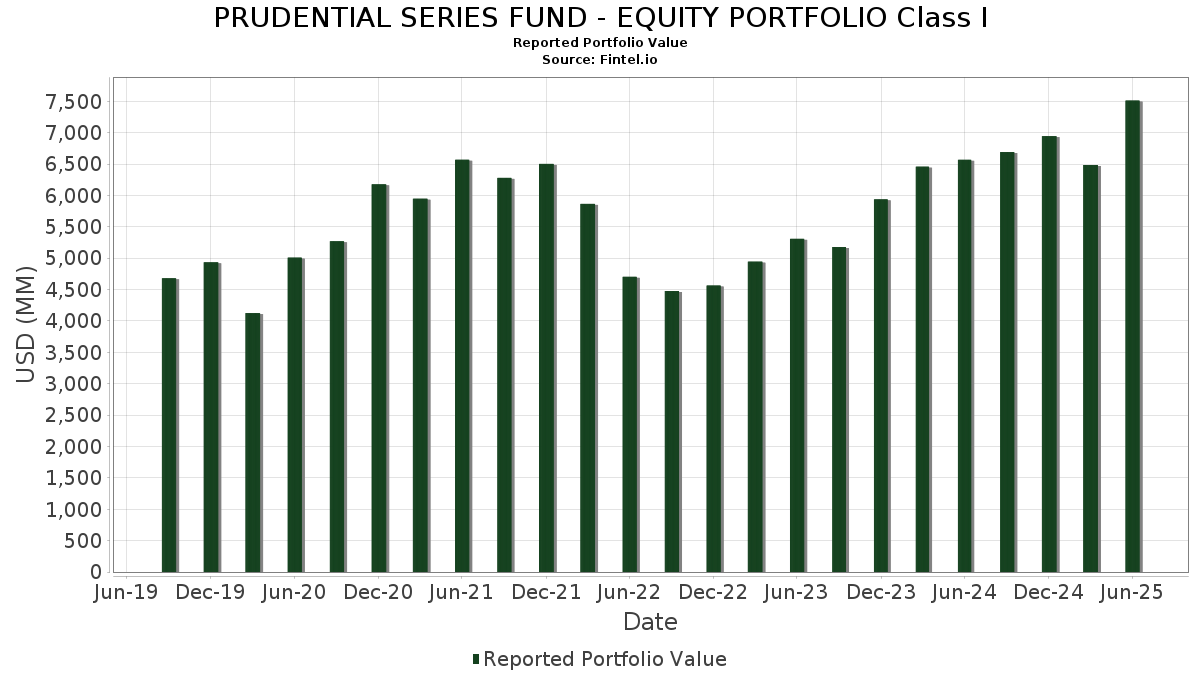
| Nilai Portfolio | $ 7,511,936,315 |
| Kedudukan Semasa | 96 |
Pegangan Terkini, Prestasi, AUM (dari 13F, 13D)
PRUDENTIAL SERIES FUND - EQUITY PORTFOLIO Class I telah mendedahkan 96 jumlah pegangan dalam pemfailan SEC terkini mereka. Nilai portfolio terkini dikira sebagai $ 7,511,936,315 USD. Aset Sebenar Di Bawah Pengurusan (AUM) ialah nilai ini ditambah dengan tunai (yang tidak didedahkan). Pegangan teratas PRUDENTIAL SERIES FUND - EQUITY PORTFOLIO Class I ialah Microsoft Corporation (US:MSFT) , NVIDIA Corporation (US:NVDA) , Apple Inc. (US:AAPL) , Alphabet Inc. (US:GOOGL) , and Meta Platforms, Inc. (US:META) . Kedudukan baharu PRUDENTIAL SERIES FUND - EQUITY PORTFOLIO Class I termasuk CVS Health Corporation (US:CVS) , GE Vernova Inc. (US:GEV) , The Southern Company (US:SO) , M&T Bank Corporation (US:MTB) , and Camden Property Trust (US:CPT) .
Kenaikan Teratas Suku Tahun Ini
Kami menggunakan perubahan dalam peruntukan portfolio kerana ini adalah metrik yang paling bermakna. Perubahan boleh disebabkan oleh perdagangan atau perubahan dalam harga saham.
| Sekuriti | Saham (MM) |
Nilai (MM$) |
Portfolio % | ΔPortfolio % |
|---|---|---|---|---|
| 1.78 | 122.63 | 1.6442 | 1.6442 | |
| 1.04 | 517.54 | 6.9392 | 1.5294 | |
| 3.04 | 480.39 | 6.4411 | 1.5263 | |
| 0.56 | 122.56 | 1.6433 | 1.1088 | |
| 5.84 | 80.07 | 1.0735 | 1.0735 | |
| 1.14 | 120.24 | 1.6122 | 0.8804 | |
| 0.41 | 299.83 | 4.0201 | 0.8147 | |
| 0.24 | 84.76 | 1.1365 | 0.7973 | |
| 0.11 | 56.39 | 0.7561 | 0.7561 | |
| 52.20 | 52.20 | 0.6999 | 0.6999 |
Penurunan Teratas Suku Tahun Ini
Kami menggunakan perubahan dalam peruntukan portfolio kerana ini adalah metrik yang paling bermakna. Perubahan boleh disebabkan oleh perdagangan atau perubahan dalam harga saham.
| Sekuriti | Saham (MM) |
Nilai (MM$) |
Portfolio % | ΔPortfolio % |
|---|---|---|---|---|
| 1.91 | 392.79 | 5.2665 | -3.1178 | |
| 0.15 | 18.01 | 0.2415 | -1.0709 | |
| 0.10 | 30.92 | 0.4146 | -0.7949 | |
| 0.47 | 66.72 | 0.8946 | -0.6729 | |
| 0.23 | 59.33 | 0.7954 | -0.5924 | |
| 0.12 | 37.28 | 0.4998 | -0.5518 | |
| 0.00 | 0.00 | -0.5440 | ||
| 1.41 | 137.44 | 1.8427 | -0.4935 | |
| 0.09 | 113.95 | 1.5279 | -0.4539 | |
| 0.01 | 1.45 | 0.0195 | -0.4230 |
13F dan Pemfailan Dana
Borang ini telah difailkan pada 2025-08-27 untuk tempoh pelaporan 2025-06-30. Klik ikon pautan untuk melihat sejarah transaksi penuh.
Tingkatkan untuk membuka data premium dan eksport ke Excel ![]() .
.
| Sekuriti | Jenis | Purata Harga Saham | Saham (MM) |
ΔSaham (%) |
ΔSaham (%) |
Nilai ($MM) |
Portfolio (%) |
ΔPortfolio (%) |
|
|---|---|---|---|---|---|---|---|---|---|
| MSFT / Microsoft Corporation | 1.04 | 14.72 | 517.54 | 52.01 | 6.9392 | 1.5294 | |||
| NVDA / NVIDIA Corporation | 3.04 | 6.54 | 480.39 | 55.30 | 6.4411 | 1.5263 | |||
| AAPL / Apple Inc. | 1.91 | -19.41 | 392.79 | -25.56 | 5.2665 | -3.1178 | |||
| GOOGL / Alphabet Inc. | 1.83 | 8.34 | 322.80 | 23.47 | 4.3282 | 0.1741 | |||
| META / Meta Platforms, Inc. | 0.41 | 16.06 | 299.83 | 48.62 | 4.0201 | 0.8147 | |||
| AMZN / Amazon.com, Inc. | 1.22 | -6.34 | 267.56 | 8.00 | 3.5874 | -0.3488 | |||
| AVGO / Broadcom Inc. | 0.60 | -14.45 | 164.73 | 40.85 | 2.2087 | 0.3504 | |||
| PNC / The PNC Financial Services Group, Inc. | 0.85 | 8.34 | 157.60 | 14.90 | 2.1131 | -0.0663 | |||
| JPM / JPMorgan Chase & Co. | 0.49 | 4.65 | 143.30 | 23.68 | 1.9214 | 0.0805 | |||
| WMT / Walmart Inc. | 1.41 | -16.08 | 137.44 | -6.53 | 1.8427 | -0.4935 | |||
| PH / Parker-Hannifin Corporation | 0.18 | 8.18 | 124.42 | 24.31 | 1.6683 | 0.0779 | |||
| CVS / CVS Health Corporation | 1.78 | 122.63 | 1.6442 | 1.6442 | |||||
| MMC / Marsh & McLennan Companies, Inc. | 0.56 | 230.84 | 122.56 | 240.55 | 1.6433 | 1.1088 | |||
| TYIA / Johnson Controls International plc | 1.14 | 64.44 | 120.24 | 226.42 | 1.6122 | 0.8804 | |||
| LNG / Cheniere Energy, Inc. | 0.48 | 73.89 | 117.76 | 83.00 | 1.5789 | 0.5564 | |||
| MET / MetLife, Inc. | 1.44 | 17.42 | 116.15 | 17.61 | 1.5574 | -0.0119 | |||
| CB / Chubb Limited | 0.40 | 6.06 | 115.89 | 1.75 | 1.5538 | -0.2558 | |||
| CSCO / Cisco Systems, Inc. | 1.66 | 8.34 | 114.95 | 21.81 | 1.5413 | 0.0418 | |||
| NFLX / Netflix, Inc. | 0.09 | -36.38 | 113.95 | -8.64 | 1.5279 | -0.4539 | |||
| AZN / AstraZeneca PLC - Depositary Receipt (Common Stock) | 1.55 | 16.32 | 108.05 | 10.60 | 1.4487 | -0.1036 | |||
| UL / Unilever PLC - Depositary Receipt (Common Stock) | 1.67 | -0.10 | 102.14 | 2.61 | 1.3695 | -0.2121 | |||
| UBER / Uber Technologies, Inc. | 1.06 | 63.78 | 98.66 | 109.73 | 1.3229 | 0.5754 | |||
| COST / Costco Wholesale Corporation | 0.10 | 5.25 | 96.51 | 10.16 | 1.2940 | -0.0980 | |||
| NI / NiSource Inc. | 2.38 | 26.24 | 96.14 | 27.03 | 1.2890 | 0.0865 | |||
| ADBE / Adobe Inc. | 0.25 | 46.63 | 95.46 | 12.42 | 1.2799 | -0.0695 | |||
| AMGN / Amgen Inc. | 0.33 | 16.02 | 92.62 | 13.93 | 1.2418 | -0.0501 | |||
| PGR / The Progressive Corporation | 0.32 | 4.89 | 85.98 | -1.10 | 1.1528 | -0.2284 | |||
| APP / AppLovin Corporation | 0.24 | 200.50 | 84.76 | 297.03 | 1.1365 | 0.7973 | |||
| T / AT&T Inc. | 2.86 | 7.83 | 82.80 | 10.35 | 1.1102 | -0.0821 | |||
| TSM / Taiwan Semiconductor Manufacturing Company Limited - Depositary Receipt (Common Stock) | 0.36 | 0.31 | 81.29 | 36.86 | 1.0900 | 0.1462 | |||
| TSLA / Tesla, Inc. | 0.25 | 12.23 | 80.79 | 37.56 | 1.0833 | 0.1501 | |||
| M1Z / Nu Holdings Ltd. | 5.84 | 80.07 | 1.0735 | 1.0735 | |||||
| TOST / Toast, Inc. | 1.69 | 54.40 | 74.76 | 106.16 | 1.0024 | 0.4262 | |||
| DIS / The Walt Disney Company | 0.54 | 0.44 | 67.26 | 26.19 | 0.9018 | 0.0550 | |||
| CVX / Chevron Corporation | 0.47 | -20.99 | 66.72 | -32.37 | 0.8946 | -0.6729 | |||
| GE / General Electric Company | 0.23 | -47.18 | 59.33 | -32.08 | 0.7954 | -0.5924 | |||
| BA / The Boeing Company | 0.28 | 3.59 | 58.28 | 27.27 | 0.7814 | 0.0538 | |||
| GEV / GE Vernova Inc. | 0.11 | 56.39 | 0.7561 | 0.7561 | |||||
| RL / Ralph Lauren Corporation | 0.20 | -4.68 | 56.03 | 18.44 | 0.7513 | -0.0004 | |||
| CAT / Caterpillar Inc. | 0.14 | -6.29 | 55.78 | 10.30 | 0.7479 | -0.0556 | |||
| CCK / Crown Holdings, Inc. | 0.54 | 39.40 | 55.36 | 60.83 | 0.7423 | 0.1953 | |||
| MMM / 3M Company | 0.36 | 8.35 | 54.15 | 12.32 | 0.7260 | -0.0400 | |||
| MKL / Markel Group Inc. | 0.03 | 0.37 | 53.48 | 7.23 | 0.7170 | -0.0754 | |||
| LOW / Lowe's Companies, Inc. | 0.24 | 39.50 | 52.96 | 32.70 | 0.7100 | 0.0760 | |||
| (PIPA070) PGIM Core Government Money Market Fund / STIV (000000000) | 52.20 | 52.20 | 0.6999 | 0.6999 | |||||
| VRTX / Vertex Pharmaceuticals Incorporated | 0.11 | 50.90 | 0.6825 | 0.6825 | |||||
| VST / Vistra Corp. | 0.26 | -2.21 | 50.53 | 61.38 | 0.6775 | 0.1800 | |||
| SO / The Southern Company | 0.54 | 49.80 | 0.6677 | 0.6677 | |||||
| CDNS / Cadence Design Systems, Inc. | 0.16 | -21.10 | 48.66 | 3.77 | 0.6524 | -0.2791 | |||
| ABT / Abbott Laboratories | 0.35 | 3.21 | 47.69 | 5.82 | 0.6395 | -0.0766 | |||
| PGIM Institutional Money Market Fund - D / STIV (000000000) | 47.34 | 47.31 | 0.6343 | 0.6343 | |||||
| WMB / The Williams Companies, Inc. | 0.75 | 10.76 | 47.29 | 16.41 | 0.6340 | -0.0114 | |||
| SHEL / Shell plc - Depositary Receipt (Common Stock) | 0.65 | -19.95 | 45.83 | -23.09 | 0.6145 | -0.3323 | |||
| V / Visa Inc. | 0.13 | 8.64 | 44.92 | 10.06 | 0.6023 | -0.0462 | |||
| LLY / Eli Lilly and Company | 0.06 | -3.97 | 44.66 | -9.36 | 0.5988 | -0.1841 | |||
| PLD / Prologis, Inc. | 0.42 | 8.35 | 44.14 | 1.88 | 0.5918 | -0.0965 | |||
| PG / The Procter & Gamble Company | 0.27 | 8.35 | 43.73 | 1.30 | 0.5863 | -0.0996 | |||
| XOM / Exxon Mobil Corporation | 0.40 | 8.34 | 43.14 | -1.80 | 0.5784 | -0.1196 | |||
| MTB / M&T Bank Corporation | 0.21 | 41.21 | 0.5526 | 0.5526 | |||||
| GS / The Goldman Sachs Group, Inc. | 0.05 | -43.89 | 38.86 | -27.31 | 0.5210 | -0.3283 | |||
| MELI / MercadoLibre, Inc. | 0.01 | -47.67 | 38.70 | -33.35 | 0.5189 | -0.3621 | |||
| EHC / Encompass Health Corporation | 0.31 | 2.65 | 38.45 | 24.29 | 0.5155 | 0.0240 | |||
| ALSN / Allison Transmission Holdings, Inc. | 0.40 | 141.09 | 38.03 | 139.38 | 0.5099 | 0.2575 | |||
| UNH / UnitedHealth Group Incorporated | 0.12 | -5.44 | 37.28 | -43.67 | 0.4998 | -0.5518 | |||
| SPF / Spotify Technology S.A. | 0.05 | -7.55 | 37.28 | 28.98 | 0.4998 | 0.0406 | |||
| GLPI / Gaming and Leisure Properties, Inc. | 0.77 | 47.41 | 36.16 | 35.19 | 0.4849 | 0.0598 | |||
| CPT / Camden Property Trust | 0.31 | 35.47 | 0.4755 | 0.4755 | |||||
| LRCX / Lam Research Corporation | 0.36 | -1.43 | 34.76 | 31.98 | 0.4660 | 0.0476 | |||
| CNP / CenterPoint Energy, Inc. | 0.94 | 34.55 | 0.4632 | 0.4632 | |||||
| HLI / Houlihan Lokey, Inc. | 0.19 | 88.06 | 33.76 | 109.55 | 0.4527 | 0.1967 | |||
| EWBC / East West Bancorp, Inc. | 0.32 | 8.36 | 32.26 | 21.90 | 0.4326 | 0.0121 | |||
| LOAR / Loar Holdings Inc. | 0.36 | 31.34 | 0.4203 | 0.4203 | |||||
| IBM / International Business Machines Corporation | 0.10 | -65.73 | 30.92 | -59.38 | 0.4146 | -0.7949 | |||
| AXV / AXIS Capital Holdings Limited | 0.30 | 8.34 | 30.92 | 12.22 | 0.4146 | -0.0232 | |||
| APO / Apollo Global Management, Inc. | 0.20 | -25.00 | 28.04 | -35.57 | 0.3760 | -0.2704 | |||
| MA / Mastercard Incorporated | 0.04 | 11.77 | 25.17 | 14.59 | 0.3375 | -0.0115 | |||
| WTFC / Wintrust Financial Corporation | 0.20 | 0.98 | 25.17 | 11.32 | 0.3374 | -0.0218 | |||
| GTES / Gates Industrial Corporation plc | 1.06 | -9.50 | 24.49 | 13.22 | 0.3284 | -0.0153 | |||
| RBLX / Roblox Corporation | 0.23 | 23.99 | 0.3217 | 0.3217 | |||||
| GLW / Corning Incorporated | 0.45 | 6.92 | 23.83 | 22.83 | 0.3195 | 0.0112 | |||
| CUZ / Cousins Properties Incorporated | 0.77 | 23.18 | 0.3108 | 0.3108 | |||||
| CNM / Core & Main, Inc. | 0.38 | 8.34 | 22.88 | 35.34 | 0.3068 | 0.0382 | |||
| FTI / TechnipFMC plc | 0.64 | -23.39 | 22.21 | -16.74 | 0.2978 | -0.1261 | |||
| GNRC / Generac Holdings Inc. | 0.15 | -39.42 | 21.23 | -31.50 | 0.2847 | -0.2078 | |||
| DOCU / DocuSign, Inc. | 0.27 | 29.64 | 20.75 | 24.05 | 0.2782 | 0.0124 | |||
| ELAN / Elanco Animal Health Incorporated | 1.41 | 20.13 | 0.2698 | 0.2698 | |||||
| HAS / Hasbro, Inc. | 0.27 | 1.28 | 19.82 | 21.60 | 0.2658 | 0.0068 | |||
| RNR / RenaissanceRe Holdings Ltd. | 0.08 | 9.71 | 19.70 | 11.04 | 0.2641 | -0.0178 | |||
| PNFP / Pinnacle Financial Partners, Inc. | 0.18 | 13.63 | 19.58 | 18.32 | 0.2626 | -0.0004 | |||
| ORCL / Oracle Corporation | 0.08 | -26.74 | 18.46 | 14.57 | 0.2475 | -0.0085 | |||
| AME / AMETEK, Inc. | 0.10 | 11.23 | 18.35 | 16.92 | 0.2460 | -0.0033 | |||
| BROS / Dutch Bros Inc. | 0.27 | 18.27 | 0.2449 | 0.2449 | |||||
| ABBV / AbbVie Inc. | 0.10 | 19.20 | 18.18 | 5.60 | 0.2438 | -0.0298 | |||
| TJX / The TJX Companies, Inc. | 0.15 | -78.49 | 18.01 | -78.19 | 0.2415 | -1.0709 | |||
| KEX / Kirby Corporation | 0.01 | -95.36 | 1.45 | -94.79 | 0.0195 | -0.4230 | |||
| PLATMIN LTD / EC (000000000) | 0.13 | 0.00 | 0.0000 | 0.0000 | |||||
| PODD / Insulet Corporation | 0.00 | -100.00 | 0.00 | -100.00 | -0.3889 | ||||
| WCC / WESCO International, Inc. | 0.00 | -100.00 | 0.00 | -100.00 | -0.2517 | ||||
| MRVL / Marvell Technology, Inc. | 0.00 | -100.00 | 0.00 | -100.00 | -0.5440 | ||||
| SN / SharkNinja, Inc. | 0.00 | -100.00 | 0.00 | -100.00 | -0.2449 |