Statistik Asas
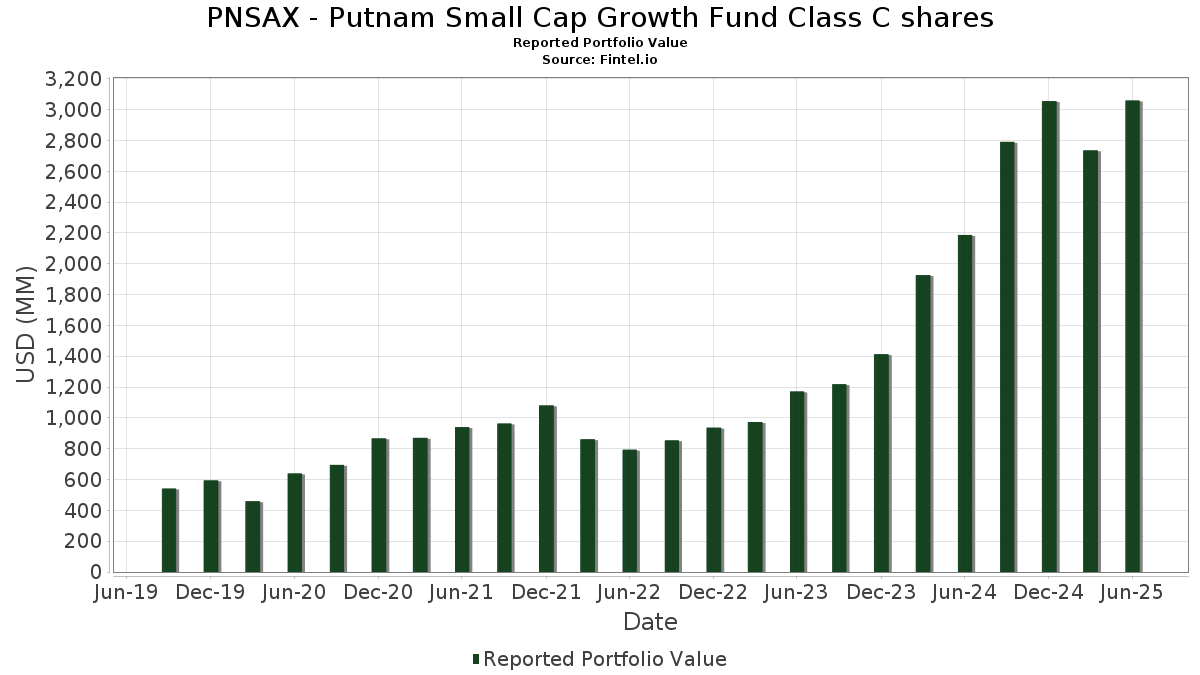
| Nilai Portfolio | $ 3,058,332,645 |
| Kedudukan Semasa | 102 |
Pegangan Terkini, Prestasi, AUM (dari 13F, 13D)
PNSAX - Putnam Small Cap Growth Fund Class C shares telah mendedahkan 102 jumlah pegangan dalam pemfailan SEC terkini mereka. Nilai portfolio terkini dikira sebagai $ 3,058,332,645 USD. Aset Sebenar Di Bawah Pengurusan (AUM) ialah nilai ini ditambah dengan tunai (yang tidak didedahkan). Pegangan teratas PNSAX - Putnam Small Cap Growth Fund Class C shares ialah Carpenter Technology Corporation (US:CRS) , Encompass Health Corporation (US:EHC) , Nova Ltd. (US:NVMI) , Comfort Systems USA, Inc. (US:FIX) , and Verona Pharma plc - Depositary Receipt (Common Stock) (US:VRNA) . Kedudukan baharu PNSAX - Putnam Small Cap Growth Fund Class C shares termasuk Advanced Energy Industries, Inc. (US:AEIS) , Adtalem Global Education Inc. (US:ATGE) , Doximity, Inc. (US:DOCS) , Enova International, Inc. (US:ENVA) , and GeneDx Holdings Corp. (US:WGS) .
Kenaikan Teratas Suku Tahun Ini
Kami menggunakan perubahan dalam peruntukan portfolio kerana ini adalah metrik yang paling bermakna. Perubahan boleh disebabkan oleh perdagangan atau perubahan dalam harga saham.
| Sekuriti | Saham (MM) |
Nilai (MM$) |
Portfolio % | ΔPortfolio % |
|---|---|---|---|---|
| 0.71 | 67.00 | 2.3173 | 2.2332 | |
| 164.68 | 164.68 | 5.6952 | 1.8785 | |
| 0.16 | 21.37 | 0.7390 | 0.7390 | |
| 0.38 | 35.32 | 1.2214 | 0.7241 | |
| 0.25 | 68.72 | 2.3765 | 0.6920 | |
| 0.16 | 19.84 | 0.6862 | 0.6862 | |
| 0.13 | 67.79 | 2.3444 | 0.6840 | |
| 0.31 | 19.07 | 0.6596 | 0.6596 | |
| 0.16 | 17.95 | 0.6207 | 0.6207 | |
| 0.93 | 42.99 | 1.4868 | 0.6018 |
Penurunan Teratas Suku Tahun Ini
Kami menggunakan perubahan dalam peruntukan portfolio kerana ini adalah metrik yang paling bermakna. Perubahan boleh disebabkan oleh perdagangan atau perubahan dalam harga saham.
| Sekuriti | Saham (MM) |
Nilai (MM$) |
Portfolio % | ΔPortfolio % |
|---|---|---|---|---|
| 0.03 | 2.43 | 0.0841 | -1.6354 | |
| 0.01 | 1.85 | 0.0640 | -1.3321 | |
| 0.50 | 29.11 | 1.0068 | -1.0488 | |
| 0.07 | 14.33 | 0.4955 | -0.9970 | |
| 0.53 | 27.67 | 0.9571 | -0.6856 | |
| 0.12 | 28.89 | 0.9993 | -0.5989 | |
| 0.03 | 4.06 | 0.1406 | -0.5970 | |
| 0.18 | 42.81 | 1.4806 | -0.5252 | |
| 1.02 | 47.04 | 1.6270 | -0.5173 | |
| 0.61 | 57.30 | 1.9818 | -0.5061 |
13F dan Pemfailan Dana
Borang ini telah difailkan pada 2025-08-26 untuk tempoh pelaporan 2025-06-30. Klik ikon pautan untuk melihat sejarah transaksi penuh.
Tingkatkan untuk membuka data premium dan eksport ke Excel ![]() .
.
| Sekuriti | Jenis | Purata Harga Saham | Saham (MM) |
ΔSaham (%) |
ΔSaham (%) |
Nilai ($MM) |
Portfolio (%) |
ΔPortfolio (%) |
|
|---|---|---|---|---|---|---|---|---|---|
| Putnam Cash Collateral Pool LLC / STIV (99311N9A5) | 164.68 | 64.02 | 164.68 | 64.02 | 5.6952 | 1.8785 | |||
| CRS / Carpenter Technology Corporation | 0.26 | -12.63 | 73.05 | 33.27 | 2.5264 | 0.4428 | |||
| EHC / Encompass Health Corporation | 0.58 | -5.45 | 71.70 | 14.48 | 2.4798 | 0.0989 | |||
| NVMI / Nova Ltd. | 0.25 | 3.87 | 68.72 | 55.07 | 2.3765 | 0.6920 | |||
| FIX / Comfort Systems USA, Inc. | 0.13 | -6.70 | 67.79 | 55.21 | 2.3444 | 0.6840 | |||
| VRNA / Verona Pharma plc - Depositary Receipt (Common Stock) | 0.71 | 2,656.54 | 67.00 | 2,657.33 | 2.3173 | 2.2332 | |||
| HURN / Huron Consulting Group Inc. | 0.42 | -2.22 | 57.71 | -6.25 | 1.9958 | -0.3442 | |||
| MMSI / Merit Medical Systems, Inc. | 0.61 | -0.99 | 57.30 | -12.44 | 1.9818 | -0.5061 | |||
| RBC / RBC Bearings Incorporated | 0.14 | -1.11 | 55.15 | 18.26 | 1.9073 | 0.1345 | |||
| DSGX / The Descartes Systems Group Inc. | 0.54 | -2.41 | 54.42 | -1.62 | 1.8821 | -0.2207 | |||
| ENSG / The Ensign Group, Inc. | 0.35 | -5.57 | 53.59 | 12.57 | 1.8534 | 0.0436 | |||
| SKWD / Skyward Specialty Insurance Group, Inc. | 0.92 | -7.04 | 53.45 | 1.52 | 1.8485 | -0.1530 | |||
| ITRI / Itron, Inc. | 0.40 | 3.49 | 52.34 | 30.03 | 1.8100 | 0.2800 | |||
| VERX / Vertex, Inc. | 1.44 | 1.05 | 50.73 | 1.99 | 1.7543 | -0.1364 | |||
| TXRH / Texas Roadhouse, Inc. | 0.25 | 1.28 | 47.55 | 13.91 | 1.6444 | 0.0576 | |||
| KEX / Kirby Corporation | 0.42 | 16.79 | 47.55 | 31.13 | 1.6444 | 0.2660 | |||
| US74676P6640 / SHORT TERM INV FUND | 47.09 | -8.49 | 47.09 | -8.49 | 1.6285 | -0.3276 | |||
| ACIW / ACI Worldwide, Inc. | 1.02 | -0.61 | 47.04 | -16.60 | 1.6270 | -0.5173 | |||
| CWST / Casella Waste Systems, Inc. | 0.41 | -7.32 | 46.85 | -4.10 | 1.6203 | -0.2368 | |||
| VSEC / VSE Corporation | 0.34 | -1.59 | 44.21 | 7.43 | 1.5291 | -0.0355 | |||
| FSS / Federal Signal Corporation | 0.41 | -5.17 | 44.12 | 37.21 | 1.5259 | 0.3035 | |||
| KNSL / Kinsale Capital Group, Inc. | 0.09 | -1.85 | 43.67 | -2.42 | 1.5104 | -0.1909 | |||
| STEP / StepStone Group Inc. | 0.78 | -0.23 | 43.55 | 6.02 | 1.5060 | -0.0554 | |||
| KTOS / Kratos Defense & Security Solutions, Inc. | 0.93 | 18.04 | 42.99 | 84.68 | 1.4868 | 0.6018 | |||
| AIT / Applied Industrial Technologies, Inc. | 0.18 | -21.34 | 42.81 | -18.86 | 1.4806 | -0.5252 | |||
| MUSA / Murphy USA Inc. | 0.10 | -2.35 | 41.99 | -15.45 | 1.4521 | -0.4356 | |||
| LRN / Stride, Inc. | 0.28 | 44.41 | 40.89 | 65.75 | 1.4140 | 0.4763 | |||
| TBBK / The Bancorp, Inc. | 0.71 | -9.52 | 40.27 | -2.45 | 1.3927 | -0.1766 | |||
| KNF / Knife River Corporation | 0.47 | -0.17 | 38.46 | -9.65 | 1.3301 | -0.2881 | |||
| INSM / Insmed Incorporated | 0.37 | -6.99 | 37.35 | 22.70 | 1.2917 | 0.1345 | |||
| DY / Dycom Industries, Inc. | 0.15 | -4.89 | 36.24 | 52.59 | 1.2533 | 0.3505 | |||
| QTWO / Q2 Holdings, Inc. | 0.38 | 18.33 | 35.73 | 38.42 | 1.2356 | 0.2544 | |||
| CRDO / Credo Technology Group Holding Ltd | 0.38 | 17.08 | 35.32 | 169.93 | 1.2214 | 0.7241 | |||
| SPXC / SPX Technologies, Inc. | 0.21 | 4.35 | 34.92 | 35.87 | 1.2078 | 0.2307 | |||
| ROAD / Construction Partners, Inc. | 0.33 | 11.06 | 34.79 | 64.24 | 1.2030 | 0.3979 | |||
| ADMA / ADMA Biologics, Inc. | 1.75 | 39.66 | 31.78 | 28.19 | 1.0990 | 0.1566 | |||
| PEGA / Pegasystems Inc. | 0.59 | 108.84 | 31.73 | 62.61 | 1.0974 | 0.3556 | |||
| FN / Fabrinet | 0.11 | -1.21 | 31.15 | 47.39 | 1.0772 | 0.2738 | |||
| CAMT / Camtek Ltd. | 0.36 | 0.67 | 30.65 | 45.19 | 1.0600 | 0.2575 | |||
| BOOT / Boot Barn Holdings, Inc. | 0.20 | -20.69 | 30.41 | 12.21 | 1.0516 | 0.0215 | |||
| IESC / IES Holdings, Inc. | 0.10 | -8.64 | 29.91 | 63.92 | 1.0343 | 0.3407 | |||
| AGYS / Agilysys, Inc. | 0.26 | 0.70 | 29.68 | 59.15 | 1.0265 | 0.3175 | |||
| PLNT / Planet Fitness, Inc. | 0.27 | 35.44 | 29.51 | 52.88 | 1.0206 | 0.2868 | |||
| FSV / FirstService Corporation | 0.17 | -1.29 | 29.47 | 3.88 | 1.0193 | -0.0592 | |||
| VRRM / Verra Mobility Corporation | 1.16 | -4.47 | 29.42 | 7.75 | 1.0174 | -0.0204 | |||
| BRBR / BellRing Brands, Inc. | 0.50 | -30.80 | 29.11 | -46.16 | 1.0068 | -1.0488 | |||
| CLH / Clean Harbors, Inc. | 0.12 | -41.41 | 28.89 | -31.27 | 0.9993 | -0.5989 | |||
| DRS / Leonardo DRS, Inc. | 0.61 | -11.98 | 28.49 | 24.42 | 0.9852 | 0.1148 | |||
| CR / Crane Company | 0.15 | 91.81 | 28.34 | 137.78 | 0.9800 | 0.5270 | |||
| IBP / Installed Building Products, Inc. | 0.16 | -6.51 | 28.22 | -1.68 | 0.9760 | -0.1151 | |||
| HALO / Halozyme Therapeutics, Inc. | 0.53 | -21.44 | 27.67 | -35.96 | 0.9571 | -0.6856 | |||
| ITGR / Integer Holdings Corporation | 0.22 | 11.68 | 26.46 | 16.37 | 0.9152 | 0.0507 | |||
| ATZ / Aritzia Inc. | 0.50 | -6.12 | 26.05 | 38.37 | 0.9009 | 0.1853 | |||
| UFPT / UFP Technologies, Inc. | 0.11 | -8.80 | 25.70 | 10.39 | 0.8887 | 0.0038 | |||
| CVLT / Commvault Systems, Inc. | 0.14 | 36.60 | 25.24 | 50.95 | 0.8730 | 0.2373 | |||
| CIGI / Colliers International Group Inc. | 0.19 | -12.55 | 24.67 | -5.45 | 0.8531 | -0.1387 | |||
| AEIS / Advanced Energy Industries, Inc. | 0.16 | 21.37 | 0.7390 | 0.7390 | |||||
| RKLB / Rocket Lab Corporation | 0.60 | -19.26 | 21.36 | 61.52 | 0.7387 | 0.2360 | |||
| CSW / CSW Industrials, Inc. | 0.07 | -21.69 | 21.14 | -22.95 | 0.7312 | -0.3119 | |||
| PSN / Parsons Corporation | 0.29 | -29.52 | 20.94 | -14.57 | 0.7244 | -0.2076 | |||
| FTAI / FTAI Aviation Ltd. | 0.18 | -38.26 | 20.35 | -36.03 | 0.7038 | -0.5055 | |||
| HIMS / Hims & Hers Health, Inc. | 0.41 | 41.82 | 20.23 | 139.26 | 0.6998 | 0.3783 | |||
| AXSM / Axsome Therapeutics, Inc. | 0.19 | 2.13 | 20.06 | -8.59 | 0.6939 | -0.1405 | |||
| ATGE / Adtalem Global Education Inc. | 0.16 | 19.84 | 0.6862 | 0.6862 | |||||
| AROC / Archrock, Inc. | 0.78 | 47.71 | 19.35 | 39.78 | 0.6691 | 0.1429 | |||
| MEDP / Medpace Holdings, Inc. | 0.06 | -22.19 | 19.34 | -19.85 | 0.6689 | -0.2485 | |||
| RDNT / RadNet, Inc. | 0.34 | -0.96 | 19.15 | 13.37 | 0.6622 | 0.0201 | |||
| COOP / Mr. Cooper Group Inc. | 0.13 | 37.66 | 19.14 | 71.75 | 0.6621 | 0.2383 | |||
| DOCS / Doximity, Inc. | 0.31 | 19.07 | 0.6596 | 0.6596 | |||||
| ASND / Ascendis Pharma A/S - Depositary Receipt (Common Stock) | 0.11 | 1.72 | 18.57 | 12.65 | 0.6424 | 0.0155 | |||
| ENVA / Enova International, Inc. | 0.16 | 17.95 | 0.6207 | 0.6207 | |||||
| RYTM / Rhythm Pharmaceuticals, Inc. | 0.28 | -2.27 | 17.41 | 16.58 | 0.6021 | 0.0344 | |||
| OLLI / Ollie's Bargain Outlet Holdings, Inc. | 0.13 | 17.08 | 0.5908 | 0.5908 | |||||
| PATK / Patrick Industries, Inc. | 0.18 | -0.92 | 16.88 | 8.12 | 0.5838 | -0.0097 | |||
| CEU / CES Energy Solutions Corp. | 3.32 | -10.81 | 16.18 | -15.56 | 0.5595 | -0.1687 | |||
| PWP / Perella Weinberg Partners | 0.81 | -1.94 | 15.70 | 3.50 | 0.5429 | -0.0337 | |||
| CWAN / Clearwater Analytics Holdings, Inc. | 0.71 | -5.10 | 15.56 | -22.35 | 0.5383 | -0.2237 | |||
| LNTH / Lantheus Holdings, Inc. | 0.19 | -32.29 | 15.17 | -43.20 | 0.5245 | -0.4906 | |||
| RMBS / Rambus Inc. | 0.23 | -4.77 | 14.69 | 17.75 | 0.5079 | 0.0338 | |||
| EXP / Eagle Materials Inc. | 0.07 | -59.93 | 14.33 | -63.51 | 0.4955 | -0.9970 | |||
| BJ / BJ's Wholesale Club Holdings, Inc. | 0.13 | 14.02 | 0.4848 | 0.4848 | |||||
| INTA / Intapp, Inc. | 0.27 | -22.63 | 13.98 | -31.59 | 0.4836 | -0.2935 | |||
| PRCT / PROCEPT BioRobotics Corporation | 0.23 | 3.62 | 13.18 | 2.45 | 0.4560 | -0.0332 | |||
| BPMC / Blueprint Medicines Corporation | 0.10 | 22.66 | 12.28 | 77.63 | 0.4247 | 0.1619 | |||
| WGS / GeneDx Holdings Corp. | 0.13 | 11.79 | 0.4078 | 0.4078 | |||||
| SITM / SiTime Corporation | 0.06 | 11.73 | 0.4058 | 0.4058 | |||||
| AVPT / AvePoint, Inc. | 0.60 | 11.62 | 0.4019 | 0.4019 | |||||
| MDGL / Madrigal Pharmaceuticals, Inc. | 0.04 | 11.58 | 0.4005 | 0.4005 | |||||
| GRND / Grindr Inc. | 0.47 | 10.73 | 0.3710 | 0.3710 | |||||
| LEU / Centrus Energy Corp. | 0.06 | 10.32 | 0.3569 | 0.3569 | |||||
| VCEL / Vericel Corporation | 0.21 | 0.00 | 8.95 | -4.64 | 0.3095 | -0.0472 | |||
| MIR / Mirion Technologies, Inc. | 0.40 | 8.63 | 0.2986 | 0.2986 | |||||
| BBIO / BridgeBio Pharma, Inc. | 0.19 | 8.30 | 0.2869 | 0.2869 | |||||
| XENE / Xenon Pharmaceuticals Inc. | 0.26 | 32.95 | 8.14 | 24.04 | 0.2814 | 0.0320 | |||
| VRNS / Varonis Systems, Inc. | 0.14 | 117.32 | 7.17 | 276.27 | 0.2479 | -0.0272 | |||
| EAT / Brinker International, Inc. | 0.04 | 348.86 | 7.14 | 2,116.15 | 0.2468 | 0.2172 | |||
| LOAR / Loar Holdings Inc. | 0.07 | 5.76 | 0.1991 | 0.1991 | |||||
| CBZ / CBIZ, Inc. | 0.08 | 5.40 | 0.1867 | 0.1867 | |||||
| BMI / Badger Meter, Inc. | 0.02 | 4.87 | 0.1685 | 0.1685 | |||||
| JBTM / JBT Marel Corporation | 0.03 | -27.00 | 4.06 | -42.83 | 0.1406 | -0.5970 | |||
| VRNA / Verona Pharma plc - Depositary Receipt (Common Stock) | 0.03 | -96.39 | 2.43 | -94.63 | 0.0841 | -1.6354 | |||
| SFM / Sprouts Farmers Market, Inc. | 0.01 | -95.33 | 1.85 | -94.96 | 0.0640 | -1.3321 | |||
| SWTX / SpringWorks Therapeutics, Inc. | 0.00 | -100.00 | 0.00 | -100.00 | -0.2446 |