Statistik Asas
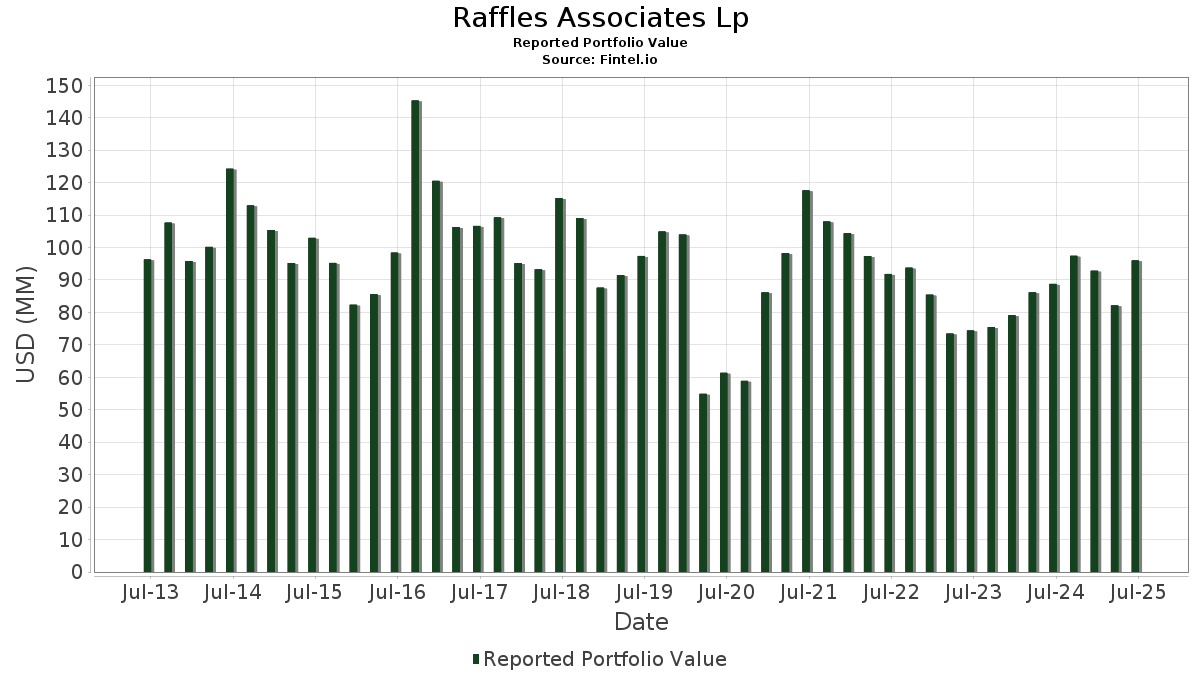
| Nilai Portfolio | $ 95,997,354 |
| Kedudukan Semasa | 48 |
Pegangan Terkini, Prestasi, AUM (dari 13F, 13D)
Raffles Associates Lp telah mendedahkan 48 jumlah pegangan dalam pemfailan SEC terkini mereka. Nilai portfolio terkini dikira sebagai $ 95,997,354 USD. Aset Sebenar Di Bawah Pengurusan (AUM) ialah nilai ini ditambah dengan tunai (yang tidak didedahkan). Pegangan teratas Raffles Associates Lp ialah Southern Missouri Bancorp, Inc. (US:SMBC) , Ivanhoe Electric Inc. (US:IE) , Provident Financial Holdings, Inc. (US:PROV) , Eastern Bankshares, Inc. (US:EBC) , and OFG Bancorp (US:OFG) . Kedudukan baharu Raffles Associates Lp termasuk ProShares Trust II - ProShares UltraShort Gold (US:GLL) , Marathon Bancorp, Inc. (US:MBBC) , The Hain Celestial Group, Inc. (US:HAIN) , i-80 Gold Corp. (US:IAUX) , and Harte Hanks, Inc. (US:HHS) . Industri teratas Raffles Associates Lp ialah "Chemicals And Allied Products" (sic 28) , "Holding And Other Investment Offices" (sic 67) , and "Measuring, Analyzing, And Controlling Instruments; Photographic, Medical And Optical Goods; Watches And Clocks" (sic 38) .
Kenaikan Teratas Suku Tahun Ini
Kami menggunakan perubahan dalam peruntukan portfolio kerana ini adalah metrik yang paling bermakna. Perubahan boleh disebabkan oleh perdagangan atau perubahan dalam harga saham.
| Sekuriti | Saham (MM) |
Nilai (MM$) |
Portfolio % | ΔPortfolio % |
|---|---|---|---|---|
| 0.16 | 4.30 | 4.4801 | 4.4801 | |
| 0.12 | 2.56 | 2.6666 | 2.6666 | |
| 5.39 | 4.89 | 5.0968 | 1.9940 | |
| 0.96 | 8.67 | 9.0332 | 1.3489 | |
| 0.11 | 1.07 | 1.1170 | 1.1170 | |
| 0.05 | 0.94 | 0.9766 | 0.9766 | |
| 0.29 | 2.01 | 2.0965 | 0.4288 | |
| 1.69 | 4.97 | 5.1727 | 0.4208 | |
| 0.07 | 1.39 | 1.4490 | 0.4066 | |
| 0.03 | 0.56 | 0.5793 | 0.3342 |
Penurunan Teratas Suku Tahun Ini
Kami menggunakan perubahan dalam peruntukan portfolio kerana ini adalah metrik yang paling bermakna. Perubahan boleh disebabkan oleh perdagangan atau perubahan dalam harga saham.
| Sekuriti | Saham (MM) |
Nilai (MM$) |
Portfolio % | ΔPortfolio % |
|---|---|---|---|---|
| 0.36 | 5.49 | 5.7230 | -1.4624 | |
| 0.23 | 12.56 | 13.0819 | -1.4407 | |
| 0.48 | 2.91 | 3.0364 | -1.1137 | |
| 0.14 | 1.34 | 1.3943 | -1.1126 | |
| 0.40 | 2.78 | 2.8986 | -0.6714 | |
| 0.39 | 6.07 | 6.3260 | -0.6640 | |
| 0.12 | 5.14 | 5.3531 | -0.4983 | |
| 0.20 | 3.66 | 3.8126 | -0.4941 | |
| 0.12 | 2.08 | 2.1680 | -0.4192 | |
| 9.51 | 1.87 | 1.9493 | -0.3897 |
Pemfailan 13D/G
Ini ialah senarai pemfailan 13D dan 13G yang dibuat pada tahun lepas (jika ada). Klik ikon pautan untuk melihat sejarah transaksi penuh. Baris hijau menunjukkan kedudukan baharu. Baris merah menunjukkan kedudukan tertutup.
| Tarikh Fail | Borang | Sekuriti | Saham Terdahulu |
Saham Semasa |
ΔSaham % | % Pemilikan |
% ΔPemilikan | |
|---|---|---|---|---|---|---|---|---|
| 2025-02-14 | JOB / GEE Group Inc. | 9,303,765 | 9,508,737 | 2.20 | 8.69 | 2.24 | ||
| 2025-02-14 | PROV / Provident Financial Holdings, Inc. | 391,349 | 393,420 | 0.53 | 5.88 | 5.00 |
13F dan Pemfailan Dana
Borang ini telah difailkan pada 2025-08-15 untuk tempoh pelaporan 2025-06-30. Klik ikon pautan untuk melihat sejarah transaksi penuh.
Tingkatkan untuk membuka data premium dan eksport ke Excel ![]() .
.
| Sekuriti | Jenis | Purata Harga Saham | Saham (MM) |
ΔSaham (%) |
ΔSaham (%) |
Nilai ($MM) |
Portfolio (%) |
ΔPortfolio (%) |
|
|---|---|---|---|---|---|---|---|---|---|
| SMBC / Southern Missouri Bancorp, Inc. | 0.23 | 0.00 | 12.56 | 5.31 | 13.0819 | -1.4407 | |||
| IE / Ivanhoe Electric Inc. | 0.96 | -11.97 | 8.67 | 37.42 | 9.0332 | 1.3489 | |||
| PROV / Provident Financial Holdings, Inc. | 0.39 | -0.41 | 6.07 | 5.80 | 6.3260 | -0.6640 | |||
| EBC / Eastern Bankshares, Inc. | 0.36 | 0.00 | 5.49 | -6.90 | 5.7230 | -1.4624 | |||
| OFG / OFG Bancorp | 0.12 | 0.00 | 5.14 | 6.93 | 5.3531 | -0.4983 | |||
| VZLA / Vizsla Silver Corp. | 1.69 | -1.75 | 4.97 | 27.24 | 5.1727 | 0.4208 | |||
| LCTX / Lineage Cell Therapeutics, Inc. | 5.39 | -4.43 | 4.89 | 92.07 | 5.0968 | 1.9940 | |||
| UUP / Invesco DB US Dollar Index Trust - Invesco DB US Dollar Index Bullish Fund | 0.16 | 4.30 | 4.4801 | 4.4801 | |||||
| AFBI / Affinity Bancshares, Inc. | 0.20 | 0.00 | 3.66 | 3.51 | 3.8126 | -0.4941 | |||
| ASLE / AerSale Corporation | 0.48 | 6.59 | 2.91 | -14.47 | 3.0364 | -1.1137 | |||
| VMD / Viemed Healthcare, Inc. | 0.40 | 0.00 | 2.78 | -5.08 | 2.8986 | -0.6714 | |||
| FBP / First BanCorp. | 0.13 | 0.00 | 2.77 | 8.64 | 2.8832 | -0.2187 | |||
| GLL / ProShares Trust II - ProShares UltraShort Gold | 0.12 | 2.56 | 2.6666 | 2.6666 | |||||
| SDS / ProShares Trust - ProShares UltraShort S&P500 | 0.12 | 26.26 | 2.08 | -2.02 | 2.1680 | -0.4192 | |||
| NXE / NexGen Energy Ltd. | 0.29 | -4.92 | 2.01 | 46.97 | 2.0965 | 0.4288 | |||
| JOB / GEE Group Inc. | 9.51 | 0.00 | 1.87 | -2.55 | 1.9493 | -0.3897 | |||
| ESOA / Energy Services of America Corporation | 0.17 | -4.91 | 1.68 | 0.00 | 1.7540 | -0.2960 | |||
| MAYS / J.W. Mays, Inc. | 0.04 | -0.00 | 1.67 | -2.11 | 1.7368 | -0.3380 | |||
| PKST / Peakstone Realty Trust | 0.12 | -4.72 | 1.64 | -0.06 | 1.7042 | -0.2903 | |||
| CTGO / Contango Ore, Inc. | 0.07 | -14.83 | 1.39 | 62.57 | 1.4490 | 0.4066 | |||
| NECB / Northeast Community Bancorp, Inc. | 0.06 | 0.00 | 1.38 | -0.79 | 1.4407 | -0.2577 | |||
| JOF / Japan Smaller Capitalization Fund, Inc. | 0.14 | -43.41 | 1.34 | -34.99 | 1.3943 | -1.1126 | |||
| NSTS / NSTS Bancorp, Inc. | 0.09 | -0.04 | 1.16 | 9.16 | 1.2044 | -0.0854 | |||
| MBBC / Marathon Bancorp, Inc. | 0.11 | 1.07 | 1.1170 | 1.1170 | |||||
| MSOS / AdvisorShares Trust - AdvisorShares Pure US Cannabis ETF | 0.41 | 0.00 | 0.99 | -7.66 | 1.0293 | -0.2738 | |||
| UVXY / ProShares Trust II - ProShares Ultra VIX Short-Term Futures ETF | 0.05 | 0.94 | 0.9766 | 0.9766 | |||||
| TURN / 180 Degree Capital Corp. | 0.23 | -16.00 | 0.90 | -15.92 | 0.9408 | -0.3673 | |||
| FBLA / FB Bancorp, Inc. | 0.08 | 6.79 | 0.88 | 6.63 | 0.9219 | -0.0882 | |||
| FNWD / Finward Bancorp | 0.03 | -2.71 | 0.73 | -7.67 | 0.7648 | -0.2034 | |||
| PBPB / Potbelly Corporation | 0.06 | 0.00 | 0.73 | 28.87 | 0.7626 | 0.0705 | |||
| TIPT / Tiptree Inc. | 0.03 | 0.00 | 0.73 | -2.02 | 0.7566 | -0.1470 | |||
| NSSC / Napco Security Technologies, Inc. | 0.02 | -10.94 | 0.73 | 14.90 | 0.7554 | -0.0134 | |||
| VABK / Virginia National Bankshares Corporation | 0.02 | -9.58 | 0.70 | -7.25 | 0.7337 | -0.1913 | |||
| KELYA / Kelly Services, Inc. | 0.05 | 0.00 | 0.61 | -11.14 | 0.6317 | -0.1989 | |||
| RPT / Rithm Property Trust Inc. | 0.21 | 0.00 | 0.56 | -5.90 | 0.5819 | -0.1412 | |||
| NBBK / NB Bancorp, Inc. | 0.03 | 179.60 | 0.56 | 176.62 | 0.5793 | 0.3342 | |||
| SIRI / Sirius XM Holdings Inc. | 0.02 | 0.00 | 0.44 | 1.85 | 0.4593 | -0.0677 | |||
| ECBK / ECB Bancorp, Inc. | 0.03 | -14.03 | 0.43 | -12.53 | 0.4519 | -0.1511 | |||
| NWFL / Norwood Financial Corp. | 0.01 | -30.68 | 0.36 | -26.09 | 0.3723 | -0.2164 | |||
| FRBA / First Bank | 0.02 | -35.04 | 0.32 | -32.11 | 0.3286 | -0.2375 | |||
| HAIN / The Hain Celestial Group, Inc. | 0.20 | 0.30 | 0.3167 | 0.3167 | |||||
| UBCP / United Bancorp, Inc. | 0.02 | 0.00 | 0.26 | 8.02 | 0.2673 | -0.0219 | |||
| BRBS / Blue Ridge Bankshares, Inc. | 0.06 | -6.67 | 0.20 | 2.56 | 0.2092 | -0.0288 | |||
| IAUX / i-80 Gold Corp. | 0.30 | 0.18 | 0.1870 | 0.1870 | |||||
| CLST / Catalyst Bancorp, Inc. | 0.01 | 0.00 | 0.13 | 6.56 | 0.1362 | -0.0135 | |||
| ALTO / Alto Ingredients, Inc. | 0.10 | 0.00 | 0.12 | 0.88 | 0.1198 | -0.0190 | |||
| HHS / Harte Hanks, Inc. | 0.02 | 0.08 | 0.0789 | 0.0789 | |||||
| AWX / Avalon Holdings Corporation | 0.02 | 0.00 | 0.06 | -12.31 | 0.0595 | -0.0198 | |||
| GLL / ProShares Trust II - ProShares UltraShort Gold | 0.00 | -100.00 | 0.00 | 0.0000 | |||||
| RNGR / Ranger Energy Services, Inc. | 0.00 | -100.00 | 0.00 | 0.0000 |